Research Techniques in Animal Ecology - Chapter 9 doc
Bạn đang xem bản rút gọn của tài liệu. Xem và tải ngay bản đầy đủ của tài liệu tại đây (437.31 KB, 44 trang )
Chapter 9
Population Viability Analysis: Data Requirements
and Essential Analyses
Gary C. White
The biological diversity of the earth is threatened by the burgeoning human
population. To prevent extinctions of species, conservationists must manage
many populations in isolated habitat parcels that are smaller than desirable. An
example is maintaining large-bodied predator populations in isolated, limited-
area nature reserves (Clark et al. 1996).
A population has been defined as “a group of individuals of the same
species occupying a defined area at the same time” (Hunter 1996:132). The
viability of a population is the probability that the population will persist for
some specified time. Two procedures are commonly used for evaluating the
viability of a population. Population viability analysis (PVA) is the method of
estimating the probability that a population of a specified size will persist for a
specified length of time. The minimum viable population (MVP) is the small-
est population size that will persist some specified length of time with a speci-
fied probability. In the first case, the probability of extinction is estimated,
whereas in the second, the number of animals that is needed in the population
to meet a specified probability of persistence is estimated. For a population
that is expected to go extinct, the time to extinction is the expected time the
population will persist. Both PVA and MVP require a time horizon: a specified
but arbitrary time to which the probability of extinction pertains.
Definitions and criteria for viability, persistence, and extinction are arbi-
trary, such as a 95 percent probability of a population persisting for at least 100
years (Boyce 1992). Mace and Lande (1991) discussed criteria for extinction.
Ginzburg et al. (1982) suggested the phrase “quasi-extinction risk” as the prob-
ability of a population dropping below some critical threshold, a concept also
Population Viability Analysis
289
promoted by Ludwig (1996a) and Dennis et al. (1991). Schneider and Yodzis
(1994) used the term quasi-extinction to mean a population drop such that only
20 females remain.
The usual approach for estimating persistence is to develop a probability
distribution for the number of years before the model “goes extinct,” or falls
below a specified threshold. The percentage of the area under this distribution
in which the population persists beyond a specified time period is taken as an
estimate of the probability of persistence. To obtain MVP, probabilities of
extinction are needed for various initial population sizes. The expected time to
extinction is a misleading indicator of population viability (Ludwig 1996b)
because for small populations, the probability of extinction in the immediate
future is high, even though the expected time until extinction may be quite
large. The skewness of the distribution of time until extinction thus makes the
probability of extinction for a specified time interval a more realistic measure
of population viability.
Simple stochastic models have yielded qualitative insights into population
viability questions (Dennis et al. 1991). But because population growth is gen-
erally considered to be nonlinear, with nonlinear dynamics making most sto-
chastic models intractable for analysis (Ludwig 1996b), and because catastro-
phes and their distribution pose even more difficult statistical problems
(Ludwig 1996b), analytical methods are generally inadequate to compute
these probabilities. Therefore, computer simulation is commonly used to pro-
duce numerical estimates for persistence or MVP. Analytical models lead to
greater insights given the simplifying assumptions used to develop the model.
However, the simplicity of analytical models precludes their use in real analy-
ses because of the omission of important processes governing population
change such as age structure and periodic breeding. Lack of data suggests the
use of simple models, but lack of data really means lack of information. Lack
of information suggests that no valid estimates of population persistence are
possible because there is no reason to believe that unstudied populations are
inherently simpler (and thus justify simple analytical models) than well-stud-
ied populations for which the inadequacy of simple analytical models is obvi-
ous. The focus of this chapter is on computer simulation models to estimate
population viability via numerical techniques, where the population model
includes the essential features of population change relevant to the species of
interest.
The most thorough recent review of the PVA literature was provided by
Boyce (1992). Shaffer (1981, 1987), Soulé (1987), Nunney and Campbell
290 GARY C. WHITE
(1993), and Remmert (1994) provided a historical perspective of how the field
developed. In this chapter I discuss procedures to develop useful viability
analyses. Specifically, statistical methods to estimate the variance components
needed to develop a PVA, the need to incorporate individual heterogeneity
into a PVA, and the need to incorporate the sampling variance of parameter
estimates used in a PVA are discussed.
Qualitative Observations About Population Persistence
Qualitatively, population biologists know a considerable amount about what
allows populations to persist. Some generalities about population persistence
(Ruggiero et al. 1994) are as follows:
• Connected habitats are better than disjointed habitats.
• Suitable habitats in close proximity to one another are better than widely
separated habitats.
• Late stages of forest development are often better than younger stages.
• Larger habitat areas are better than smaller areas.
• Populations with higher reproductive rates are more secure than those with
lower reproductive rates.
• Environmental conditions that reduce carrying capacity or increase vari-
ance in the growth rates of populations decrease persistence probabilities.
This list should be taken as a general set of principles, but you should rec-
ognize that exceptions occur often. In the following section, I discuss these
generalities in more detail and suggest contradictions that occur.
GENERALITIES
Typically, recovery plans for an endangered species try to create multiple pop-
ulations of the species, so that a single catastrophe will not wipe out the entire
species, and increase the size of each population so that genetic, demographic,
and normal environmental uncertainties are less threatening (Meffe and Car-
roll 1994). However, Hess (1993) argued that connected populations can have
Population Viability Analysis
291
lower viability over a narrow range in the presence of a fatal disease transmit-
ted by contact. He demonstrated the possibilities with a model, but had no
data to support his case. However, the point he made seems biologically
sound, and the issue can be resolved only by optimizing persistence between
these two opposing forces.
Spatial variation, that is, variation in habitat quality across the landscape,
affects population persistence. Typically, extinction and metapopulation theo-
ries emphasize that stochastic fluctuations in local populations cause extinc-
tion and that local extinctions generate empty habitat patches that are then
available for recolonization. Metapopulation persistence depends on the bal-
ance of extinction and colonization in a static environment (Hanski 1996;
Hanski et al. 1996). For many rare and declining species, Thomas (1994)
argued that extinction is usually the deterministic consequence of the local
environment becoming unsuitable (through habitat loss or modification,
introduction of a predator, etc.); that the local environment usually remains
unsuitable following local extinction, so extinctions only rarely generate
empty patches of suitable habitat; and that colonization usually follows
improvement of the local environment for a particular species (or long-dis-
tance transfer by humans). Thus persistence depends predominantly on
whether organisms are able to track the shifting spatial mosaic of suitable envi-
ronmental conditions or on maintenance of good conditions locally.
Foley (1994) used a model to agree that populations with higher repro-
ductive rates are more persistent. However, mammals with larger body size can
persist at lower densities (Silva and Downing 1994) and typically have lower
annual and per capita reproductive rates. Predicted minimal density decreases
as the –0.68 power of body mass, probably because of less variance in repro-
duction relative to life span in larger-bodied species.
The last item on the list—that environmental conditions that reduce car-
rying capacity or increase variance in the growth rates of populations decrease
persistence probabilities—suggests that increased variation over time leads to
lower persistence (Shaffer 1987; Lande 1988, 1993). One reason that in-
creased temporal variation causes lowered persistence is that catastrophes such
as hurricanes, fires, or floods are more likely to occur in systems with high tem-
poral variation. Populations in the wet tropics can apparently sustain them-
selves at densities much lower than those in temperate climates, probably
because of less environmental variation. The distinction between a catastrophe
and a large temporal variance component is arbitrary, and on a continuum
(Caughley 1994). Furthermore, even predictable effects can have an impact.
Beissinger (1995) modeled the effects of periodic environmental fluctuations
292 GARY C. WHITE
on population viability of the snail kite (Rostrhamus sociabilis) and suggested
that this source of variation is important in persistence.
CONTRADICTIONS
Few empirical data are available to support the generalities just mentioned, but
exceptions exist. Berger (1990) addressed the issue of MVP by asking how
long different-sized populations persist. He presented demographic and
weather data spanning up to 70 years for 122 bighorn sheep (Ovis canadensis)
populations in southwestern North America. His analyses revealed that 100
percent of the populations with fewer than 50 individuals went extinct within
50 years, populations with more than 100 individuals persisted for up to 70
years, and the rapid loss of populations was not likely to be caused by food
shortages, severe weather, predation, or interspecific competition. Thus, 50
individuals, even in the short term of 50 years, are not a minimum viable pop-
ulation size for bighorn sheep. However, Krausman et al. (1993) questioned
this result because they know of populations of 50 or less in Arizona that have
persisted for more than 50 years.
Pimm et al. (1988) and Diamond and Pimm (1993) examined the risks of
extinction of breeding land birds on 16 British islands in terms of population
size and species attributes. Tracy and George (1992) extended the analysis to
include attributes of the environment, as well as species characteristics, as
potential determinants of the risk of extinction. Tracy and George (1992) con-
cluded that the ability of current models to predict the risk of extinction of
particular species on particular island is very limited. They suggested that
models should include more specific information about the species and envi-
ronment to develop useful predictions of extinction probabilities. Haila and
Hanski (1993) criticized the data of Pimm et al. (1988) as not directly relating
to extinctions because the small groups of birds breeding in any given year on
single islands were not populations in a meaningful sense. Although this criti-
cism may be valid, most of the “populations” that conservation biologists
study are questionable. Thus results of the analysis by Tracy and George
(1992) do contribute useful information because the populations they studied
are representative of populations to which PVA techniques are applied. Specif-
ically, small populations of small-bodied birds on oceanic islands (more iso-
lated) are more likely to go extinct than are large populations of large-bodied
birds on less isolated (channel) islands. However, interaction of body size with
type of island (channel vs. oceanic) indicated that body size influences time to
extinction differently depending on the type of island. The results of Tracy and
Population Viability Analysis
293
George (1992, 1993) support the general statements presented earlier in this
chapter. As with all ecological generalities, exceptions quickly appear.
Sources of Variation Affecting Population Persistence
The persistence of a population depends on stochasticity, or variation (Dennis
et al. 1991). Sources of variation, and their magnitude, determine the proba-
bility of extinction, given the population growth mechanisms specific to the
species. The total variance of a series of population measurements is a function
of process variation (stochasticity in the population growth process) and sam-
pling variation (stochasticity in measuring the size of the population). Process
variation is a result of demographic, temporal and spatial (environmental), and
individual (phenotypic and genotypic) variation. In this section, I define these
sources of variation more precisely and develop a simple mathematical model
to illustrate these various sources of stochasticity, thus demonstrating how sto-
chasticity affects persistence.
NO VARIATION
Consider a population with no variation, one that qualifies for the simple,
density-independent growth model N
t +1
= N
t
(1 + R), where N
t
is the popula-
tion size at time t and R is the finite rate of change in the population. This
model is deterministic, and hence, so is the population. R ≥ 0 guarantees that
the population will persist, in contrast to R < 0, which guarantees that the pop-
ulation will go extinct (albeit in an infinite amount of time because a fraction
of an animal is allowed in this model). R can be considered to be a function of
birth and death rates, so that R = b – d defines the rate of change in the popu-
lation as a function of birth rate (b) and death rate (d ). When the birth rate
exceeds or equals the death rate, the population will persist with probability 1
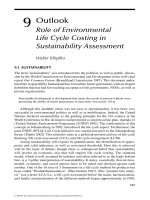
in this deterministic model. These examples are illustrated in figure 9.1.
STOCHASTIC VARIATION
Let us extend this naive model by making it stochastic. I will change the
parameter R to be a function of two random variables. At each time t, I deter-
mine stochastically the number of animals to be added to the population by
births and then the number to be removed by deaths. Suppose the birth rate
294 GARY C. WHITE
Figure 9.1 Deterministic model of population growth. For values of
R
≥ 0, the population persists
indefinitely. For values of
R
< 0, the population will eventually go extinct in that the number of ani-
mals will approach zero.
equals the death rate, say b = d = 0.5. That is, on average 50 percent of the N
t
animals would give birth to a single individual and provide additions to the
population, and 50 percent of the N
t
animals would die and be removed from
the population. Thus the population is expected to stay constant because the
number of births equals the number of deaths. A reasonable stochastic model
for this process would be a binomial distribution. For the binomial model, you
can think of flipping a coin twice for each animal. The first flip determines
whether the animal gives birth to one new addition to the population in N
t +1
and the second flip determines whether the animal currently a member of N
t
remains in the population for another time interval, to be a member of N
t +1
,
or dies. If we start with N
0
= 100, what is the probability that the population
will persist until t = 100? Three examples are shown in figure 9.2.
You might be tempted to say the probability is 1 that the population will
persist until t = 100 because the expected value of R is 0 given that the birth
rate equals the death rate—that is, E(R) = 0, so that E(N
t +1
) = E(N
t
). You
would be wrong! Implementation of this model on a computer shows that the
probability of persistence is 98.0 percent; that is, 2.0 percent of the time the
Population Viability Analysis
295
Figure 9.2 Three examples of the outcome of the population model with only demographic varia-
tion. The smaller population goes extinct at time 93. Birth and death probabilities are both 0.5, mak-
ing the expected value of
R
= 0.
population does not persist for 100 years without N
t
becoming 0 for some t.
These estimates were determined by running the population model 10,000
times and recording the number of times the simulated population went
extinct before 100 years had elapsed. Lowering the initial population to N
0
=
20 results in persistence of only 53.2 percent of the populations, again based
on 10,000 runs of the model. Setting N
0
= 500 improves the persistence rate
to nearly 100 percent. Note that the persistence is not linear in terms of N
0
(figure 9.3). Initial population size has a major influence on persistence.
DEMOGRAPHIC VARIATION
Other considerations affect persistence. The value of R (the birth rate minus the
death rate) is critical. R can be negative (death rate exceeds birth rate) and the
population can still persist for 100 years, which may seem counterintuitive.
Furthermore, R can be positive (birth rate exceeds death rate) and the popula-
tion can still go extinct. For example, suppose R is increased to 0.02 by making
the birth rate 0.51 and the death rate 0.49. The persistence for N
0
= 20 increases
296 GARY C. WHITE
Figure 9.3 Persistence of a population as a function of initial population size (
N
0
) when only demo-
graphic variation is incorporated into the model. Birth and death probabilities are both 0.5, making
the expected value of
R
= 0. The model was run 10,000 times to estimate the percentage of runs in
which the population persisted until
t
= 100.
to 84.3 percent from 53.2 percent for R = 0. Even though the population is
expected to increase, stochasticity can still cause the population to go extinct.
The type of stochasticity illustrated by this model is known as demo-
graphic variation. I like to call this source of variation “penny-flipping varia-
tion” because the variation about the expected number of survivors parallels
the variation about the observed number of heads from flipping coins. To illus-
trate demographic variation, suppose the probability of survival of each indi-
vidual in a population is 0.8. Then on average, 80 percent of the population
will survive. However, random variation precludes exactly 80 percent surviv-
ing each time this survival rate is applied. From purely bad luck on the part of
the population, a much lower proportion may survive for a series of years,
resulting in extinction. Because such bad luck is most likely to happen in small
populations, this source of variation is particularly important for small popu-
lations, hence the name demographic variation. The impact is small for large
populations. As the population size becomes large, the relative variation
decreases to zero. That is, the variance of N
t +1
/N
t
goes to zero as N
t
goes to
Population Viability Analysis
297
infinity. Thus demographic variation is generally not an issue for persistence of
larger populations.
To illustrate further how demographic variation operates, consider a small
population with N = 100 and a second population with N = 10,000. Assume
both populations have identical survival rates of 0.8. With a binomial model
of the process, the probability that only 75 percent or less of the small popula-
tion survives is 0.1314 for the small population, but 3.194E – 34 for the larger
population. Thus the likelihood that up to 25 percent of the small population
is lost in 1 year is much higher than for the large population.
TEMPORAL VARIATION
A feature of all population persistence models is evident in figure 9.2. That is,
the variation of predicted population size increases with time. Some realiza-
tions of the stochastic process climb to very large population values after long
time periods, whereas other realizations drop to zero and extinction. This
result should be intuitive because as the model is projected further into the
future, certainty about the projections decreases.
However, in contrast to population size, our certainty about the extinction
probability increases as time increases to infinity. The probability of eventual
extinction is always unity if extinction is possible. This is because the only
absorbing state of the stochastic process is extinction; that is, the only popula-
tion size at which there is no chance of change is zero.
Another way to decrease persistence is to increase the stochasticity in the
model. One way would be to introduce temporal variation by making b and d
random variables. Such variation would be exemplified by weather in real
populations. Some years, winters are mild and survival and reproduction are
high. Other years, winters are harsh and survival and reproduction are poor. To
incorporate this phenomenon into our simple model, suppose that the mean
birth and death rates are again 0.5, but the values of the birth rate and the
death rate at a particular time t are selected from a statistical distribution, say
a beta distribution. That is, each year, new values of b and d are selected from
a beta distribution.
A beta distribution is bounded by the interval 0–1 and can take on a vari-
ety of shapes. For a mean of 0.5, the distribution is symmetric about the mean,
but the amount of variation can be changed by how peaked the distribution is
(figure 9.4).
The beta distribution is described by two parameters, α > 0 and β > 0. The
298 GARY C. WHITE
Figure 9.4 Examples of the beta distribution, all with mean 0.5. The standard deviations proceed-
ing from the tallest curve to the lowest curve at
x
= 0.5 are 0.05 to 0.3 in increments of 0.05.
mean of the distribution is given by α/(α + β) and the variance as αβ/[(α +
β)
2
(α + β + 1)], with the mode (α – 1)/(α + β – 2) (mode only for α ≥ 1). Most
random number generation techniques for the beta distribution require you to
specify values for α and β. For a given mean (µ) and variance (σ
2
) or standard
deviation (σ),
α
=
ᎏ
µ
2
(
σ
1
2
–
µ
)
ᎏ
–
µ
and
β
=
However, the amount of variation possible is limited because the distribution
is bounded on the [0, 1] interval. Thus for a mean of 0.5, the maximum vari-
ance approaches 0.25 as α and β approach zero.
The standard deviations of the birth and death rates over time affect per-
[
σ
2
+
µ
(
µ
– 1)](
µ
– 1)
ᎏᎏᎏ
σ
2
Population Viability Analysis
299
sistence because these values determine the standard deviation of R. The
smaller the standard deviations, the more the model approaches the demo-
graphic variation case, and thus, as N
t
approaches infinity, the deterministic
case. As the standard deviation increases, the more the variation in N
t
, regard-
less of population size, and the less likely the population is to persist. Thus a
standard deviation of 0.2 for both the birth and death rates results in only 28.5
percent persistence for N
0
= 100. Compare this to the 77.4 percent persistence
achieved for a standard deviation of 0.1 (figure 9.5) or to the 98.0 percent per-
sistence when no variation in birth and death rates occurred but demographic
variation is still present.
This second source of variation in our simple model is temporal variation,
that is variation in the parameters of the model across time. As the example
shows, increasing temporal variation decreases persistence. The simple model
illustrated assumed that no correlation existed between the birth rate and the
death rate, that is, that the two rates were independent. However, in real pop-
ulations there is probably a high correlation between birth rates and death rates
across years. Good years with lots of high-quality resources available to the ani-
Figure 9.5 Persistence of a population of 100 animals at
t
= 0 to
t
= 100 years as a function of the
standard deviation of birth (mean = 0.5) and death (mean = 0.5) rates (temporal variation). Demo-
graphic variation is still included in the model.
300 GARY C. WHITE
mals probably result in increased reproduction and survival, whereas bad years
result in poor reproduction and high mortality. Including a negative covari-
ance of birth and death rates (or a positive covariance between birth and sur-
vival rates) in the model results in an even bigger impact of temporal variation
on persistence. That is, the bad years are really bad because of both poor repro-
duction and high mortality, and the good years are really good. The net effect
of this negative covariance of birth and death rates is to decrease persistence.
SPATIAL VARIATION
Spatial variation is the variation across the landscape that is normally associ-
ated with populations. Factors causing geographic variation include geologic
differences that affect soil type, and thus habitat, and weather patterns (e.g.,
differences in rainfall across the landscape). If the immigration and emigration
rates are high across the landscape, so that subpopulations are depleted because
of local conditions, high spatial variation can lead to higher persistence. This
is because the probability of all the subpopulations of a population being
affected simultaneously by some catastrophe is low when high spatial variation
exists and spatial autocorrelation is low. High positive spatial autocorrelation
causes low levels of spatial variation, whereas high negative spatial autocorrela-
tion causes high levels of spatial variation, as low levels of spatial autocorrela-
tion generally do. In contrast, with low spatial variation (and hence high pos-
itive spatial autocorrelation), the likelihood of a bad year affecting the entire
population is high. Thus, in contrast to temporal variation, where increased
variation leads to lowered persistence, increased spatial variation and low spa-
tial autocorrelation lead to increased persistence, given that immigration and
emigration are effectively mixing the subpopulations. If immigration and emi-
gration are negligible, then spatial variation divides the population into
smaller subpopulations, which are more likely to suffer extinction from the
effect of demographic variation on small populations. The combination of
temporal and spatial variation is called environmental variation. Both dictate
the animal’s environment, one in time, one in space.
INDIVIDUAL VARIATION
All the models examined so far assume that each animal in the population has
exactly the same chance of survival and reproducing, even though these rates
change with time. What happens if each animal in the population has a differ-
ent rate of survival and reproduction? Differences between the individuals in
Population Viability Analysis
301
the population are called individual heterogeneity, and this creates individual
variation. Many studies have demonstrated individual heterogeneity of indi-
vidual survival and reproductions; for example, Clutton-Brock et al. (1982)
demonstrated that lifetime reproductive success of female red deer (Cervus ela-
phus) varied from 0 to 13 calves reared per female. Differences in the frequency
of calf mortality between mothers accounted for a larger proportion of vari-
ance in success than differences in fecundity. Bartmann et al. (1992) demon-
strated that overwinter survival of mule deer fawns was a function of the fawn’s
weight at the start of the winter, with larger fawns showing better survival.
Individual variation is caused by genetic variation, that is, differences
between individuals because of their genome. Individual heterogeneity is the
basis of natural selection; that is, differences between animals is what allows
natural selection to operate. However, phenotypic variation is also possible,
where individual heterogeneity is not a result of genetic variation. Animals that
endure poor nutrition during their early development may never be as healthy
and robust as animals that are on a higher nutritional plane, even though both
are genetically identical. Animals with access to more and better resources have
higher reproductive rates, as in the red deer studied by Clutton-Brock et al.
(1982). Thus individual heterogeneity may result from both genetic and phe-
notypic variation. Lomnicki (1988) developed models of resource partitioning
that result in phenotypic variation of individuals.
Another example of individual heterogeneity in reproduction was provided
by Burnham et al. (1996) in northern spotted owls (Strix occidentalis caurina).
In the case of northern spotted owls, repeated observations of reproduction
across numerous individuals were used to estimate individual variation with
analysis of variance procedures. The age of the female produced individual het-
erogeneity. This study also demonstrated temporal and spatial variation in owl
fecundity rates.
Undoubtedly, natural selection plays a role in the genetic variation left in a
declining population. Most populations for which we are concerned about
extinction probabilities have suffered a serious decline in numbers. The geno-
types remaining after a severe decline are unlikely to be a random sample of the
original population (Keller et al. 1994). I expect that the genotypes persisting
through a decline are the “survivors,” and would have a much better chance of
persisting than would a random sample from the population before the decline.
Of course, this argument assumes that the processes causing the decline remain
in effect, so that the same natural selection forces continue to operate.
To illustrate individual variation, start with the basic demographic varia-
tion model developed earlier in this chapter. Instead of each animal having
302 GARY C. WHITE
Figure 9.6 Effect of individual variation on population persistence. The three lines from top to bot-
tom have standard deviations of 0.1, 0.05, and 0.01 for the birth and death rates. Compare these
results with figure 9.3, where the standard deviation of individual variation is zero.
exactly a birth rate of 0.5 and a death rate of 0.5, let’s select these values from
beta distributions with a mean of 0.5. The birth and death rates assigned to an
animal remain for its lifetime. As new animals are added to the population,
they likewise are assigned lifetime birth and death rates. How does persistence
of this new model compare with the results from the demographic model? The
answer is in figure 9.6.
The reason that increased individual heterogeneity increases population
persistence is that increased variation results in more chance that a few animals
have exceptionally high reproductive potential and high survival. Therefore,
these animals are unlikely to suffer mortality and be removed from the popu-
lation and can be relied on to contribute new births each year. As a result, the
population may remain small but will not go extinct as often. Individual het-
erogeneity has seldom, if ever, been included in a population viability analysis,
except as genetic variation. Yet as this simple example shows, individual het-
erogeneity not a function of genetic variation is a very important element in
maintaining viability.
Population Viability Analysis
303
PROCESS VARIATION
The combined effect of demographic, temporal, spatial, and individual varia-
tion is called process varisation. That is, each of these sources of variation
affects population processes. Process variation is used as a general term for the
inherent stochasticity of changes in the population level. Process variation is in
contrast to sampling variation, which is the variation contributed when biolo-
gists attempt to measure population processes. That is, researchers are unable
to measure the exact survival rate of a population. Rather, they observe real-
izations of the process, but not the exact value. Even if the fate of every animal
in the population is observed, the resulting estimate of survival is only an esti-
mate of the true but unknown population survival rate. The concept of sam-
pling variation is explained later in this chapter, where methods of separating
sampling variation from process variation are developed.
Several lessons should be learned from this simple exercise. Persistence is a
stochastic phenomenon. Even though the expected outcome for a particular
model is to persist, random variation prevents this outcome from always
occurring. Small populations are much more likely to go extinct than larger
populations because of demographic variation. Increased temporal variation
results in decreased persistence. Increased individual variation results in
increased persistence.
Components of a PVA
As demonstrated earlier in this chapter, many factors affect the persistence of a
population. What components are needed to provide estimates of the proba-
bility that a population will go extinct, and what are the tradeoffs if not all
these components are available?
• A basic population model is needed. A recognized mechanism of popula-
tion regulation, density dependence, should be incorporated because no pop-
ulation can grow indefinitely. “Of course, exponential growth models are
strictly unrealistic on time scales necessary to explore extinction probabilities”
(Boyce 1992:489). The population cannot be allowed to grow indefinitely, or
persistence will be overestimated. Furthermore, as discussed later in this chap-
ter, the shape of the relationship between density and survival and reproduc-
tion can affect persistence, and density dependence cannot be neglected for
moderate or large populations (Ludwig 1996b). Density dependence can pro-
vide a stabilizing influence that increases persistence in small populations.
304 GARY C. WHITE
• Demographic variation must be incorporated in this basic model. Other-
wise, estimates of persistence will be too high because the effect of demo-
graphic variation for small populations is not included in the model.
• Temporal variation must be included for the parameters of the model,
including some probability of a natural catastrophe. Examples of catastrophes
(for some species) are fires (e.g., Yellowstone National Park, USA, 1988), hur-
ricanes, typhoons, earthquakes, and extreme drought or rainfall resulting in
flooding. Catastrophes must be rare, or else the variation would be considered
part of the normal temporal variation. However, the covariance of the param-
eters is also important. Good years for survival are probably also good years for
reproduction. Likewise, bad years for reproduction may also lead to increased
mortality. The impact of this correlation of reproduction and survival can
drastically affect results. For example, the model of Stacey and Taper (1992) of
acorn woodpecker population dynamics performs very differently depending
on whether adult survival, juvenile survival, and reproduction are boot-
strapped as a triplet or given as individual rates across the 10-year period. If the
positive correlation of the survival rates and reproduction is included in the
model, estimated persistence is improved.
• Spatial variation in the parameters of the model must be incorporated if the
population is spatially segregated. If spatial attributes are to be modeled, then
immigration and emigration parameters must be estimated, as well as dispersal
distances. The difficulty of estimating spatial variation is that the covariance of
the parameters must be estimated as a function of distance; that is, what is the
covariance of adult survival of two subpopulations as a function of distance?
• Individual heterogeneity must be included in the model or the estimates of
persistence will be too low. Individual heterogeneity requires that the basic
model be extended to an individual-based model (DeAngelis and Gross 1992).
As the variance of individual parameters increases in the basic model, the per-
sistence time increases. Thus, instead of just knowing estimates of the param-
eters of our basic model, we also need to know the statistical distributions of
these parameters across individuals. This source of variation is not mentioned
in discussions of population viability analysis such as Boyce (1992), Remmert
(1994), Hunter (1996), Meffe and Carroll (1994), or Shaffer (1981, 1987).
• For short-term projects, the sources of variation just mentioned may be
adequate. However, if time periods of more than a few generations are pro-
Population Viability Analysis
305
jected, then genetic variation should be considered. I would expect the popu-
lation to change as selection takes place. Even if no selection is operating,
genetic drift is expected for small population sizes. However, the importance
of genetic effects is still an issue in question; see Joopouborg and Van Groe-
nendael (1996). Lande (1988, 1995) suggested that demographic variation or
genetic effects can be lethal to a small population.
• For long-term persistence, we must be willing to assume that the system
will not change, that is, that the levels of stochasticity will not change through
time, the species will not evolve through selection, and the supporting capac-
ity of the environment (the species habitat) remains static. We must assume
that natural processes such as long-term succession and climatic change do not
affect persistence and that human activity will cease (given that humans have
been responsible for most recent extinctions). To believe the results, we have to
assume that the model and all its parameters stay the same across inordinately
long time periods.
After examining this list, I am sure you will agree with Boyce (1992:482):
“Collecting sufficient data to derive reliable estimates for all the parameters
necessary to determine MVP is simply not practical in most cases.” Of course,
limitations of the data seldom slow down modelers of population dynamics.
Furthermore, managers are forced to make decisions, so modelers attempt to
make reasonable guesses. In the next three sections, I explore statistical meth-
ods to obtain the necessary data to develop a reasonable PVA model and sug-
gest modeling techniques to incorporate empirical data into the persistence
model.
Direct Estimation of Variance Components
The implication of the list of requirements in the previous section is that pop-
ulation parameters or their distributions are known without error; that is,
exact parameter values are observed, not estimated. In reality, we may be for-
tunate and have a series of survival or reproduction estimates across time that
provides information about the temporal variation of the process. However,
the variance of this series is not the proper estimate of the temporal variation
of the process. This is because each of our estimates includes sampling varia-
tion; that is we have only an estimate of the true parameter, not its exact value.
To properly estimate the temporal variation of the series, the sampling variance
of the estimates must be removed. In this section, I demonstrate a procedure
306 GARY C. WHITE
to remove the sampling variance from a series of estimates to obtain an esti-
mate of the underlying process variation (which might be temporal or spatial
variation). The procedure is explained in Burnham et al. (1987).
Consider the example situation of estimating overwinter survival rates each
year for 10 years from a deer population. Each year, the survival rate is differ-
ent from the overall mean because of snow depth, cold weather, and other fac-
tors. Let the true but unknown overall mean be S. Then the survival rate for
each year can be considered to be S plus some deviation attributable to tem-
poral variation, with the expected value of the e
i
equal to zero:
Environmental Variation
Mean Year I Year I
1 SS+ e
1
S
1
2 SS+ e
2
S
2
3 SS+ e
3
S
3
4 SS+ e
4
S
4
5 SS+ e
5
S
5
6 SS+ e
6
S
6
7 SS+ e
7
S
7
8 SS+ e
8
S
8
9 SS+ e
9
S
9
10 SS+ e
10
S
10
Mean SS
ෆ
S
ෆ
The true population mean S is computed as S
ෆ
:
S
ෆ
=
ᎏ
10
ᎏ
with the variance of the S
i
is computed as
σ
2
=
ᎏ
10
ᎏ
⌺
10
i=1
S
i
⌺
10
i=1
(S
i
– S
ෆ
)
2
Population Viability Analysis
307
where the random variables e
i
are selected from a distribution with mean 0 and
variance σ
2
. In reality, we are never able to observe the annual rates because of
sampling variation or demographic variation. For example, even if we observed
all the members of a population, we would still not be able to say the observed
survival rate was S
i
because of demographic variation. Consider flipping 10
coins. We know that the true probability of a head is 0.5, but we will not always
observe that value exactly. If you have 11 coins; the true value is not even in the
set of possible estimates. The same process operates in a population as demo-
graphic variation. Even though the true probability of survival is 0.5, we would
not necessarily see exactly half of the population survive on any given year.
Hence, what we actually observe are the quantities following:
Environmental Variation + Sampling Variation
I Mean Truth Year I Observed Year I
1 SS+ e
1
+ f
1
S
ˆ
1
2 SS+ e
2
+ f
2
S
ˆ
2
3 SS+ e
3
+ f
3
S
ˆ
3
4 SS+ e
4
+ f
4
S
ˆ
4
5 SS+ e
5
+ f
5
S
ˆ
5
6 SS+ e
6
+ f
6
S
ˆ
6
7 SS+ e
7
+ f
7
S
ˆ
7
8 SS+ e
8
+ f
8
S
ˆ
8
9 SS+ e
9
+ f
9
S
ˆ
9
10 SS+ e
10
+ f
10
S
ˆ
10
Mean SS
ෆ
S
ˆ
–
where the e
i
are as before, but we also have additional variation from sampling
variation, or demographic variation, or both, in the f
i
.
The usual approach to estimating sampling variance separately from tem-
poral variance is to take replicate observations within each year so that within-
cell replicates can be used to estimate the sampling variance, whereas the be-
tween-cell variance is used to estimate the environmental variation. Years are
assumed to be a random effect, and mixed-model analysis of variance proce-
dures are used (e.g., Bennington and Thayne 1994). This approach assumes that
each cell has the same sampling variance. An example of the application of a
random effects model is Koenig et al. (1994). They considered year effects,
species effects, and individual tree effects on acorn production by oaks in cen-
tral California.
Classic analysis of variance methodology assumes that the variance within
308 GARY C. WHITE
cells is constant across a variety of treatment effects. This assumption is often
not true; that is, the sampling variance of a binomial distribution is a function
of the binomial probability. Thus, as the probability changes across cells, so does
the variance. Another common violation of this assumption is caused by the
variable of interest being distributed log-normally, so that the coefficient of
variation is constant across cells and the cell variance is a function of the cell
mean. Furthermore, the empirical estimation of the variance from replicate
measurements may not be the most efficient procedure. Therefore, the re-
mainder of this section describes methods that can be viewed as extensions of
the usual variance component analysis based on replicate measurements within
cells. We examine estimators for the situation in which the within-cell variance
is estimated by an estimator other than the moment estimator based on repli-
cate observations.
Assume that we can estimate the sampling variance for each year, given a
value of S
ˆ
i
for the year. For example, an estimate of the sampling variation for
a binomial is
vâr(S
i
ԽS
i
) =
ᎏ
S
i
(
1
n
–
i
S
i
)
ᎏ
where n
i
is the number of animals monitored to see whether they survived.
Then, can we estimate the variance term due to environmental variation, given
that we have estimates of the sampling variance for each year?
If we assume all the sampling variances are equal, the estimate of the over-
all mean is still just the mean of the 10 estimates:
S
–
=
ᎏ
10
ᎏ
with the theoretical variance being
var(S
–
) =
ᎏ
σ
2
+
Ε
[v
1
a
0
r(S
ԽS)]
ᎏ
⌺
10
i=1
S
i
Population Viability Analysis
309
i.e., the total variance is the sum of the environmental variance plus the
expected sampling variance. This total variance can be estimated as
va
r(S
–
) =
ᎏ
10(10 – 1)
ᎏ
We can estimate the expected sampling variance as the mean of the sam-
pling variances
E
[var(S
ԽS)] =
ᎏ
10
ᎏ
so that the estimate of the environmental variance is obtained by solving for
σ
2
σ
2
=
ᎏ
(10–1)
ᎏ
–
ᎏ
10
ᎏ
However, sampling variances are usually not all equal, so we have to weight
them to obtain an unbiased estimate of σ
2
. The general theory says to use a
weight, w
i
,
w
i
=
ᎏ
σ
2
+var
1
S
i
ԽS
i
ᎏ
so that by replacing var(S
ˆ
i
ԽS
i
) with its estimator vâr(S
ˆ
i
ԽS
i
), the estimator of the
weighted mean is
⌺
10
i=1
S
i
– S
–
2
⌺
10
i=1
va
rS
i
ԽS
i
⌺
10
i=1
S
i
– S
–
2
⌺
10
i=1
va
rS
i
ԽS
i
310 GARY C. WHITE
S
–
=
ᎏᎏ
with theoretical variance (i.e., sum of the theoretical variances for each of the
estimates)
var(S
–
) =
ᎏ
1
ᎏ
and empirical variance estimator
va
r(S
–
) =
When the w
i
are the true (but unknown) weights, we have
ᎏ
1
ᎏ =
ᎏᎏ
giving the following
1 =
ᎏ
10–1
ᎏ
⌺
10
i=1
w
i
S
i
⌺
10
i=1
w
i
⌺
10
i=1
w
i
⌺
10
i=1
w
i
(
⌺
10
i=1
w
i
)
(10 – 1)
(
⌺
10
i=1
w
i
)
(10 – 1)
⌺
10
i=1
w
i
S
i
– S
–
2
⌺
10
i=1
w
i
S
i
– S
–
2
⌺
10
i=1
w
i
S
i
– S
–
2
Population Viability Analysis
311
Therefore, all we have to do is manipulate this equation with a value of σ
2
to
obtain an estimator of σ
2
.
To obtain a confidence interval on the estimator of σ
2
, we can substitute
the appropriate chi-square values in this relationship. To find the upper confi-
dence interval value, σ
2
U
solve the equation
ᎏ
10–1
ᎏ
=
and for the lower confidence interval value, σ
2
L
solve the equation
ᎏ
10
–
1
ᎏ
=
ᎏ
χ
1
2
0
10
–
–1,
1
α
U
As an example, consider the following fawn survival data from overwinter
survival of mule deer fawns at the Little Hills Wildlife Area, west of Meeker,
Colorado, USA.
Estimated Estimated
Year Collared Lived Survival Variance
1981 46 15 0.3260870 0.0047773
1982 114 38 0.3333333 0.0019493
1983 118 5 0.0423729 0.0003439
1984 106 19 0.1792453 0.0013879
1985 155 59 0.3806452 0.0015210
1986 161 61 0.3788820 0.0014617
1987 116 15 0.1293103 0.0009706
The survival rates are the number of collared animals that lived divided by
the total number of collared animals. For example, S
ˆ
1981
= 15/46 = 0.326087
for 1981. The sampling variance associated with this estimate is computed
as
⌺
10
i=1
w
i
S
i
– S
–
2
⌺
10
i=1
w
i
S
i
– S
–
2
10 – 1
10 – 1
10 – 1
χ
2
10–1, α
L
312 GARY C. WHITE
var(S
1981
) =
ᎏ
S
1981
(1
46
– S
1981
)
ᎏ
which equals 0.0047773. A spreadsheet program (VARCOMP.WB1) com-
putes the estimate of temporal process variation for 1981–87, σ
ˆ
2
, as 0.0170632
(σ
ˆ
= 0.1306262), with a 95 percent confidence interval of (0.0064669,
0.0869938) for σ
2
, and (0.0804167, 0.2949472) for σ. These confidence
intervals represent the uncertainty of the estimate of temporal variation, that is,
the sampling variation of the estimate of temporal variation.
The procedure demonstrated here is applicable to estimation of other
sources of variation (e.g., spatial variation) and to variables other than survival
rates, such as per capita reproduction. The method is more general than the
usual analysis of variance procedures because each observation is not assumed
to have the same variance, in contrast to analysis of variance, in which each cell
is assumed to have the same within-cell variance.
Indirect Estimation of Variance Components
Individual heterogeneity occurs in both reproduction and survival. Estimation
of individual variation in reproduction is an easier problem than estimation of
individual variation in survival because some animals reproduce more than
once, whereas they only die once. Bartmann et al. (1992) demonstrated that
overwinter survival of mule deer fawns is related to their mass at the start of the
winter. Thus one approach to modeling individual heterogeneity is to find a
correlate of survival that can be measured and develop statistical models of the
distribution of this correlate. Then, the distribution of the correlate can be sam-
pled to obtain an estimate of survival for the individual. Lomnicki (1988) also
suggests mass as an easily measured variable that relates to an animal’s fitness.
To demonstrate this method, I use a simplification of the logistic regression
model of Bartmann et al. (1992):
log
ᎏ
1
S
– S
ᎏ
=
β
0
+
β
1
mass
where survival (S) is predicted as a function of weight. Weight of fawns at the
start of winter was approximately normally distributed, with mean 32 kg and