Học Actionscript 3.0 - p 34 docx
Bạn đang xem bản rút gọn của tài liệu. Xem và tải ngay bản đầy đủ của tài liệu tại đây (5.68 MB, 10 trang )
Changing Sound Volume and Pan
Chapter 11: Sound
309
and positive interim values reflect some degree of pan right. The following
script sets the
channel instance to a pan setting of full left:
var trans:SoundTransform = new SoundTransform();
trans.pan = -1;
channel.soundTransform = trans;
To transform all playing sounds at once, substitute the specified channel
with the master
SoundMixer class. For example, the following script mutes
all sounds:
var trans:SoundTransform = new SoundTransform();
trans.volume = 0;
SoundMixer.soundTransform = trans;
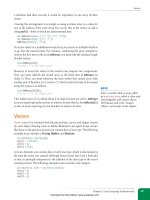
Now let’s apply what we’ve learned to our ongoing player example. The fol-
lowing code can be found in the
player_transform.fla source file, and demon-
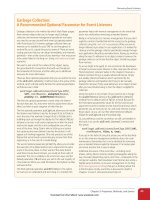
strates both volume and pan by using mouse coordinates. Figure 11-2 shows
how the mouse will affect the sound transformation. Moving the mouse left
and right pans the sound left and right. Moving the mouse up and down
fades the volume up and down.
stage origin
{x:0, y:0}
default direction of increasing y values
(will be inverted for usability using ActionScript)
center of stage
Figure 11-2. How the mouse affects sound volume and panning in the adaption made to
the sound player project
Line 104 creates a SoundTransform instance and lines 105 through 109 con-
tain the
onPlayProgress() function that will set and apply the transforma-
tions. This function will be called from the enter frame event listener function
created earlier, which we’ll adapt in a moment.
Download from Wow! eBook <www.wowebook.com>
Part IV: Sound and Video
310
Changing Sound Volume and Pan
To set these changes with the mouse in a natural and intuitive way, we need
to think about ActionScript mouse coordinates and apply a little math. Line
106 sets the volume based on the y-coordinate of the mouse. By dividing
the current vertical mouse coordinate (
mouseY) by the stage height, we get a
percentage change. For example, if the mouse were in the middle of the stage,
the value would be 50 percent (0.5). This suits us just fine because the volume
setting should be between 0 and 1.
103 //transformations
104 var trans:SoundTransform = new SoundTransform();
105 function updateMouseTransform():void {
106 trans.volume = 1 - mouseY / stage.stageHeight;
107 trans.pan = mouseX / (stage.stageWidth / 2) - 1
108 channel.soundTransform = trans;
109 }
However, y-coordinates in ActionScript increase by moving down, and we
typically think of the values of a volume slider increasing as they go
up.
Therefore, we must subtract our percentage from 1 to get the correct value.
For example, let’s say the
mouseY is 100, and the stage is 400 pixels tall.
Dividing 100 by 400 gives us 25 percent, but the mouse is near the top of the
stage, which we think of as a higher volume when imagining a volume slider.
By subtracting 0.25 from 1, we end up with 0.75, or 75 percent, which is what
we want. Next, let’s look at calculating pan.
Line 107 affects the pan. This calculation is similar to the volume calculation,
but we need a value between –1 for full left and 1 for full right, and a value
in the center of the stage should equate to 0. To find the middle of the stage,
we need to divide the stage width by 2, and if we continually divide the hori-
zontal location of the mouse (
mouseX) by that value, we get a range of 0 to 2.
For example, using the default stage width of 550, the center would be 275. Far
left is 0/275 (0), center is 275/275 (1) and far right is 550/275 (2). Because, we
need a range of –1 to 1, we subtract 1 from the entire formula.
After calculating the volume and pan values based on the mouse position,
and altering the corresponding properties of the
trans transform object you
created (lines 106 and 107), all that remains is updating the
soundTransform
property of the desired channel (line 108).
Now all we have to do is amend the
onPlayProgress() function earlier in the
script, to update the transform. The function spans lines 60 through 64 and we
need to replace the earlier sound transformation placeholder comment with a
call to the
updateMouseTransform() function (shown in bold in the follow-
ing example). Now when you test your movie, you should be able to vary the
volume and pan of the playing sound by moving the mouse around the stage.
60 function onPlayProgress(evt:Event):void {
61 playBar.width = 100 * (channel.position / sndLength);
62 updateMouseTransform();
63 //future home of amplitude meter adjustment;
64 }
N O T E
Again, if you want to transform every
sound playing at a given moment, sim-
ply substituting
SoundMixer for the
specific channel in line 108 will accom-
plish the task.
Download from Wow! eBook <www.wowebook.com>
Reading ID3 Metadata from MP3 Sounds
Chapter 11: Sound
311
Reading ID3 Metadata from MP3 Sounds
When encoding MP3 files (compressing and saving the audio in the MP3 for-
mat), most sound applications can inject metadata into the file, storing this
data in tags established by the ID3 specification. The amount of metadata
included is decided during the encoding process, usually by whomever is
doing the encoding. The software itself, however, can add some information,
such as the name and/or version of the encoding software.
Accessing this information is accomplished via the
ID3Info class. The sim-
plest way to query a sound’s main ID3 tags is by using the named properties
of the
ID3Info instance found in every Sound object. This is found in every
sound’s
id3 property. For example, you can query the artist and song names
of an MP3 file this way (again assuming a
Sound instance called snd):
snd.id3.artist;
snd.id3.songName;
There are seven tags supported in this direct fashion, as seen in Table 11-1.
Table 11-1. The most common ID3 tags and their corresponding
ActionScript property names
ID3 2.0 tag ActionScript property
COMM
Sound.id3.comment
TALB
Sound.id3.album
TCON
Sound.id3.genre
TIT2
Sound.id3.songName
TPE1
Sound.id3.artist
TRCK
Sound.id3.track
TYER
Sound.id3.year
The remainder of the supported tags can be accessed through the same id3
property of the
Sound class, but using the tag’s four-character name. Table 11-2
shows supported tags that do not also have accompanying property names of
their own. Accessing the beats-per-minute data, for example, would require the
following syntax:
snd.id3.TBPM;
If you prefer a consistent approach, it’s also possible to access all ID3 tag
information using the four-character tag names, including the seven tags that
have their own dedicated property names. However, for quick access to the
most commonly used properties, you will likely find the descriptive names
to be more useful.
N O T E
Many audio applications can add ID3
tags to sounds, both during and after the
encoding process. Apple’s free iTunes can
tag and encode, and Pa-software’s share-
ware ID3 Editor can inject tags into
existing MP3s. Both are available for
the Macintosh and Windows platforms.
Download from Wow! eBook <www.wowebook.com>
Part IV: Sound and Video
312
Reading ID3 Metadata from MP3 Sounds
Table 11-2. Supported ID3 tags without dedicated ActionScript property names
ID3 2.0 tag Description
TBPM Beats per minute
TCOM Composer
TFLT File type
TIT1 Content group description
TIT3 Subtitle/description refinement
TKEY Initial key
TLAN Languages
TLEN Length
TMED Media type
TOAL Original album/movie/show title
TOFN Original filename
TOLY Original lyricists/text writers
TOPE Original artists/performers
TORY Original release year
TOWN File owner/licensee
TPE2 Band/orchestra/accompaniment
TPE3 Conductor/performer refinement
TPE4 Interpreted, remixed, or otherwise modified by
TPOS Disc/position in set
TPUB Publisher
TRDA Recording dates
TRSN Internet radio station name
TRSO Internet radio station owner
TSIZ Size
TSRC ISRC (international standard recording code)
TSSE Software/hardware and settings used for encoding
WXXX URL link frame
Finally, it’s possible to output all ID3 tags using a type of for loop. The fol-
lowing code, found in the player_id3.fla source file, continues our player
example by first creating a text field to display the data (lines 111 through
118). Lines 120 through 127 then add a listener to the sound instance to listen
for the
Event.ID3 event. Line 122 pulls the ID3 information from the event
argument.
The
for in loop in lines 123 through 126 is a little different than the for
loop discussed in Chapter 2. Instead of looping through a finite number of
times, it loops through all the properties of an object. It uses the property
Download from Wow! eBook <www.wowebook.com>
Visualizing Sound Data
Chapter 11: Sound
313
name as a key, and pulls the property value from the object using that string.
Lines 124 and 125 add each tag to the end of the field by concatenating a
string and ending it with a new line character to jump down to the next line.
110 //id3
111 var id3Field:TextField = new TextField();
112 id3Field.x = 140;
113 id3Field.y = 15;
114 id3Field.width = 340;
115 id3Field.height = 95;
116 id3Field.border = true;
117 id3Field.background = true;
118 addChild(id3Field);
119
120 snd.addEventListener(Event.ID3, onID3Info, false, 0, true);
121 function onID3Info(evt:Event):void {
122 var id3Properites:ID3Info = evt.target.id3;
123 for (var propertyName:String in id3Properites) {
124 id3Field.appendText("ID3 Tag " + propertyName + " = " +
125 id3Properites[propertyName] + "\n");
126 }
127 }
When ID3 information is detected and the listener function is triggered, an
ID3Info object is created to store the incoming data. The for in loop in
lines 123 through 126 walks through all the properties stored and, in this case,
adds them to a text field on stage. The data could also be displayed in a cus-
tom MP3 player interface, placed into a database to rank most often played
songs, and so on.
Visualizing Sound Data
Mastering any language depends heavily on motivating yourself to practice it.
This is especially true with programming languages, because code is difficult
to work into day-to-day conversation. Finding as little as 15 minutes a day
to experiment with ActionScript 3.0 will hasten your progress considerably,
however, and visualizing sound data will make that practice time fly by.
ActionScript 3.0 gives you access to raw sound data during playback, allowing
you to synchronize visuals to amplitude or frequency spectrum information.
Using the former, you might easily create peak meters, or animated speaker
illustrations, that bounce or throb to the beat. With spectrum data, on the
other hand, you can draw a waveform of the sound or depict the low-, mid-,
and high-range frequency bands of a sound much like an equalizer display.
Amplitude
The terms amplitude and volume are often used interchangeably, but under-
standing just a bit about these concepts can help clarify our task. Volume
is probably a familiar idea. It’s a measure of the loudness or intensity of
N O T E
In all cases, if a tag has not been
encoded into the MP3, querying the tag
directly will return
undefined as a
value.
Download from Wow! eBook <www.wowebook.com>
Part IV: Sound and Video
314
Visualizing Sound Data
a sound, and is somewhat subjective. Amplitude, on the other hand, is a
physics property that more directly applies to a sound wave. It measures the
distance of the peak of a sound wave from its baseline.
Because a waveform can contain positive and negative values, amplitude can
also be positive or negative, as a waveform’s peaks can be above and below its
baseline.
Peak amplitude is a specific measurement of amplitude, measuring
from one peak of a sound wave to the next. Because it’s measuring between
peaks, and not from a baseline, its value is always positive. In other words,
peak amplitude is the
absolute value, or nonnegative value, of amplitude,
and is the kind of amplitude information ActionScript 3.0 will deliver in this
example. Figure 11-3 shows both amplitudes in a hypothetical sound wave.
Getting the amplitude of a sound channel requires only that you read its
leftPeak and/or rightPeak properties depending on which stereo channel
you want to visualize. These properties will be equal when mono sounds are
playing. Assuming a
SoundChannel instance called channel, the syntax is:
channel.leftPeak;
channel.rightPeak;
These properties will return a value between 0 and 1 to represent the current
amplitude. Conveniently, this is also the range of values used by such prop-
erties as
alpha, scaleX, and scaleY. Therefore, to create a basic amplitude
meter, you need only manipulate the height of a movie clip. Imagine two
movie clips that look like vertical bars 100 pixels high, with instance names
leftMeter and rightMeter. Because the leftPeak or rightPeak values are
always a fraction of 1, multiplying the full size of the meters by these values
will cause the meter to vary between a height of 0 (at minimum volume) and
100 (at full volume). A
leftPeak value of 0.5 will set the left meter to half-
height, or 50 pixels. The following snippet shows this process in code. We’ll
also use this same technique in our sound player project in just a moment.
leftMeter.height = 100 * channel.leftPeak;
rightMeter.height = 100 * channel.rightPeak;
If you wanted something slightly less conventional, you might manipulate
the scale of a graphic, rather than the height of a bar, with the amplitude
values. For example, you could create a picture of a speaker that increased in
size based on the amplitude values. Unlike a peak meter, however, you don’t
want the speaker icons to disappear at 0 volume—a possible byproduct of
setting the scale of the graphic to a dynamic value between 0 and 1, inclusive.
Therefore, you can
add the amplitude value to the graphic’s original scale of
1 (100 percent, or full size). The speakers, therefore, will remain unchanged
during silence and potentially grow to twice their size at 100 percent ampli-
tude—that is, a scale of 1 + 1, or 2. This approach is shown in the following
code snippet, and a complete implementation of the code is found in the
speakers_peak.fla source file.
leftSpeaker.scaleX = leftSpeaker.scaleY = 1 + channel.leftPeak;
rightSpeaker.scaleX = rightSpeaker.scaleY = 1 + channel.rightPeak;
N O T E
A simple way to distinguish ampli-
tude and volume is to remember that
amplitude will likely change over time
even while a sound plays at a fixed
volume. Think about a basic bass drum
rhythm playing at full volume. As the
beats progress, the peak amplitude will
vary between 0 (no sound) and 1 (full
amplitude). The peak amplitude of a
bass drum kick might shoot up to 1 and
then decay quickly back to 0, over and
over again, but the volume remains
constant. If you visualized this change
in amplitude during playback, you’d
end up with what are often called
peak
meters—meters that repeatedly display
the maximum current amplitude. If you
visualized full volume, you’d see a very
boring straight line at 1.
amplitude
amplitude
peak
amplitude
Figure 11-3. Amplitude and peak
amplitude of a sound wave
N O T E
Remember that sound channels are akin
to recording tracks, allowing multiple
sound sources to be manipulated dis-
cretely, and that stereo channels deliver
only left and right separation of a spe-
cific sound. A sound channel can contain
mono or stereo sounds. Mono sounds
will contain the same information in
both channels.
Download from Wow! eBook <www.wowebook.com>
Visualizing Sound Data
Chapter 11: Sound
315
Adding peak meters to the sound player
Let’s add a pair of peak meters to the sound player project we’ve been devel-
oping. The following code is found in
player_peak.fla.
Lines 129 through 139 create two sprites using the
drawBar() method dis-
cussed earlier—with one important difference. The bars are rotated –90
degrees so that they will expand upward, instead of to the right. Lines 141
through 144 update the
scaleX of each peak meter. Note that we’re updating
scaleX, even though it will look like the height of the meters is changing due
to the rotation in lines 130 and 136. Figure 11-4 illustrates this idea.
128 //peak meters
129 var lPeak:Sprite = drawBar(0x009900);
130 lPeak.rotation = -90;
131 lPeak.x = 500;
132 lPeak.y = 110;
133 addChild(lPeak);
134
135 var rPeak:Sprite = drawBar(0x009900);
136 rPeak.rotation = -90;
137 rPeak.x = 520;
138 rPeak.y = 110;
139 addChild(rPeak);
140
141 function updatePeakMeters():void {
142 lPeak.scaleX = channel.leftPeak * 100;
143 rPeak.scaleX = channel.rightPeak * 100;
144 }
As with the updateMouseTransform() function call in the “Changing Sound
Volume and Pan” section, we must now update our peak meters in the
onPlayProgress() function found earlier in the script. We’ll again replace
a function placeholder comment, this time the amplitude meter adjustment
comment found in line 63 with a call to the
updatePeakMeters() function.
60 function onPlayProgress(evt:Event):void {
61 playBar.width = 100 * (channel.position / sndLength);
62 updateMouseTransform();
63 updatePeakMeters();
64 }
Now when you test your file, you should see two peak meters in the upper-
right corner of the stage, moving in sync with the music and visualizing the
peak amplitude of the sound during playback. You may also notice that this
visual feedback reflects the sound transformations made with your mouse.
If, for example, you move the mouse to the upper-left corner of the stage,
you will see larger peaks in the left meter. If you move your mouse across the
top of the stage, you will see the peaks move from the left meter to the right
meter to correspond with the panning of the sound. Finally, if you then move
your mouse down the right side of the stage, you will see the peaks steadily
diminish in size as the amplitudes of the sound diminish.
adjusting width
adjusting width
adjusting width
Figure 11-4. Adjusting the width of a
sprite rotated –90 degrees appears to
affect the height of the sprite
Download from Wow! eBook <www.wowebook.com>
Part IV: Sound and Video
316
Visualizing Sound Data
Creating More Expressive Peak Meters
Using Masks
Just for fun, we’re going to show you a slightly more expressive peak meter, based on a
meter that you might see on a home stereo. In case you’ve never seen a peak meter
before, it’s usually a series of 6 to 10 consecutive lights, stacked vertically or placed end to
end, which glow in sequence depending on the amplitude of the sound. Typically, low
amplitudes reveal cool colors (green or blue) for acceptable amplitudes. Additional lights
reveal warm colors (yellow or amber) as amplitudes increase to possible distortion levels.
Finally, hot colors (red) are revealed when the amplitude exceeds acceptable levels. A
representation of this type of meter is shown in the top illustration of Figure 11-5.
Because of the color changes, we can’t simply adjust the
width
,
height
,
scaleX
, or
scaleY
properties of the meter. If we did that, we would invalidate the purpose of the
color bands because all the colors would be visible all the time, even at low amplitudes.
This can be seen in the bottom left illustration of Figure 11-5. We need, instead, to show
only those colors representative of the amplitude, be they cool or hot, as seen in the
bottom-right illustration of Figure 11-5.
You can reveal only specific colors by creating a mask for the color bars, and scaling only
the mask. The entire peak meter is a movie clip, within which are two discrete elements:
the color bands and another movie clip used as a mask. (In our file, a third element
serves as an outline but is not affected by ActionScript.) Because a mask dictates which
part of the content is seen (rather than hiding that content), altering the size of the mask
will reveal the desired portion of the color bars, as seen in Figure 11-6.
The following code is included in multicolor_peak_meters.fla, which contains two
instances of a movie clip that serves as our meter. The instances are called lPeak and
rPeak, and the symbol contains the outline, mask, and color bars seen in Figure 11-6. The
mask has an instance name of barMask.
The first five lines cover the basic sound loading and playing tasks discussed earlier in
the chapter. The code inside the listener function sets the vertical scale of the mask
inside each meter to match the peak amplitudes of the left and right channels.
var snd:Sound = new Sound();
snd.load(new URLRequest("song.mp3"));
var channel:SoundChannel = new SoundChannel();
channel = snd.play();
addEventListener(Event.ENTER_FRAME, onLoop,
false, 0, true);
function onLoop(evt:Event):void {
lPeak.barMask.scaleY = channel.leftPeak;
rPeak.barMask.scaleY = channel.rightPeak;
}
Unlike the speaker example discussed earlier, we do want the colors in the peak meter
to disappear during silent passages, so we can set the
scaleY
property directly to the
values generated by the
leftPeak
and
rightPeak
properties.
Though this example uses assets found in the library of an FLA, the learningactionscript3
package contains the
PeakMeter
class for creating multicolor peak meters entirely from
code. The PeakMeter_Example.as document class, and the corresponding PeakMeter_
Example.fla file for Flash Professional users, demonstrate how to use the class.
Figure 11-5. The color peak meter in use
Figure 11-6. The component parts of the
color peak meter
Download from Wow! eBook <www.wowebook.com>
Visualizing Sound Data
Chapter 11: Sound
317
Sound Spectrum Data
So far, we’ve been able to synchronize visuals with sound data by using
the values returned by the
leftPeak and rightPeak properties of the
SoundChannel instance. With this information, we’ve already created peak
meters to visualize the amplitude of a sound during playback—but there’s
a lot more you can do. We discussed scaling a speaker, and you can just as
easily change the
alpha, x, y, or rotation properties of a display object.
The
peak_visualizations directory in the accompanying source code includes
examples of each of these tasks.
Even with a lot of creativity behind your efforts, however, you still only
have two simultaneous values to work with when using peak amplitudes.
Fortunately, ActionScript 3.0 provides another way to visualize sound by
giving you access to
spectrum data during playback. Audio spectrum data
typically contains a mixture of frequency and amplitude information and
can give you a visual snapshot of a sound at any moment. You can use this
information to draw a sound wave or you can preprocess the information to
look at amplitudes in the low, mid, and high frequency ranges—much like
the visual feedback a home-stereo equalizer can give you.
We’ll support both kinds of data, and we’ll do so in a class so that it’s easy
to add waveform visualization to your own projects. Figure 11-7 shows an
example of what our class can draw. It depicts the left stereo channel wave-
form in green and the right stereo channel waveform in red.
Storing and retrieving sound spectrum data
Before we discuss the new class, let’s talk a little bit about how much data
we’ll be using and how we’ll handle the load. Each time we retrieve the sound
spectrum data, we’re going to do so using the
computeSpectrum() method of
the
SoundMixer class. This method retrieves data from the sound in real time
and places that data into a special kind of array called the
ByteArray, which
we’ll explain in a moment. Every time the method is called, we’ll be using 512
data values from the sound—256 for the left channel and 256 for the right
channel—to draw our waveform.
We’re going to use an enter frame event listener to call the method so, assuming
the default Flash Professional frame rate of 24 frames per second, that means
we’ll be using 12,288 values per second. What’s more, the
computeSpectrum()
method returns
bytes, which are very small units of data. We need to work with
decimal values like 0.5, which are also called
floating-point numbers or floats.
It takes 4 bytes to make a single float, and we need 12,288 floats per second.
Therefore, our file will need to process 49,152 bytes per second!
You don’t need to worry about any of this math, because you’ll soon see that
it’s all handled for you. But it does help to understand the magnitude of what
we’re going to be doing. Working your way through nearly 50,000 values per
second isn’t trivial, so this is a potential performance issue.
Figure 11-7. A visualization of left and
right channel waveforms
Download from Wow! eBook <www.wowebook.com>
Part IV: Sound and Video
318
Visualizing Sound Data
Storing the data and retrieving it quickly are challlenges handled by the
ByteArray class. A byte array is an optimized array that can be used to store
any kind of bytes. For example, we used the
ByteArray as part of the process
that saved an image in Chapter 9. It can also be used to read external file data,
like the ZaaIL library mentioned in the same chapter, that reads unsupported
image formats. In this case, we’re going to use a
ByteArray instance to store
sound data.
The
ByteArray class has special methods that make retrieving data fast and
efficient. These methods will process a series of bytes and turn them into
the data format you need, so you don’t have to. For instance, we need float
values, rather than bytes. The
readFloat() method will read four sequential
bytes, translate them into a float, and return the data we need. What’s more,
the method will automatically increment through the bytes so that you don’t
have to update a loop counter when parsing the contents of the array.
For example, think of an array called
myByteArray that contains 12 bytes. If
this data were stored in a normal array, you’d likely work through it using
a
for loop, and you’d have to increment the loop counter after each query.
Using a byte array, however, the first time you execute
myArray.readFloat(),
it will read the first four bytes, return a float, and remain poised at byte 5 to
continue parsing the array. With the next call of
myArray.readFloat(), bytes
5 though 8 will be returned as a float—again with no manual incrementing
of the array—and you’re now at byte 9 ready to continue.
The
computeSpectrum() method will populate our ByteArray for us, and
the
readFloat() method will automatically translate the bytes into the data
format we need, so we’re ready to go. However, a second, optional parameter
of the
computeSpectrum() method will allow us to choose between two ways
to analyze our sound.
Drawing a waveform or frequency spectrum
By default, the computeSpectrum() method will fill a byte array with values
that will translate to floats between –1 and 1. These values will plot a waveform
as it ascends above or descends below its baseline, as shown in Figure 11-7.
However, a second, optional parameter called
FFTMode will return the ampli-
tude of individual frequencies, with values between 0 and 1. An FFT plot
distributes positive amplitudes of different frequencies across the baseline,
much like the visual feedback a home-stereo equalizer can give you. Low
frequencies of each channel appear on the left, and high frequencies appear
on the right, as seen in Figure 11-8.
As previously described, our example exercise will draw a waveform.
However, after you’ve successfully tested your code, experiment with setting
the second parameter of the
computeSpectrum() method to true to plot FFT
frequency amplitudes.
N O T E
FFT refers to “Fast Fourier Transform,”
a method for efficiently computing the
component frequencies that make up a
signal like a sound or light wave.
Figure 11-8. Visualizing frequency values
with an FFT display
Download from Wow! eBook <www.wowebook.com>