LAND COVER CHANGES BETWEEN 1968 AND 2003 IN CAI NUOC, CA MAU PENINSULA, VIETNAM docx
Bạn đang xem bản rút gọn của tài liệu. Xem và tải ngay bản đầy đủ của tài liệu tại đây (359.63 KB, 18 trang )
LAND COVER CHANGES BETWEEN 1968 AND 2003 IN CAI NUOC,
CA MAU PENINSULA, VIETNAM
T.N.K.D. BINH
1,
*, NICO VROMANT
2
, NGUYEN THANH HUNG
1
,
LUC HENS
3
and E.K BOON
3
1
National Centre for Natural Science and Technology, Department of Geography Information System and
Remote Sensing, 1 Mac Dinh Chi, District 1, Ho Chi Minh, Vietnam;
2
Katholieke Universiteit Leuven,
Laboratory of Aquatic Ecology, Charles de Be
´
riotstraat 32, B-3000 Leuven, Belgium;
3
Vrije Universiteit
Brussel, Human Ecology Department, Laarbeeklaan 103, B-1090 Brussels, Belgium
(*author for correspondence, e-mail: pvpialy@hcm,vnn.vn; fax: +84-8-8299618;
tel.: +84-8-8299618)
(Received 19 January 2004; accepted 5 November 2004)
Abstract. Since 2000, the shrimp industry expands at a fast rate in the coastal areas of the Mekong
Delta, Vietnam. Shrimp farming is known for its negative impact on the coastal environment. However,
other human interventions like agriculture and urbanization also deteriorate the coastal environment.
The land cover changes between 1968 and 2003 were determined and analyzed for the Cai Nuoc dis-
trict, Ca Mau Province, Vietnam, using photos from 1968, 1992 (aerial photographs), 1997/98 (Spot)
and 2003 (Landsat). It was clear that the district underwent serious land cover changes: deforestation
between 1968 and 1992, with a simultaneous increase in rice land; a rapid decline in rice acreage from
1997 onwards, and, simultaneously, a blitz-increase in shrimp farming area. The forest area declined by
75% between 1968 and 2003. About 40% of this loss could be attributed to shrimp farming, while the
remaining 60% was attributed to needs for agricultural land. Still, at present, shrimp farming is the
major source of mangrove loss in the district. In 1999 shrimp farms covered 6.374 ha, in 2000 they cov-
ered 61.049 ha of the Cai Nuoc area. The swap from rice cultivation to shrimp farming was most-prob-
ably driven by households’ hopes for a higher income. It must be feared that the shrimp industry will
have a negative impact on the environment (e.g. salinization) and on the livelihood of the district’s
households. In 1968 saline water covered 219.9 km
2
, in 1992, 1997/98 and 2003 the saline surface water
area covered 92.4, 135.2 and 835.0 km
2
, respectively.
Key words: mangrove, land cover change, remote sensing, shrimp, Vietnam.
1. Introduction
About 100 years ago Vietnamese farmers started extensive shrimp farming
(Nhuong et al., 2002). Since the 1980s at the start of the Doi Moi economic
liberalization policy, modern intensive monoculture shrimp farming gradu-
ally replaced the extensive farming systems as the Vietnamese Government
explicitly encouraged the development of the shrimp farming industry
Environment, Development and Sustainability (2005) 7: 519–536 Ó Springer 2005
DOI 10.1007/s10668-004-6001-z
Readers should send their comments on this paper to: within 3 months of
publication of this issue.
(Nhuong et al., 2002). Indeed, the Vietnamese ‘‘National Master Plan’’ for
aquaculture demands for an area expansion and intensification of shrimp
aquaculture (Nhuong et al., 2002). Since 2000, when the government issued
the resolution 09/NQ-CP allowing farmers to transform coastal saline rice
fields into shrimp farms, the shrimp sector expanded at a fast rate
(Nhuong et al., 2002): in 2001, 478,000 ha were used for shrimp farming in
Vietnam, an increase by 42.6% as compared to the year 2000 (Mofi, 2002).
In the same year the area used for shrimp farming in Ca Mau was 202,00
ha, or 42.25% of the total shrimp area in Viet Nam (RIA2, 2003).
Worldwide, the shrimp industry is often blamed for its negative impact
on the environment (pollution, disease outbreaks, salt water intrusion), and
more specifically on the mangrove forests (Wolanski et al., 2000; Dahdouh-
Guebas et al., 2002; EJF, 2003b). But not only aquaculture can be blamed
for mangrove loss, as other human interventions like agriculture, urbaniza-
tion, and even forestry and warfare have been blamed for recent losses of
mangrove habitat (Fortes, 1988; Marshall, 1994). Indeed, anthropogenic
processes exert enormous pressure on tropical environments (Validea et al.,
2001). In the Mekong Delta, the coastal complex used to be covered by
natural vegetation, but, after the Vietnam war, land reclamation for rice
cropping and shrimp culture began (Tanaka, 1995). As a result the coastal
area is considered to be the region that has experienced the greatest
changes in land use in the last few decades in the Mekong Delta (Tanaka,
1995). In this paper these changes are investigated. Besides that, the paper
tries to determine the impact of shrimp farming on land cover in the Ca
Mau Peninsula, in general, and on mangrove forests, in particular. The
land cover changes between 1968 and 2003 were determined and analyzed
for the Cai Nuoc district, Ca Mau Province, Mekong Delta, Vietnam. Pho-
tos from 1968, 1992, 1997/98 and 2003 were used to analyze the changes.
2. Material and methods
2.1. Area Description
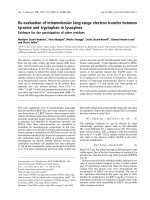
The 835 km
2
Cai Nuoc district (Figure 1) is situated in the South-West of
Ca Mau province, Mekong Delta, Vietnam. Its geographic coordinates are
8°06¢30¢¢ to 9°08¢00¢¢ latitude and 104°47¢00¢¢ to 105°09¢15¢¢ longitude. The
average annual rainfall ranges from 2000 to 2400 mm (Sub-Institute of
Geography at Ho Chi Minh City, 2001). The area has two main seasons:
(i) the wet season (from May to October) gets on average more than
2100 mm of rainfall, making up 90% of the total annual rainfall, and (ii)
the dry season (from September to April) receives on average 200 mm of
rainfall. The average daily temperature ranges from 26.5 to 27.3 °C. The
minimum daily temperature is always above 15 °C. The relative humidity
520 BINH ET AL.
varies between 87.0 and 89.4% during the wet season, and between 80.4
and 85.5% during the dry season (Sub-Institute of Geography at Ho Chi
Minh City, 2001). The number of hours of sunshine ranges from 4.7 to
5.0 h day
)1
during the rainy season and 7.4 to 8.1 h day
)1
during the dry
season (Sub-Institute of Geography at Ho Chi Minh City, 2001).
The Cai Nuoc area is a lowland delta plain with an average elevation of
0.2 m. The area has three soil groups: (i) fluvisols (alluvial land) cover
44234.04 ha (54.0%), (ii) thionic fluvisols (acid sulphate soils) cover
33309.20 ha (40.69%) and (iii) salic fluvisols (alkaline soils) cover 4318.78 ha
(5.28%) (Sub-Institute of Geography at Ho Chi Minh City, 2001). The
water flow regime in the study area is complicated as it is affected by the
Gulf of Thailand and the East sea (Sub-Institute of Geography at Ho Chi
Minh City, 2001). The district is affected by salinity for over 6 months
(Brennan et al., 2002).
2.2. Data Sources and Treatment
Three kinds of data sources were used to setup the Cai Nuoc land cover
maps for the years 1968, 1992, 1997/98 and 2003: (1) a common topo-
graphic base map, (2) aerial photographs of the year 1968 and 1992, and
(3) satellite images for the years 1997/98 and 2003.
The topographic base map (prepared under the direction of the Depart-
ment of Defense and published by the U.S. Army Topographic Command,
Washington D.C) has the following specifications: scale 1/50.000, spheroid
Everest, grid 1000 m UTM zone 48, vertical datum mean sea level at Ha
Figure 1. Map of the Study Area: Cai Nuoc district, Ca Mau Province, Mekong Delta, Vietnam.
521LAND COVER CHANGES IN CAI NUOC
Tien, and horizontal datum Indian Datum 1960. The map was compiled on
3 December 1969 (3rd edition). The map sheets was digitized and geo-refer-
enced utilizing Drawing board III.
For the 1968 land cover map, 58 aerial photographs (scale 1/25.000)
were used. For the 1992 land cover map, 154 pictures (scale 1/22.000) were
used. For both sets of photographs the horizontal covering was 60% while
the vertical covering was 30%. The 1968 photos were made by the U.S
army, while the 1992 photos were obtained from the Vietnamese Ministry
of Defense. Stereoscopy was used to analyze the aerial photos. Once the
different land cover categories were defined, the aerial photos were used to
draw the contours of the land cover pattern on the base map. A Cal comp
digitizer (Drawing board III) using AutoCAD R12 software was used to
digitize the map.
The 1997/98 land cover map was derived from two Spot 4 images. The
2003 land cover map is based on two Landsat 7 ETM+ images. The satel-
lite images were interpreted using the ENVI software package (Research
Systems Inc.). Pre-processing of the images included geometric correction
and image enhancing. The images were analyzed with the Normalized Dif-
ference Vegetation Index (NDVI) and the Principal Component Analysis
(PCA). The NDVI was used to find out the vegetation distribution. PCA
was used to produce uncorrelated output bands, to sort out noise compo-
nents, and to reduce the dimensionality of the data set (Richards, 1994).
Plotting the NVDI output versus the PCA corrected pixels of band 3
allowed discrimination between several kinds of land cover. First, an unsu-
pervised classification (to recoginize the general type of land use or land
cover) was obtained with the Isodata clustering algorithm (Tou and Gonz-
alez, 1974). Second, the maximum likelihood method was used to obtain a
supervised classification (Richards, 1994). With the Kappa coefficient
method (McMorrow, 2002), the accuracy of the land cover classification
was accessed as 99.5% for the Spot image and 98.7 for the Landsat image.
The land cover map was printed and regions with uncertain classification
were marked for a ground truth check. Following the ground truth check,
the data were transformed to a vector format.
3. Results
3.1. Land Cover Categories
The study of the maps enabled us to identify 15 land cover categories:
1. Rice monocropping, 1 crop per year: Farmers use traditional rice varie-
ties with a growth period of 180–210 days. The rice crop is grown from
May to December-January. This cropping system is practiced on both
522 BINH ET AL.
acid sulphate and alkaline soils. Rice is transplanted. The cropping sys-
tem is characterized by a low input (Sanh et al., 1998).
2. Rice monocropping, 2 rice crops per year: Farmers use short duration
(95–110 days) high yielding rice varieties: the first rice crop is grown
from May/June to August/September; the second rice crop is grown
from September/October to November/December. Some farmers opt
for a short duration crop followed by a long duration crop. In this case
the short-duration rice is grown from April to the middle of July and
the long duration crop from the end of July to the middle of January.
Farm inputs are high and typically include fertilizers and pesticides
(Sanh et al., 1998).
3. Rice cropping followed by vegetable cropping: The rice crop is grown
from May to December/January and the vegetable crop (e.g. sweet
potato, spinach, onions) is grown from February to April.
4. Vegetable farming: Farmers grow several short-duration crops such as
watercress, ladyfingers, onions, shallots and chilli.
5. Settlement and gardens: residential houses with adjoining fruit gardens
(coconut, banana tree or other kinds of fruit).
6. Village: residential houses without gardens.
7. Village and vegetables: residential houses with adjoining gardens used
for horticulture activities.
8. Nypa palm: Nypa fructicans is a mangrove species of the Old World. In
Ca Mau, Nypa is typically found along canals and creeks.
9. Cypress forests are dominated by Cypress trees.
10. Rhizophora forest: forest dominated by Rhizophora spp.
11. Mangrove forests are dominated by a mixture of mangrove trees like
Rhizophora spp., Sonneratia sp. and Avicennia sp.
12. Avicennia forests are dominated by Avicennia species.
13. Wasteland: is land that cannot be exploited for agricultural production
due to high salinity.
14. Mangrove–shrimp farming systems: farmers grow mangrove and
shrimp (Penaeus monodon Fabricius) simultaneously. The area dedi-
cated to mangrove is good for 50 to 70% of the total surface covered
by the system. The remaining area is used for shrimp farming.
15. Shrimp monoculture: farmers grow shrimp (Penaeus monodon Fabri-
cius) in ponds.
To enhance the reading of the land cover maps, these 15 categories were
regrouped into 6 major land cover groups: agriculture, rural settlement,
wasteland, forest, mixed mangrove–shrimp farming systems and shrimp
monoculture (Table I).
523LAND COVER CHANGES IN CAI NUOC
TABLE I. For the period 1968 and 2003, 15 different land cover categories were identified for the Cai Nuoc district. The total area (ha) and the land cover
percentages fluctuated quite considerable.
No. Major land
cover group
Land cover
1968 1992
Change as
compared
to 1968 (%)
1997
Change as
compared
to 1968 (%)
Change as
compared
to 1992 (%)
2003
Change as
compared
to 1968 (%)
Change as
compared
to 1992 (%)
Change as
compared
to 1997 (%)
Area (ha) % Area (ha) % Area (ha) %
Area (ha)
%
1
Agriculture Rice 1
crop/year
43,554.72 54.16 35,000.94 43.07 )19.64 21,423.50 26.08 )50.81 )38.79 )100.00 )100.00 )100.00
2 Agriculture Rice 2
crop/year
0.00 0.00 0.00 28,415.10 34.59 100.00 100.00 0.00 0.00 )100.00
3 Agriculture Rice +
vegetable
6166.96 7.67 14,637.47 18.01 134.91 0.00 )100.00 )100.00 )100.00 )100.00 0.00
4 Agriculture Vegetable 1605.97 2.00 411.49 0.51 )74.38 0.00 )100.00 )100.00 )100.00 )100.00 0.00
5 Rural
settlement
Settlement/
gardens
6676.47 8.30 19,309.38 23.76 189.22 16,676.26 20.30 149.78 )13.64 15,352.16 18.69 129.94 )20.49 )7.94
6 Rural
settlement
Village 7.99 0.01 99.36 0.12 1143.66 169.61 0.21 2022.98 70.70 302.99 0.37 3692.27 204.93 78.64
7 Rural
settlement
Village-
Vegetable
0.00 993.96 1.22 100.00 0.00 0.00 )100.00
8 Forest Nypa palm 1441.49 1.79 1002.87 1.23 )30.43 935.86 1.14 )35.08 )6.68 508.41 0.62 )64.73 ) 49.30 )45.68
9 Forest cypress 286.21 0.36 0.00 )100.00 0.00 )100.00 0.00 0.00 )100.00 0.00 0.00
10 Forest Rhizophora
forest
5641.36 7.01 0.00 )100.00 0.00 )100.00 0.00 0.00 )100.00 0.00 0.00
11 Forest Mangrove
forest
11,651.94 14.49 1332.93 1.64 )88.56 833.61 1.01 )
99.91 )37.46 1191.00 1.45 )89.78 )10.65 42.87
12 Forest Avicennia_sp 486.92 0.61 0.00 )100.00 0.00 )100.00 0.00 0.00 )100.00 0.00 0.00
13 Wasteland Wasteland 2900.33 3.61 397.80 0.49 )86.28 1014.52 1.24 )65.02 155.03 0.00 )100.00 )100.00 )100.00
14 Mixed
mangrove–
shrimp
farming
systems
Mangrove–
Shrimp
0.00 8069.93 9.93 100.00 7639.52 9.30 100.00 )5.33 5103.23 6.21 100.00 )36.76 )33.20
15 Shrimp
monoculture
Shrimp
farming
0.00 340.84 0.42 100.00 5034.12 6.13 100.00 1376.99 59,684.31 72.66 100.00 16,511.14 1085.60
Total 80,420.36 100.00 81,256.13 100.00 82,142.09 100.00 82,142.09 100.00
524 BINH ET AL.
3.2. The 1968 Land Cover Map
The 1968 picture revealed 11 land cover categories (Table I) further
grouped into 4 major categories (Figure 2). Rice monocropping with 1
rice crop per year covered more than half of the total land area. The
rice monocropping area was situated in the Eastern part of the district,
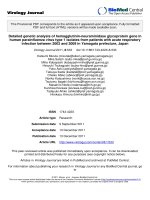
Figure 2. The Cai Nuoc land cover maps for the years 1968, 1992, 1997 and 2003. The maps show the
seven major land cover groups: (1) Agriculture including: 1 rice crop per year, 2 rice crops per year, 1 rice
crop and 1 vegetable crop per year, and vegetable farming; (2) Rural settlement including: village fruit
gardens, village, village mixed vegetable gardening; (3) Forest including: Nypa palm, cypress, Rhizophora
forest, mangrove forest and Avicennia sp., (4) wasteland; (5) mixed mangrove–shrimp farming systems; (6)
monoculture shrimp farming; and (7) water bodies such as canals and rivers.
525LAND COVER CHANGES IN CAI NUOC
away from the sea. The Western and Southern part of the district is
covered by forest (19,509.74 ha or nearly 25% of the total area). Settle-
ments and garden were mainly situated along thecanals. Mangrove–
shrimp farming systems and shrimp monoculture were non-existent.
3.3. The 1992 Land Cover Map
The 1992 picture revealed 11 land cover categories (Table I) further
grouped into 6 major categories (Figure 2). The major land cover was the
rice monocropping system with 1 rice crop per year, mainly situated in the
North-eastern part of the district. Two other important farming systems
are the settlement–garden system and the rice–vegetable system, good for
respectively 23.76 and 18.01% of the total area. A strip of mangrove forest
borders the coastal area. Mixed mangrove–shrimp farming systems are
good for nearly 10% of the total land cover, mainly situated in the Wes-
tern and Southern part of the district. Intensive shrimp monoculture is
marginal. Settlements and gardens were aligned along the rivers, canals
and main roads.
3.4. The 1997/98 Land Cover Map
The 1997/98 picture revealed 9 land cover categories (Table I) further
grouped into 6 major categories (Figure 2). Rice monoculture systems with
two rice crops per year (mainly found in the North-eastern part of the Cai
Nuoc district) formed the main land use system, followed by price mono-
culture systems with one rice crop per year. Together, both systems are
good for slightly more than 60% of the total land area. A small strip of
mangrove forest bordered the coast line. Behind this forest an area of
7639 ha of mangrove–shrimp farming systems can be found. Along the
Southern and Eastern part of the district borders shrimp monoculture sys-
tems developed. Both shrimp systems together are good for 15.43% of the
Cai Nuoc land. Settlement and gardens followed the canals and main
roads.
3.5. The 2003 Land Cover Map
The 2003 picture revealed 6 land cover categories (Table I) further grouped
into 4 major categories (Figure 2). Shrimp monoculture systems (mainly
situated in the North-eastern part of Cai Nuoc district) are good for
72.66% of the total land cover area. Along the coastlines, the up to 300-m
wide mangrove forest can be found, immediately followed by mangrove–
shrimp farming systems. People live in small villages or along canals or
roads.
526 BINH ET AL.
3.6. Land Cover Changes
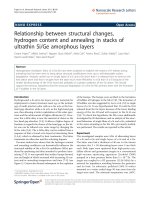
From 1968 to 2003, the Cai Nuoc district underwent serious changes in
land cover (Table I). While agricultural (rice)-based farming systems cov-
ered more than 50,000 ha in 1968, they had completely disappeared by the
year 2003. Shrimp-based farming systems were non-existent in 1968, but
dominant in 2003 (Figure 3). In the same period the forest area declined
drastically (Figure 3 and Table I). The ratio ‘‘forested area/total/land
cover’’ declined from 0.243 in 1968, to 0.109, 0.099 and 0.069 in 1992,
1997/98 and 2003, respectively (Table I). Accounting for the fact that
mixed mangrove–shrimp systems have an area of 50 to 70% mangrove, the
total forested area drops from 24.26% in 1968 to 5.18–6.42% in 2003
(Table II), a decrease by about 75%. Between 1968 and 1992, the forest-
type diversity was seriously reduced: While there were 5 kinds of forests in
1968 (Nypa palm, Cypress forest, Rhizophora forest, mangrove forest and
Avicennia forest) only two remained in 1992 (Nypa and mangrove forest).
Table III, which uses the data from Table II as input, shows that the
biggest loss in mangrove area occurred between 1968 and 1992, when an
estimated 63.2% of the original mangrove area was lost. While the area
lost between 1997/98 and 2003 was relatively small, a sharp increase in per-
centage loss in mangrove area (4.18%) was noted.
The total land area of the Cai Nuoc district increased from 80,420 to
82,142 ha between 1968 and 2003. New land is covered by mangrove.
Between 1968 and 2003, the area occupied by villages increased from 7.99
to 302.99 ha.
Figure 3. Changes in land cover of the major land cover groups between 1968 and 2003, Cai Nuoc district,
Ca Mau province, Vietnam.
527LAND COVER CHANGES IN CAI NUOC
4. Discussion
The Cai Nuoc district is a fast developing area. In the period under study,
the changes in land cover could be summarized as follows: (1) deforesta-
tion between 1968 and 1992, with a simultaneous (2) increase in rice land,
(3) a rapid decline in rice acreage from 1997 onwards, and, simultaneously,
a (4) blitz-increase in shrimp farming area.
TABLE II. The total forested areas in the Cai Nuoc area consists of two fractions: (1) Pure forest
stands, and (2) Mixed mangrove–shrimp systems. In these systems mangrove makes up 50–70% of the
land area. The table tabulates the total forested area for minimum and maximum possible area in for-
est. The real value lies probably somewhere in between.
1968 1992 1997 2003
Area (ha) % Area (ha) % Area (ha) % Area (ha) %
Forest area
(pure stands)
19,507 24.26 2335.80 2.87 1769.47 2.15 1699.41 2.07
Mixed shrimp–
mangrove area
0.00 0.00 8069.93 9.93 7639.52 9.30 5103.23 6.21
Of which 70%
forested
0.00 0.00 5648.95 6.95 5347.66 6.51 3572.26 4.35
Of which 50%
forested
0.00 0.00 4034.96 4.97 3819.76 4.65 2551.62 3.11
Total forested
area
Pure stand
+ 70% shrimp–
mangrove
19,507.92 24.26 7984.75 9.82 7117.13 8.66 5271.67 6.42
Pure stand
+ 50% shrimp-
mangrove
19,507.92 24.26 6370.76 7.84 5589.23 6.80 4251.02 5.18
Total forested
area (average values)
19,507.92 24.26 7177.25 8.83 6353.18 7.73 4761.34 5.80
TABLE III. Area of mangrove forest (ha), percentage loss (%), annual rate of loss (ha y
)1
) and per-
centage of original area lost per year in Cai Nuoc district, Ca Mau province, Vietnam, for the periods
1968–1992, 1992–1997/98, 1997/98–2003 and the overall period 1968–2003. The average forest area data
from Table II were used as input for this table.
Considered
period
Mangrove area
at onset of
period (ha)
Mangrove area
at end of
period (ha)
Percentage loss
between onset
and end of
considered
period
Annual rate
of loss (ha yr
)1
)
Percentage of
area lost per
year in th
considered
period
1968–2003 19,507.92 4761.34 75.6 421.3 2.16
1968–1992 19,507.92 7177.75 63.2 2.63 2.63
1992–1997/98 7177.75 6353.18 11.5 2.30 2.30
1997/98–2003 6353.18 4761.34 25.1 265.3 4.18
528 BINH ET AL.
4.1. Population and Settlement
The population in the Cai Nuoc district increased from 223,018 inhabitants
in 1992, over 245,198 inhabitants in 1995 to 250,324 inhabitants in 2003
(Ca Mau Statistical Office, 1992, 1995, 2002). There are no figures available
for 1968. The increase in population is mainly attributed to immigration
from other provinces in Vietnam (Ca Mau Statistical Office, 1992, 2002)
and occurred mainly in the years 1976–1981 (Sanh et al., 1998). Immigra-
tion was both spontaneous and planned. Spontaneous settlements occurred
along new canals and roads, while planned immigration was organized by
the government, which provided settlers with basic infrastructure (Sanh
et al., 1998). All new settlers claimed or obtained a piece of land to con-
struct a house, to plant some fruit trees and to grow rice. The increase in
population had a direct impact on the land cover in the Cai Nuoc area.
Figure 3 (1992 map) clearly shows a ribbon pattern: canals lined with gar-
den areas and new settlements. Between 1968 and 1992, the area labelled
as ‘‘settlement and fruit garden’’ nearly tripled. As a direct result of the
immigration and natural population growth, village area increased from a
mere 7.99 ha in 1968 to 302.99 ha in 2003, 37 times more than in 1968.
4.2. Land Policy and Changes in Farming Systems
Between 1968 and 1975, the end of the Vietnam war, the Nguyen Van
Thieu Government in South Vietnam had set up a land reform policy,
which stipulated that landowners were only allowed to have 15 ha of land
in the Southern provinces and 5 ha of land in the Central provinces in
stead of 100 ha in the past. The Nguyen Van Thieu government distributed
the land for free to the farmers (Dau et al., 1998). At the end of the Viet-
nam war, when the Nguyen Van Thieu Government was ousted, this land
policy was given up. In 1980 the Vietnamese government issued the deci-
sion 20l/CP which stipulated that land had to be equally distributed
amongst citizens. Land use and crop choice decisions were made by the
State Planning Commission (Sanh et al., 1998). As a result farmers did no
longer feel responsible for the land they used (Dau et al., 1998; Sanh et al.,
1998). This policy was maintained until 1988 when the Doi Moi liberaliza-
tion policies (started in December 1986) gave more opportunities to the
farmers. As the land policies were, initially, unclear, farmers and private
entrepreneur were more or less able to develop their land at will. As a
result farm activities shifted to intensive and more diversified cultivation
systems (Sanh et al., 1998).
Although there were many land policy changes between 1968 and 1997/
98, the total area occupied by rice-based farming systems in the Cai Nuoc
district did not change much in a 30-year time span, 49,721.68 ha in 1968,
529LAND COVER CHANGES IN CAI NUOC
49,638.41 ha in 1992 and 49,838.60 ha in 1997/98. However, while the total
area might have remained largely unchanged, it is clear (Figure 2, compare
the 1968-map with the 1992-map) that the rice area moved south-westwards
between 1968 and 1992 as more and more of the original rice cropping land
was used for settlement–gardens. Besides that, farming systems changed as
well. Rice-farming has always been the traditional cropping system in the
Mekong Delta. Before the advent of the green revolution farmers grew one
long-duration rice crop per year (Table I). By 1992, improved irrigation
and drainage systems allowed part of the farmers to grow one rice crop and
one vegetable crop per year, enabling farmers to get more food and income
per unit area land. Only by 1997 were Cai Nuoc farmers able to grow two
rice crops per year by using short-duration high yielding rice varieties, and
as a result the rice–vegetable system was completely abandoned (Table I).
The swaps in rice-based farming systems was most-probably driven by
households’ hopes for a higher income. Tanaka (1995) expected that the
recent changes in economic conditions, in particular, the changes from
agrarian reforms, would motivate Mekong Delta farmers to introduce more
market-oriented farming. In the Cai Nuoc district they certainly did.
4.3. Deforestation
The loss in mangrove forest is not an isolated case. Worldwide, shrimp
farming and other human activities have supplanted considerable man-
grove areas throughout the tropics (NACA, 2002). Up to 38% of man-
grove loss has been attributed to shrimp farming (Valiela et al., 2001).
Vietnam had more than 400,000 ha of mangroves in 1945 (Turner et al.,
1998), and it is estimated that between 152,000 ha (Turner et al., 1998)
and 200,00 ha (Nhuong et al., 2002) remain. The major causes for this
reduction are said to be the Vietnam war, expansion of rice farming,
immigration and, more recently, shrimp aquaculture. In Ca Mau prov-
ince, the mangrove cover dropped from over 200,000 ha (before 1975) to
around 65,000 ha and most of this destruction was on the account of
shrimp aquaculture (Nhuong et al., 2002). From Table II (which com-
bines pure forest stands + the mangrove area included in shrimp–man-
grove farming systems), it can be derived that between 2420.05 and
4034.04 ha of forest was lost to extensive shrimp farming in shrimp–man-
grove farming systems between 1968 and 1992 in the Cai Nuoc district.
This accounts for 21.0)30.7% of the total forested area lost in that per-
iod (lower than the figure of 38% set by Valiela et al., (2001). The rest
of the area was mainly lost to rice farming (Figure 2). Tanaka (1995)
reports that ‘‘thousands of hectares’’ of Melaleuca and mangrove forests
were cut to reclaim rice lands under the ‘‘food self-sufficiency’’ policy. It
is unclear what the effect of the war was on the mangrove forest in the
530 BINH ET AL.
Cai Nuoc district. Between 1992 and 2003 all losses (100%) in mangrove
(219.74–2713.08 ha) could be attributed to monoculture shrimp farming
as it is the only type of land cover that showed substantial increases in
acreage. As a result, the combined effect of shrimp–mangrove and shrimp
monoculture farming is responsible for a loss of 5133.13–6153.78 ha of
forest between 1968 and 2003, 36.06–40.33% of the total deforestation in
the Cai Nuoc district, or near the figure of 38% set forward by Valiela
et al. (2001). Expansion of the rice area (linked to the population growth)
seemed to be the main culprit for the loss in forest area, immediately fol-
lowed by shrimp cropping. Still, it must be noted that since 1997/98
when shrimp farming boosted, the rate of mangrove loss has increased to
4.18% (Table III). From this it is clear that while shrimp farming cannot
be blamed for the major loss in area in the past, it is, right now, the
major source of mangrove loss in the district.
The reduction in Nypa palm forest between 1992 and 1997/98 was less
pronounced than the reduction in land cover by other forest types
(Table I). However, between 1997/98 and 2003 the Nypa forest was nearly
halved. This fast decline coincides with the start of monoculture shrimp
farming. The reasons for this sudden decline are not yet clear but might be
due to land-clearing for shrimp pond construction or due to environmental
changes that came along with mono culture shrimp cultivation. Another
possibility is that Nypa got lost due to action of huge passenger boats that
travel at high speed along the often narrow canals and rivers.
The 1991 national law to protect and develop the forest could not prevent
the decline in pure forest stand with about 35% between 1992 and 1997/98
in the Cai Nuoc area (Table I). In 1998 followed two forest related new
decisions: decision 286/QD-TTG regarding reinforcement of urgent mea-
sures for the protection and development of forest area and the decision
661/QD-TTG by the prime minister with the objective, mission and policy
to grow an extra 5 million ha forest, nationwide. Between 1997/98 and
2003, a small area increase in pure stand mangrove forest was noted in the
coastal zones of the Cai Nuoc district (Table I, Figure 2). One of the gov-
ernment rules stipulates that along the coast a strip of 2-km of land must be
preserved for shrimp–mangrove systems. Only the area behind this strip can
be used for monoculture shrimp farming (Nhuong et al., 2002). However,
while many people recognize that mangrove land is not suitable for shrimp
aquaculture, it is still converted illegally to shrimp monoculture land
(Nhuong et al., 2002).
4.4. Shrimp
Shrimp farming is not entirely new to Cai Nuoc. Through interviews with
elders it was learnt that the very first experience with shrimp culture could
be traced back to 1969 when a local farmer started extensive shrimp farming
531LAND COVER CHANGES IN CAI NUOC
in the mangrove forests. It took a long time for shrimp farming to boom.
Only after the release of the much anticipated resolution 09/NQ-CP by the
government in the year 2000, did farmers feel free to transform coastal sal-
ine rice fields into shrimp farms. In 1999 shrimp farms covered 6.374 ha, in
2000 they covered 61.049 ha. The swap from rice cultivation to shrimp
farming was most-probably driven by households’ hopes for a higher
income. This is not surprising as one hectare of shrimp provides – poten-
tially – about 160 times more income than a hectare of rice. Clayton (2002)
explains that since the circumstances of the farmers imply high discount
rates (they are very poor and have little access to credit) and short planning
horizons (due to insecure tenure) farmers will ‘‘mine’’ the land driven by the
relatively high income from shrimp culture. Still it cannot be excluded that
some farmers were forced into shrimp culture due to salt leaching into their
rice fields from neighbouring shrimp ponds.
Several political decisions enabled farmers to make the shift from rice
farming to shrimp farming. First of all there was the Ca Mau coastal pro-
vincial aquaculture plan for the period 2000–2010 that demands for an
expansion in shrimp farm area and an intensification of the shrimp aqua-
culture (Dau et al., 1998; Nhuong et al., 2002). Furthermore, the govern-
ment resolution 09/NQ-CP, 2000, allowed farmers to transform coastal
saline rice fields into shrimp farms (Government of Vietnam, 2000). Shrimp
farming was not only promoted by the Vietnamese government institutions
but also by international institutions such as the World Bank and The
Asian Development Bank, mainly as a means to reduce poverty and to cre-
ate employment and income. The sudden change from rice systems to
shrimp farming also occurred in other districts within the Ca Mau prov-
ince. Sanh et al. (1998) and Brennan et al. (2002) report that farmers prac-
ticing a rice–shrimp system, where rice is grown in the wet season and
shrimp in the same field in the dry season, are abandoning the rice crop
cycle and are transforming their rice–shrimp polders into conventional
shrimp ponds, because shrimp farming is more lucrative than rice farming.
Indeed, the area used for shrimp farming in the Ca Mau province was
marginal until 2001 (in 1995 and 2000 the total aquaculture area in Ca
Mau province was 104.418 and 100.662 ha, respectively). In 2001, all of a
sudden, 202.000 ha were used for shrimp production, accounting for
47.13% of the total shrimp area in Viet Nam (RIA2, 2003). The rapid
expansion of the shrimp area was a direct result of the government resolu-
tion 09/NQ-CP (Nhuong et al., 2002).
The increase in shrimp area is not the result from a need for higher
shrimp productions but rather from a need to maintain existing levels.
Vietnam has about 265,000 ha in production, making it one of the larger
shrimp-farming nations in southeast Asia by area (Lovatelli, 1997). Shrimp
aquaculture increased by 3500% between 1976 and 1992 in the Mekong
532 BINH ET AL.
Delta, but the system collapsed in 1992–93 (Johnston et al., 2000). Shrimp
yields per unit area are low and declining (Sanh et al., 1998; Johnston
et al., 2000) as a result of viral infections in post-larvae and in natural
stocks, acid sulphate soils, pollution, poor pond design and management
and the destruction of adjacent mangrove forests (Binh et al., 1997; de
Graaf and Xuan, 1998). In some areas shrimp farming became impossible,
and as a result the shrimp industry moved along the coast towards new
areas like the Cai Nuoc district. There are roughly 35,000 ha of abandoned
shrimp ponds in the Mekong Delta of which about 50% may be rehabili-
tated (Sanh et al., 1998).
4.5. Environmental and Socio-economic Impact
It must be feared that the shrimp industry will have a negative impact on
the environment (e.g. salinization) and on the livelihood of the district’s
households. Indeed, experience from other areas learns that shrimp farm-
ing is quite often not sustainable. Robertson and Philips (1995) estimated
for intensive shrimp farms in Thailand that the forest area should be 21.7
times larger than the shrimp-ponds themselves in order to assimilate the
phosphorus from the pond effluents (for nitrogen the rate was 7.2–1. Lars-
son et al. (1994) reported that the ratio between shrimp farm and man-
grove area should be between 1:35 and 1:190. In Cai Nuoc, the 1992
shrimp area to forest area ratio was 1:25. For 1997/98 and 2003 the ratio
became 1:1 and 12:1, respectively, mainly due to an exponential increase in
shrimp area. From this it can be feared that the current shrimp industry in
the Cai Nuoc district will have negative environmental and associated
socio-economic impacts. It is well known that shrimp farming can promote
local poverty as well as food insecurity (EJF, 2003b). Increased water
quality problems (e.g. eutrophication) and shrimp diseases could be
expected in a probably very short timescale (Dahdouh-Guebas, 2001).
Data from Indonesia and Vietnam show that shrimp productivity rapidly
declines, and that risks of disease outbreaks increase after 5–10 years of
operation (FAO, 1997; Be, 2000). Shrimp survival rates in the Mekong Delta
are very low, Tran and Hiep (2000) report average survival rates of 15–20%
in one location, and 1–5% in another. Brennan et al. (1999) reported that
14% of 400 rice–shrimp farmers had experienced mass mortality of their
shrimp crop.
Within developing countries, coastal areas – such as the Cai Nuoc dis-
trict – are often characterized by a conflict between economic interests (e.g.
aquaculture development) and environmental interests. The environment
often has to pay the highest price (Foell et al., 1999). The result is too
often a loose–loose situation, in which the economic gain is a short term,
unsustainable gain. As a result neither the environment nor the economic
533LAND COVER CHANGES IN CAI NUOC
activity survives (Costa-Pierce, 2000). The loss of forest area and the swap
to shrimp monoculture, can be seen as the conversion of a multiple-user
open access resource into a single-user, single-owner system (Martinez-
Alier, 2001).
As the shrimp require brackish water, and as shrimp farming covers a
large area, it should be feared that salts penetrate the water table, leading to
the contamination of groundwater supplies and rivers by pollutants (e.g.
antibiotics used in shrimp farming) and saltwater (EJF, 2003a). Saline intru-
sion is a naturally occurring phenomenon, even in the absence of shrimp
farming. However, the salinity problem is a seasonal problem. The salt is
flushed out during the rainy season, which enables farmers to grow rice.
Around 1997, good irrigation and drainage systems with salt-control mea-
sures and short-duration rice varieties even enabled farmers to grow two rice
crops a year (Table I). Monoculture shrimp farming is keeping the freshwa-
ter out of the fields as it demands for a year round brackish aquatic environ-
ment.
During a 2003 survey in the Cai Nuoc district, some farmers expressed
the wish to convert their shrimp ponds back to rice fields, because of dis-
appointing shrimp harvests. Whether this will be possible remains to be
seen as salt–water intrusion and chemical pollution associated with shrimp
aquaculture can result in irreversible changes in the soil composition of the
shrimp ponds and surrounding areas (Bann, 1997) as such reducing the
agricultural productivity of the land (Shiva, 1995). In the Mekong Delta,
the saltwater needed for shrimp cultivation (1) changed plankton commu-
nities (Sub-Institute of Geography in Ho Chi Minh City, 2001) and soil
properties by adding more salt to soil profiles, and thereby changing the
community of soil organisms (Institute of Ecology and Biological
Resources, 2000); (2) created favourable conditions for brackish water
organisms and (3) caused a loss in freshwater habitat for freshwater species
(Hong, 1999; Nam, 2003). Effluents from shrimp cultivation increased
water pollution in rivers and canals (Hong, 1999).
5. Conclusion
From the above it seems clear that two driving forces have been shaping
the changes in land cover in the Cai Nuoc area: population pressure with
associated farming systems development and the shrimp farming industry.
Acknowledgements
The research was financed by the Flemish Inter-University Council (VLIR)
and the Vrije Universiteit Brussels (VUB). The authors wish to thank (1)
Prof Dr. Douglas for his assistance with this manuscript, (2) the staff of the
534 BINH ET AL.
Sub-Institute of Geography at Ho Chi Minh City, and (3) the Cai Nuoc
residents who facilitated the research activities.
References
Bann, C.: 1997, An Economic Analysis of Alternative Mangrove Management Strategies in Koh Kong
Province, Cambodia, Ottawa, International Development Research Centre.
Be, N.V.: 2000, An Evaluation of Coastal Forest and Fishery Resources Management Strategies in Camau
and Bentre Provinces in the Mekong Delta, Vietnam, Ph.D. Thesis, Los Ban
˜
os, University of
Philippines.
Binh, C.T., Phillips, M.J. and Demaine, H.: 1997, Integrated shrimp-mangrove farming systems in the
Mekong Delta of Vietnam, Aquaculture Research 28, 599–610.
Brennan, D., Clayton, H., Be, T.T. and Hiep, T.T.N.: 1999, Economic and social characteristics and
farm management practices of farms in the brackish water region of Soc Trang and Bac Lieu prov-
inces, Mekong Delta, Vietnam: Results of a 1997 survey (riceshrimpsur-
vey97.pdf).
Brennan, D., Preston, N., Clayton, H. and Tran, T.B.: 2002, An Evaluation of Rice-Shrimp Farming
Systems in the Mekong Delta, Report prepared under the World Bank, NACA, WWF and FAO
Consortium Program on Shrimp Farming and The Environment. Work in progress for Public discus-
sion. Published by the consortium.
Ca Mau Statistical Office: 1992, Statistic Yearbook, Ca Mau, Vietnam, Ca Mau Statistical Office.
Ca Mau Statistical Office: 1995, Statistic Yearbook, Ca Mau, Vietnam, Ca Mau Statistical Office.
Ca Mau Statistical Office: 2002, Statistic Yearbook, Ca Mau, Vietnam, Ca Mau Statistical Office.
Clayton, H.: 2002, Bioeconomic Factors of Sedimentation and Land Loss in the Natural Rice–Shrimp
System. Sustainability of the Rice–shrimp Systems in the Mekong Delta, Vietnam, ACIAR Technical
Report.
Costa-Pierce, B.A.: 2000, Aquaculture ecosystem in R. Flos and L. Creswell (eds.), Responsible Aqua-
culture in the New Millennium, Oostende, Belgium, European Aquaculture Society, Special Publica-
tion no. 28.
Dahdouh-Guebas, F.: 2001, Mangrove Vegetation Structure Dynamics and Regeneration, Ph.D. disserta-
tion, Brussels, Belgium, Vrije Universiteit Brussel.
Dahdouh-Guebas, F.: 2002, The use of remote sensing and GIS in the sustainable management of trop-
ical coastal ecosystems, in F. Dahdouh-Guebas (ed.), Remote Sensing and GIS in the Sustainable
Management of Tropical Coastal Ecosystems. Environmental Development and Sustainability 4, 93–
112.
Dau, N.D., Son Nam, Sang, H. P., Thach, T.K., An Dung, Ngoc, T.T.: 1998, Sai Gon–Ho Chi Minh
Three Hundred Cadastral, Ho Chi Minh City, Cadastral office of Ho Chi Minh City (in Vietnamese).
de Graaf, G.J. and Xuan, T.J.: 1998, Extensive shrimp farming, mangrove clearance and marine fisher-
ies in the southern province of Vietnam, Mangroves Salt Marshes 2, 159–166.
EJF: 2003a, Environmental Impacts of Shrimp Farming, London, Environmental Justice Foundation.
EJF: 2003b, Smash & Grab: Conflict, Corruption & Human Right Abuses in the Shrimp Farming Indus-
try, London, Environmental Justice Foundation.
FAO: 1997, Support for Special Plan for Prawn and Shrimp Farming, Field Document. Technical Coop-
eration Programme, Bangkok, Food and Agriculture Organisation of the United Nations
(www.fao.orgi/docrep/field/377199 .htm).
Foell, J., Harrison, E. and Stirrat, R.L.: 1999, Participatory Approaches to Natural Resource Manage-
ment – The Case of Coastal Zone Management in the Puttalam District, Summary finding of
DFID-funded research ‘Participatory mechanisms for sustainable development of coastal ecosystems’
(Project R6977), Brighton, UK, School of African and Asian studies, University of Sussex.
Fortes, M.: 1988, Mangrove and seagrass beds of East Asia: habitats under stress, Ambio 17, 207–213.
Government of Vietnam: 2000, Resolution No. 09 Regarding Some Guidelines and Policies for Trans-
forming Economic Structure and Consuming Agriculture Products, Hanoi, Government of Vietnam (in
Vietnamese).
535LAND COVER CHANGES IN CAI NUOC
Johnston, D., Trong, N.V., Tien, D.V. and Xuan, T.T.: 2000, Shrimp yields and harvest characteristics
of mixed shrimp–mangrove forestry farms in Ca Mau Province: factors affecting production, Aqua-
culture 188, 263–284.
Larsson, J., Folke, C. and Kautsky, N.: 1994, Ecological limitations and appropriations of ecosystem
support by shrimp farming in Colombia environmental Management 18, 663–676.
Lovatelli, A.: 1997, Status of aquaculture in Vietnam, Aquaculture Asia 2, 18–24.
Marshall, N.: 1994, Mangrove conservation in relation to overall environmental consideration, Hydro-
biologia 285, 303–309.
Martinez-Alier, J.: 2001, Ecological conflicts and valuation – mangroves versus shrimps in the late
1990s Environment & Planning C – Government & Policy 19, 713–728.
McMorrow, J.: 2002, Lecture of Remote Sensing, Manchester, University of Manchester.
Mofi: 2002, Two years Implementation of Aquaculture Program (2000–2001), Hanoi, Ministry of
Fisheries.
NACA: 2002, Shrimp Farming and the Environment. Can Shrimp Farming be Undertaken Sustainably?,
Bangkok, NACA.
Nhuong, T.V., Luu, LT., Tu, T.Q., Tam, P.M. and Nguyet, T.T.A.: 2002, Vietnam Shrimp Farming
Review, Individual Partner report for the Project, Policy research for sustainable shrimp farming in
Asia. European Commission INCO-DEV Project PORESSFA No. IC4-200110042, Bac Ninh,
Vietnam, CEMARE University of Portsmouth UK and RIA.
RIA2: 2003, Practices and Socio-Economics of Shrimp Farming in Tra Vinh and Ca Mau provinces,
Vietnam, A report submitted in partial fulfilment of GAMAS Project’, Ho Chi Minh, Research Insti-
tute of Aquaculture 2.
Richards, J.A.: 1994, Remote Sensing Digital Image Analysis, Berlin, Springer-Verlag.
Robertson, A.I. and Phillips, M.J.: 1995, Mangrove as filters of shrimp pond effluent: predictions and
biogeochemical research needs, Hydrobiologia 295, 311–321.
Sanh, N.V., Xuan, V.T. and Phong, T.A.: 1998, History and future of farming systems in the Mekong
Delta, in V.T. Xuan and S. Matsui (eds.), Development of Farming Systems in the Mekong Delta of
Vietnam, Ho Chi Minh City, JIRCAS, CTU & CLRRl, pp. 16–80.
Shiva, V.: 1995, The damaging social and environment effects of shrimp farming, Third World Resur-
gence 59, 22–24.
Sub-Institute of Geography at Ho Chi Minh City: 2001, Studying the Scientific Basis for the Planning
Adjustment, Production Rearrangement at Cai Nuoc District, Ca Mau Province (2000–2001), Ho Chi
Minh City, Sub-Institute of Geography at Ho Chi Minh City.
Tanaka, K.: 1995, Transformation of rice-based cropping patterns in the Mekong Delta: from intensifi-
cation to diversification, Southeast Asian Studies (Tonan Ajia Kenkyu) 33, 363–378.
Tou, J.T. and Gonzalez, R.C.: 1974, Pattern Recognition Principles, Reading, Massachusetts, Addison-
Wesley Publishing Company.
Tran, T.B. and Hiep, T.T.N.: 2000, Rice–shrimp farming Systems in the Study Area: Changes over Three
Years, 1979–99, Can Tho, ACIAR Rice-shrimp final workshop, December 12–15, Vietnam, Can Tho
University.
Turner, R.K, Adger, W.N. and Lorenzoni, I.: 1998, Towards Integrated Modelling and Analysis in
Coastal Zones: Principles and Practices, Texel, Netherlands, Land-Ocean Q Interactions in the
coastal zone projects, reports and studies No. 11.
Valiela, I., Bowen, J.L. and York, J.K.: 2001, Mangrove forests: one of the world’s threatened major
tropical environments, Bioscience 51, 807–815.
Wolanski, E., Spagnol, S., Thomas, S., Moore, K, Alongi, D.M., Trott, L. and Davidson, A.: 2000,
Modelling and visualizing the fate of shrimp pond effluent in a mangrove fringed tidal creek, Estua-
rine, Coastal,
and Shelf Science 50, 85–97.
536 BINH ET AL.