Lập trình đồ họa trong C (phần 2) potx
Bạn đang xem bản rút gọn của tài liệu. Xem và tải ngay bản đầy đủ của tài liệu tại đây (1.91 MB, 50 trang )
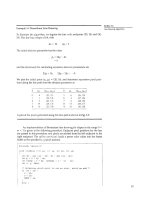
Figure
2-7
A
raster-scan system displays an object as a
set
of
dismte points across
each scan line.
scan line, is called the horizontal retrace of the electron beam. And at the end of
each frame (displayed in 1/80th to 1/60th of a second), the electron beam returns
(vertical retrace) to the top left comer of the screen to begin the next frame.
On
some raster-scan systems (and in
TV
sets), each frame is displayed in
two passes using an
interlaced
refresh pmedure. In the first pass, the beam
sweeps across every other scan line fmm top to bottom. Then after the vertical re-
trace, the beam sweeps out the remaining scan lines (Fig.
2-8).
Interlacing of the
scan lines in this way allows us to
see
the entire smn displayed in one-half the
time it would have taken to sweep amss all the lines at once fmm top to bottom.
Interlacing
is
primarily used with slower refreshing rates.
On
an older,
30
frame-
per-second, noninterlaced display, for instance, some flicker is noticeable. But
with interlacing, each of the two passes can be accomplished in 1/60th of a sec-
ond, which brings the refresh rate nearer to
60
frames per second. This
is
an effec-
tive technique for avoiding flicker, providing that adjacent scan lines contain sim-
ilar display information.
Random-Scan Displays
When operated as a random-scan display unit, a CRT has the electron beam di-
rected only to the parts of the screen where a picture is to
be
drawn. Random-
scan monitors draw a picture one line at a time and for this reason are also re-
ferred to as vector displays
(or
stroke-writing or calligraphic diisplays). The
component lines of a picture can
be
drawn and refreshed by a random-scan sys-
Chapter
2
Overview
of
Graphics
Systems
Figure
2-8
Interlacing
scan
lines
on a
raster-
scan
display.
First,
all
points
on
the
wen-numbered (solid)
scan
lines
are
displayed;
then
all
points
along
the odd-numbered (dashed)
lines
are
displayed.
tem
in
any specified order (Fig.
2-9).
A pen plotter operates in
a
similar way and
is an example of a random-scan, hard-copy device.
Refresh rate on a random-scan system depends on the number of lines to be
displayed.
Picture
definition is now stored as a set of linedrawing commands in
an area of memory refed to as the refresh display
file.
Sometimes the refresh
display file is called the display
list,
display program, or simply the
refresh
buffer. To display a
specified
picture, the system cycles through the set of com-
mands
in
the display file, drawing each component line in
turn.
After all line-
drawing commands have been processed, the system cycles back to the
first
line
command
in
the list. Random-scan displays arr designed to draw
all
the compo-
nent lines of a picture
30
to
60
times
each second. Highquality vector systems are
capable of handling approximately
100,000
"short"
lines
at this refresh rate.
When a small set of lines
is
to be displayed, each rrfresh cycle is delayed to avoid
refresh rates greater than
60
frames per second. Otherwise, faster refreshing oi
the
set
of lines could bum out the phosphor.
Random-scan systems
are
designed for linedrawing applications and can-
not display realistic shaded scenes.
Since
pidure definition is stored as
a
set of
linedrawing instructions and not
as
a set of intensity values for
all
screen
points,
vector displays generally have higher resolution than raster systems.
Also,
vector
displays produce smooth line drawings
because
the
CRT
beam directly follows
the line path.
A
raster system,
in
contrast, produces
jagged
lines
that
are
plotted
as dhte point sets.
Color CRT Monitors
A
CRT monitor displays color pictures by using a combination of phosphors that
emit different-colored light. By combining the emitted light from the different
phosphors, a range of colors can
be
generated. The two basic techniques for pro-
ducing color displays with a
CRT
are
the beam-penetration method and the
shadow-mask method.
The beam-penetration method for displaying color pictures has
been
used
with random-scan monitors. Two layers of phosphor, usually red and green, are
Figure
2-9
A
random-scan system
draws
the component
lines
of
an
object
in any
order specified.
coated onto the inside of the
CRT
screen, and the displayed color depends on
how far the electron beam penetrates into the phosphor layers. A beam of slow
electrons excites only the outer
red
layer.
A
beam of very fast electrons penetrates
through the
red
layer and excites the inner green layer. At intermediate beam
speeds, combinations of
red
and green light are emitted to show two additional
colors, orange and yellow. The speed of the electrons, and hence the screen color
at any point,
is
controlled by the beam-acceleration voltage. Beam penetration
has been
an
inexpensive way to produce color in random-scan monitors, but only
four colors are possible, and the quality of pictures is not as good as with other
methods.
Shadow-mask methods
are
commonly
used
in rasterscan systems (includ-
ing color
TV)
because they produce a much wider range of colors than the beam-
penetration method. A shadow-mask CRT has three phosphor color dots at each
pixel position. One phosphor dot emits a
red
light, another emifs
a
green light,
and the third emits a blue light.
This
type
of
CRT
has three electron guns, one for
each color dot, and
a
shadow-mask grid just behind the phosphor-coated screen.
Figure
2-10
illustrates the
deltadelta
shadow-mask method, commonly used
in
color
CRT
systems. The three electron beams are deflected and focused as a
group onto the shadow mask, which contains a series of holes aligned with the
phosphor-dot patterns. When the
three
beams pass through a hole in the shadow
mask, they activate a dot triangle, which appears as a small color spot on the
screen.
The
phosphor dots
in
the triangles are arranged so that each electron
beam can activate only its corresponding color dot when it
passes
through the
Chapter
2
Overview
of
Graphics Systems
Elearon
Guns
I
Magnified
I
Phos~hor-Do1
'
Trtsngle
Figure
2-10
Operation of
a
delta-delta, shadow-mask
CRT.
Three
electron
guns,
aligned
with
the
triangular colordot patterns
on
the
screen,
are
directed
to each dot triangle
by
a
shadow mask.
shadow mask. Another configuration for the three electron guns is an
in-line
arrangement
in
which the three electron guns, and the corresponding
red-green-blue color dots on the screen, are aligned along one scan line instead
of in a
triangular
pattern. This in-line arrangement of electron guns
is
easier to
keep in alignment and is commonly used in high-resolution color CRTs.
We obtain color variations
in
a shadow-mask CRT by varying the intensity
levels of the three electron beams. By turning off the
red
and green
guns,
we get
only the color coming
hm
the blue phosphor. Other combinations of beam
in-
tensities produce a small light spot for each pixel position, since our eyes tend to
merge the three colors into one composite. The color we
see
depends on the
amount of excitation of the
red,
green, and blue phosphors.
A
white (or gray)
area is the result of activating all
three
dots with equal intensity. Yellow is pro-
duced with the green and
red
dots only, magenta
is
produced with the blue and
red
dots, and cyan shows up when blue and green are activated equally. In some
low-cost systems, the electron beam can only
be
set to on or off, limiting displays
to eight colors. More sophisticated systems can set intermediate intensity levels
for the electron beams, allowing several million different colors to be generated.
Color graphics systems can
be
designed to be used with several
types
of
CRT
display devices. Some inexpensive home-computer systems and video
games
are
designed for
use
with
a
color
TV
set and
an
RF
(radio-muency) mod-
ulator. The purpose of the
RF
mCdulator
is
to simulate the signal from a broad-
cast
TV
station. This means that the color and intensity information of the picture
must be combined and superimposed on the broadcast-muen*
carrier
signal
that the
TV
needs to have as input. Then the cirmitry in the
TV
takes this signal
from
the
RF
modulator, extracts the picture information, and paints it on the
screen. As we might expect, this extra handling of the picture information
by
the
RF
modulator and
TV
circuitry decreases the
quality
of displayed images.
Composite monitors
are
adaptations of
TV
sets that allow bypass of the
broadcast circuitry. These display devices still require that the picture informa-
tion be combined, but no carrier signal is needed. Picture information
is
com-
Mion
2-1
bined into a composite signal and then separated by the monitor,
so
the resulting
Video
Display
Devices
picture quality is still not the best attainable.
Color CRTs in graphics systems are designed as
RGB
monitors.
These
mon-
itors use shadow-mask methods and take the intensity level for each electron gun
(red, green, and blue) directly from the computer system without any intennedi-
ate processing. High-quality raster-graphics systems have
24
bits
per
pixel
in
the
kame buffer, allowing
256
voltage settings for each electron gun and nearly
17
million color choices for each pixel. An
RGB
color system with
24
bits of storage
per pixel is generally referred to as a full-color system or a true-color system.
Direct-View Storage Tubes
An alternative method for maintaining a screen image is to store the picture in-
formation inside the CRT instead of refreshing the screen. A direct-view storage
tube (DVST) stores the picture information as a charge distribution just behind
the phosphor-coated screen. Two electron guns
are
used in a DVST. One, the pri-
mary gun, is used to store the picture pattern; the second, the flood gun, main-
tains the picture display.
A DVST monitor has both disadvantages and advantages compared to the
refresh CRT. Because no refreshing is needed, very complex pidures can
be
dis-
played at very high resolutions without flicker. Disadvantages of DVST systems
are that they ordinarily do not display color and that selected parts of a picture
cannot he erased.
To
eliminate
a
picture section, the entire screen must
be
erased
and the modified picture redrawn. The erasing and redrawing process can take
several seconds for a complex picture. For these reasons, storage displays have
been largely replaced by raster systems.
Flat-Panel
Displays
Although most graphics monitors are still constructed with CRTs, other technolo-
gies are emerging that may soon replace CRT monitc~rs. The term Bat-panel dis-
play refers to a class of video devices that have reduced volume, weight, and
power requirements compared to a CRT.
A
significant feature of flat-panel dis-
plays is that they are thinner than CRTs, and we can hang them on walls or wear
them on our wrists. Since we can even write on some flat-panel displays, they
will soon
be
available as pocket notepads. Current uses for flat-panel displays in-
clude small
TV
monitors, calculators, pocket video games, laptop computers,
armrest viewing of movies on airlines, as advertisement boards in elevators, and
as graphics displays in applications requiring rugged, portable monitors.
We can separate flat-panel displays into two categories: emissive displays
and nonemissive displays. The emissive displays
(or
emitters) are devices that
convert electrical energy into light. Plasma panels, thin-film electroluminescent
displays, and Light-emitting diodes are examples of emissive displays. Flat CRTs
have also been devised,
in
which electron beams arts accelerated parallel to the
screen, then deflected
90'
to the screen. But
flat
CRTs have not proved to be as
successful as other emissive devices. Nonemmissive displays (or nonemitters)
use optical effects to convert sunlight or light from some other source into graph-
ics patterns. The most important example of a nonemisswe flat-panel display is a
liquid-crystal device.
Plasma panels, also called gas-discharge displays, are constructed by fill-
ing
the region between two glass plates with a mixture of
gases
that usually
in-
Chapter
2
dudes neon.
A
series
of
vertical conducting ribbons is placed on one glass panel,
Overview
dGraphics
Systems
and a
set
of horizontal ribbons is built into the other glass panel (Fig.
2-11).
Firing
voltages applied to a pair of horizontal and vertical conductors cause the gas at
the intersection of the two conductors to break down into a glowing plasma of
elecbons and ions.
Picture
definition
is
stored in a refresh buffer, and the firing
voltages are applied to refresh the pixel positions (at the intersections of the con-
ductors)
60
times per second. Alternahng-t methods
are
used to provide
faster application of the firing voltages, and thus bnghter displays. Separation
between
pixels
is
provided by the electric field of the conductors. Figure
2-12
shows a highdefinition plasma panel. One disadvantage of plasma panels has
been
that they were strictly monochromatic devices, but systems have been de-
veloped that are now capable of displaying color and grayscale.
Thin-film electroluminescent displays are similar in construction to a
plasma panel. The diffemnce
is
that the region between the glass plates is filled
with a phosphor, such as zinc sulfide doped with manganese, instead of a gas
(Fig.
2-13).
When a suffiaently high voltage is applied to a
pair
of crossing elec-
trodes,
the phosphor becomes a conductor in the area of the intersection of the
two electrodes. Electrical energy
is
then absorbed by the manganese atoms,
which
then release the energy as a spot
of
light similar to the glowing plasma ef-
fect
in
a plasma panel. Electroluminescent displays require more power than
plasma panels, and good color and gray scale displays
are
hard to achieve.
A
third
type
of emissive device is the light-emitting diode
(LED).
A
matrix
of diodes
is
arranged to form the pixel positions in the display, and picture defin-
ition
is
stored in a refresh buffer.
As
in xan-line refreshing of a
CRT,
information
Figure
2-11
Basic design of
a
plasma-panel
display
device.
Figure
2-12
A
plasma-panel display
with
a
resolution
of
2048
by
2048
and
a
screen diagonal
of
1.5
meters.
(Courtesy of Photonics Systons.)
Mion
2-1
Vldeo
Display
Devices
Figure
2-13
Basic design
of
a
thin-film
electroluminescent display device.
is read from the refresh buffer and converted to voltage levels that are applied to
the diodes to produce the light patterns in the display.
-
~i~uid&ystal displays (LCDS)
are
commonly
used
in small systems, such
as calculators (Fig. 2-14) and portable, laptop computers (Fig. 2-15). These non-
emissive devices produce a picture by passing polarized light from the surround-
ings or
from
an internal light
sow
through a liquid-aystal material that can
be
aligned to either block or transmit the light.
The term
liquid
crystal
refers to the fact that these compounds have a crys-
talline arrangement of molecules, yet they flow like a liquid. Flat-panel displays
commonly use nematic (threadlike) liquid-crystal compounds that tend to keep
the long axes
of
the rod-shaped molecules aligned.
A
flat-panel display can then
be constructed with
a
nematic liquid crystal, as demonstrated
in
Fig. 2-16. Two
glass plates, each containing a light polarizer at right angles to the-other plate,
sandwich the liquid-crystal material. Rows of horizontal transparent conductors
are built into one glass plate, and columns of vertical conductors are put into the
other plate. The intersection
of
two conductors defines a pixel position. Nor-
mally, the molecules are aligned as shown in the "on state" of Fig. 2-16. Polarized
light passing through the material
is
twisted
so
that it
will
pass through the op-
posite polarizer. The light
is
then mfleded back to the viewer. To
turn
off
the
pixel, we apply a voltage to the two intersecting conductors to align the mole
cules
so
that the light
is
not .twisted.
This
type
of flat-panel device
is
referred to as
a passive-matrix
LCD.
Picture definitions are stored in a refresh buffer, and the
Figure2-14
screen is refreshed at the rate of
60
frames per second,
as
in the emissive devices.
A
hand calculator
with
an
Back lighting is also commonly applied using solid-state electronic devices,
so
(Courtes~of
Exus
that the system is not completely dependent on outside light
soufies.
Colors can
1N'"ment5.)
be displayed by using different materials or dyes and by placing a triad of color
pixelsat each &reen location. Another method for conskctingk13s is to place
a transistor at each pixel location, using thin-film transistor technology. The tran-
sistors are
used
to control the voltage at pixel locations and to prevent charge
from gradually leaking out of the liquid-crystal cells. These devices are called
active-matrix displays.
Figun
2-15
A
backlit,
passivematrix, liquid-
crystal
display
in
a
Laptop
computer,
featuring
256
colors,
a
screen
resolution
of
640
by
400,
and
a
saeen
diagonal
of
9
inches.
(Caurtesy
of
Applc
Computer,
Inc.)
Fipe
2-16
The
light-twisting, shutter
effect
used
in
the design
of
most liquid-
crystal
display
devices.
Three-Dimensional Viewing Devices
Section
2-1
Video
Dtsplay
Devices
Graphics monitors for the display of three-dimensional scenes have been devised
using a technique that reflects a
CRT
image from
a
vibrating, flexible mirror.
The
operation of such
a
system is demonstrated in Fig.
2-17.
As the varifocal mirror
vibrates, it changes focal length.
These
vibrations are synchronized with the dis-
play of an object on a
CRT
so that each point on the object is reflected from the
mirror into a spatial position corresponding to the distance of that point from
a
specified viewing position.
This
allows us to walk around an object or scene and
view it from different sides.
Figure
2-18
shows the Genisco SpaceCraph system, which uses
a
vibrating
mirror to project three-dimensional objects into a
25cm
by
2h
by
25-
vol-
ume. This system
is
also capable
of
displaying two-dimensional cross-sectional
"slices" of objects selected at different depths.
Such
systems have been
used
in
medical applications to analyze data
fmm
ulhasonography and
CAT
scan de-
vices, in geological applications to analyze topological and seismic data, in
de-
sign applications involving solid objects, and in three-dimensional simulations of
systems, such as molecules and terrain.
I-&
Vibrating Flsxible Mirror
-,
I
Figure
2-1
7
P
+ation of a three-dimensional display system using a
vibrating mirror that changes focal length to match
the
depth of
points
in
a scene.
D.
Figure
2-16
The
SpaceCraph interactive
graphics system displays objects in
three dimensions using
a
vibrating,
flexible mirror.
(Courtesy
of
Genixo
Compufm
Corpornlion.)
49
Chapter
2
Stereoscopic
and
Virtual-Reality Systems
Overview
of
Graphics
Systems
Another technique for representing tbdimensional objects
is
displaying
stereoscopic views.
This
method dws not produce hue three-dimensional im-
ages, but it does provide a three-dimensional effect
by
presenting a different
view to each eye of an observer
so
that scenes do appear to have depth (Fig.
2-19).
To obtain a stereoscopic proyxtion, we first need to obtain two views of a
scene generated from. a yiewing direction corresponding to each eye (left and
right).
We
can
consma
the two views
as
computer-generated scenes with differ-
ent viewing positions, or we can use a stem camera pair to photograph some
object
or scene. When we simultaneous
look
at the left view with the left eye and
the right view with the right eye, the ~o views merge into a single image and
we perceive a scene with depth. Figure
2-20
shows two views of a computer-
generated scene for stemgraphic
pmpdiori.
To increase viewing comfort, the
areas
at the left and right edges of !lG scene that
are
visible to
only
one eye have
been eliminated.
-
Figrrrc
2-19
Viewing
a
stereoscopic
projection.
(Courlesy of
S1ered;mphics
Corpomlion.)
A
stereoscopic
viewing
pair.
(Courtesy
ofjtny
Farm.)
50
One way to produce a stereoscopic effect
is
to display
each
of the two views
Mion
2-1
with a raster system on alternate refresh cycles. The
sa~en
is
viewed through
Mdeo
Display
Devices
glasses, with each lens designed to act
as
a rapidly alternating shutter that
is
syn-
chronized to block out one of the views.
Figure
2-21
shows a
pair
of stereoscopic
glasses constructed with liquidcrystal shutters and
an
infrared
emitter that syn-
chronizes the glasses with the views on the screen.
Stereoscopic viewing
is
also
a component in
virtual-reality
systems,
where users can step into
a
scene and interact with the environment.
A
headset
(Fig.
2-22)
containing an optical system to generate the stemxcopic views is
commonly
used
in conjuction with interactive input devices
to
locate and
manip
date objects in the scene.
A
sensing system in the headset
keeps
track of the
viewer's position,
so
that
the
front
and
back
of objects
can
be
m
as
the viewer
Figure
2-21
Glasses
for
viewing
a
stereoscopic scene
and
an
infrared
synchronizing emitter.
(Courtesy of
SfnroCraphics
Copration.)
~
.
-
Figure
2-22
A
headset
used
in
virtual-reality
systems.
(Coudrsy
of
Virtual
RPsePrch.)
Chapter
2
Overview
d
Graphics
Systems
Figure
2-23
Interacting
with
a
virtual-reality
environment.
(Carrtq
of
tk
Nahl
Cmtrr~b
Svprmmpvting
Applbtioru,
Unmrrsity
of
nlinois
at
UrboMCknrpngn.)
"walks
through"
and
interacts
with the
display.
Figure
2-23
illustrates interaction
with a
virtual
scene,
using a headset
and
a
data glove worn on the right hand
(Section
2-5).
An
interactive
virtual-reality
environment
can
also
be
viewed
with
stereo-
scopic
glasses
and
a video
monitor,
instead of a headset.
This
provides
a means
for obtaining a lowercost virtual-reality system. As an example, Fig.
2-24
shows
an
ultrasound
tracking device
with
six degrees
of
freedom. The tracking device
is
placed on
top
of the video display and
is
used
to
monitor head movements
so
that the viewing position for a scene can
be
changed as head position changes.
-
Fipm
2-24
An
ultrasound
tracking
device
used
with
Btereoscopic
gbsses
to
track
head position.
~~
of
StrrmG*
Corpmrrh.)
2-2
Sedion
2-2
RASTER-SCAN SYSTEMS
Raster-kan
Systems
Interactive raster graphics systems typically employ several processing units. In
addition
to
the central pmessing unit, or
CPU,
a special-purpose processor,
called the video controller or display controller,
is
used to control the operation
of the display device. Organization of
a
simple raster system
is
shown in Fig.
2-25.
Here, the frame buffer can
be
anywhere
in
the system memory, and the video
controller accesses the frame buffer to refresh the screen. In addition to the video
controller, more sophisticated raster systems employ other processors as co-
processors and accelerators to impIement various graphics operations.
Video Controller
Figure
2-26
shows a commonly
used
organization for raster systems.
A
fixed
area
of the system memory
is
reserved
for the frame buffer, and the video controller is
given direct access to the frame-buffer memory.
Frarne-buffer locations, and the corresponding
screen
positions, are refer-
enced
in
Cartesian coordinates. For many graphics monitors, the coordinate ori-
Figure
2-25
Architedure
of
a
simple raster
graphics
system.
Figure
2-26
Wtectureof
a
raster system
with
a
fixed
portion
of the system
memory
reserved
for the
frame
buffer.
Chapter
2
Owrview
of
Graphics
Systems
Figure
2-27
The
origin of the coordinate
system for identifying screen
positions
is
usually
specified
in
the lower-left corner.
gin is'defined at the lower left screen comer (Fig. 2-27). The screen surface
is
then
represented as the first quadrant of a two-dimensional system, with positive
x
values increasing to the right and positive
y
values increasing from bottom to
top.
(On
some personal computers, the coordinate origin is referenced at the
upper left comer of the screen, so the
y
values are inverted.)
Scan
lines
are
then
labeled from
y,
at the top of the screen to
0
at the bottom. Along each scan line,
screen pixel positions are labeled
from
0
to
x,,.
In Fig.
2-28,
the basic refresh operations of the video controller
are
dia-
grammed.
Two registers are used to store the coordinates
of
the screen pixels.
Ini-
tially, the
x
register
is
set to
0
and the
y
register is set to
y,.
The value stored in
the frame buffer for this pixel position is then retrieved and used to set the inten-
sity of the
CRT
beam. Then the
x
register is inrremented
by
1,
and the process
re
peated for the next pixel on the top scan line. This procedure
is
repeated for each
pixel along the scan line. After the last pixel on the top scan line has been
processed, the
x
register is reset to
0
and the
y
register
is
decremented by
1.
Pixels
along this scan line are then processed in
turn,
and the procedure is repeated for
each successive scan line. After cycling through all pixels along the bottom scan
line
(y
=
O),
the video controller resets the registers to the first pixel position on
the top scan line and the refresh process starts over.
Since the screen must be refreshed at the rate of 60 frames per second, the
simple procedure illustrated in Fig. 2-28 cannot
be
accommodated by typical
RAM
chips. The cycle time is too slow. To speed up pixel processing, video con-
trollers can retrieve multiple pixel values from the refresh bder on each pass.
The multiple pixel intensities are then stored in a separate register and used to
control the
CRT
beam intensity for a group of adjacent pixels. When that group
of pixels has been processed, the next block of pixel values is retrieved from the
frame buffer.
A number of other operations can be performed by the video controller,
be-
sides the basic refreshing operations. For various applications, the video con-
Figure
2-28
Basic video-controller
refresh
operations.
-
-
-
-
.
-
-
-
Figiirc
2-29
Architecture
of
a raster-graphics system with a display
processor.
troller can retrieve pixel intensities
from
different memory areas on different
re-
fresh cycles. In highquality systems, for example, two hame buffers are often
provided
so
that one buffer
can
be used for refreshing while the other is being
filled with intensity values. Then the two buffers can switch roles. This provides
a fast mechanism-for generating real-time animations, since different views of
moving objects can
be
successively loaded inta the refresh buffers. Also, some
transformations can
be
accomplished by the video controller. Areas of the screen
can be enlarged, reduced, or moved from one location to another during the
re-
fresh cycles. In addition, the video controller often contains a lookup table,
so
that pi;el values in the frame buffer are used to access the lookup tableinstead of
controlling the
CRT
beam intensity directly. This provides a fast method for
changing screen intensity values, and we discuss lookup tables
in
more detail
in
Chapter
4.
Finally, some systems arr designed to allow the video controller to
mix the frame-buffer image with an input image from a television camera or
other input device.
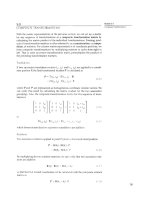
Raster-Scan
Display
Processor
Figure
2-29
shows one way to
set
up the organization of a raster system contain-
ing a separate display processor, sometimes referred to as a graphics controller
or
a
display coprocessor. The purpose of the display processor
is
to
free
the CPU
from the graphics chores. In addition to the system memory, a separate display-
processor memory area can
also
be provided.
A major task of the display pmcessor is digitizing a picture definition given
'
-
I
in an application program into a set of pixel-intensity values for storage in the
frame buffer.
This
digitization process is caIled scan conversion. Graphics com-
k'~llw
2 30
mands specifying straight lines and other geometric objects are scan converted
A
character defined
as
a
into a set
of
discrete intensity points. Scan converting a straight-line segment, for
rcctangu'ar
grid
of
pixel
positions.
example, means that we have to locate the pixel positions closest to the line path
and store the intensity for each position in the frame buffer. Similar methods are
used for scan converting curved lines and polygon outlines. Characters can
be
defined with rectangular grids, as in Fig.
2-30,
or they can be defined with curved
5
5
outlines, as in Fig.
2-31.
The array size for character grids can vary from about
5
by
7
to
9
by
12
or more for higher-quality displays. A character grid is displayed
by superimposing the rectangular grid pattern into the frame buffer at a specified
coordinate position. With characters that are defined as curve outlines, character
shapes are scan converted into the frame buffer.
Display processors are also designed to perform a number of additional op-
erations. These functions include generating various line styles (dashed, dotted,
or solid), displaying color areas, and performing certain transformations and ma-
nipulations on displayed objects. Also, display pmessors are typically designed
to interface with interactive input devices, such as a mouse.
Fiprr
2-3
I
In an effort to reduce memory requirements in raster systems, methods
A
character defined as
a
have been devised for organizing the frame buffer as a linked
list
and encoding
curve outline.
the intensity information. One way to do this is to store each scan line as a set of
integer pairs. Orre number of each pair indicates an intensity value, and the sec-
ond number specifies the number of adjacent pixels on the scan line that are to
have that intensity. This technique, called run-length encoding, ,can result in
a
considerable saving in storage space
if
a picture is to
be
constructed mostly with
long runs of
a
single color each.
A
similar approach can be taken when pixel in-
tensities change linearly. Another approach is to encode the raster as
a
set
of
rec-
tangular areas (cell encoding). The aisadvantages of encoding
runs
are that in-
tensity changes are difficult to make and storage requirements actually increase
as the length of the runs decreases. In addition, it is difficult for the display con-
troller to process the raster when many short runs are involved.
2-3
RANDOM-SCAN SYSTEMS
The
organization of a simple random-scan (vector) system is shown in Fig.
2-32.
An application program is input and stored in the system memory along with
a
graphics package. Graphics commands in the application program are translated
by the graphics package into a display file stored in the system memory. This dis-
play file is then accessed by the display processor to refresh the screen. The dis-
play processor cycles through each command in the display file program once
during every refresh cycle. Sometimes the display processor in a random-scan
system is referred to as a display processing unit or a graphics controller.
Figure
2-32
Architecture of
a
simple randomscan system.
Graphics patterns
are
drawn on a random-scan system by directing the
section
2-4
electron beam along the component lines of the picture.
Lines
are defined by the
Graphics Monilors
values for their coordinate endpoints, and these input coordinate values are con-
and
Worksrations
verted to
x
and
y
deflection voltages.
A
scene
is
then drawn one
line
at a time by
positioning the beam to fill
in
the line between specified endpoints.
2-4
GRAPHICS MONITORS AND WORKSTATIONS
Most graphics monitors today operate as rasterscan displays, and here we sur-
vey a few
of
the many graphics hardware configurations available. Graphics sys-
tems range hm small general-purpose computer systems with graphics capabil-,
ities (Fig.
2+)
to sophisticated fullcolor systems that
are
designed specifically
for graphics applications (Fig.
2-34).
A
typical screen resolution for
personal
com-
Figure
2-33
A
desktop general-purpose
computer system
that
can
be
used
for graphics applications.
(Courtesy of
Apple
Compula.
lnc.)
-
Figure
2-34
Computer graphics workstations
with
keyhrd and mouse input devices. (a) The
Iris
Indigo.
(Courtesyo\
Silicon Graphics
Corpa~fion.)
(b)
SPARCstation
10.
(Courtesy
01
Sun
Microsyslems.)
5
7
Cham
2
puter systems, such as the Apple Quadra shown in Fig.
2-33,
is
640
by
480,
al-
Overview
of
Graphics
Systems
though screen resolution and other system capabilities vary depending on the
size and cost of the system. Diagonal screen dimensions for general-purpose per-
sonal computer systems can range from
12
to
21
inches, and allowable color
se-
lections range from
16
to over
32,000.
For workstations
specifically
designed for
graphics applications, such as the systems shown
in
Fig.
2-34,
typical
screen
reso-
lution
is
1280
by
1024,
with a screen diagonal of
16
inches or more. Graphics
workstations can
be
configured with from
8
to
24
bits per pixel (full-color sys-
tems), with higher screen resolutions, faster processors, and other options avail-
able
in
high-end systems.
Figure
2-35
shows a high-definition graphics monitor used
in
applications
such as
air
traffic control, simulation, medical imaging, and
CAD.
This
system
has a diagonal
scm
size of 27 inches, resolutions ranging from
2048
by
1536
to
2560
by
2048,
with refresh rates of
80
Hz or
60
Hz
noninterlaced.
A
multim system called the MediaWall, shown
in
Fig.
2-36,
provides a
large "wall-sized display area. This system is designed for applications that re-
quirr large area displays in brightly lighted environments, such as at trade
shows, conventions,
retail
stores, museums, or passenger terminals. MediaWall
operates by splitting images into a number of Sections and distributing the
sec-
tions over an array of monitors or projectors using a graphics adapter and satel-
lite control units. An array of up to
5
by
5
monitors, each with a resolution of
640
by
480,
can
be
used
in
the MediaWall to provide an overall resolution of
3200
by
2400
for either static scenes or animations. Scenes
can
be
displayed behind mul-
lions, as in Fig.
2-36,
or the mullions can
be
eliminated to display a continuous
picture with no breaks between
the
various sections.
Many graphics workstations, such as some of those shown
in
Fig.
2-37,
are
configured with two monitors. One monitor can be used to show all features of
an obpct or scene, while the second monitor displays the detail in some part of
the picture. Another use for dual-monitor systems
is
to view
a
picture on one
monitor and display graphics options (menus) for manipulating the picture
com-
ponents on the other monitor.
Figure
2-35
A
very
high-resolution
(2560
by
2048)
color monitor.
(Courtesy
of
BARCO
Chromatics.)
he
Mediawall:
A
multiscreen display system. The image displayed on
this
3-by-3
array of monitors was created
by
Deneba
Software.
(Courtesy
Figurr
2-37
Single-
and dual-monitor graphics workstations.
(Cdurtq
of
Intngraph
Corpratiun.)
Figures
2-38
and 2-39 illustrate examples of interactive graphics worksta-
tions containing multiple input and other devices.
A
typical setup for
CAD
appli-
cations
is
shown in Fig. 2-38. Various keyboards, button boxes, tablets, and mice
are attached to the video monitors for
use
in
the
design process. Figure 2-39
shows features of some
types
of
artist's
workstations.
-
-
-
-
-
-
Figure
2-38
Multiple workstations for
a
CAD
group.
(Courtesy
of Hdctf-Packard
Complny.)
Figure
2-39
An
artist's
workstation, featuring
a
color raster monitor,
keyboard,
graphics tablet
with
hand
cursor,
and
a
light table,
in
addition
to
data
storage
and
telecommunications
devices.
(Cburtesy
of DICOMED
C0t)mation.)
2-5
INPUT
DEVICES
Various
devices
are
available for data input on graphics workstations. Most
sys-
tems have a keyboard and
one
or more additional devices specially designed for
interadive input. These include a mouse,
trackball,
spaceball, joystick,
digitizers,
dials, and button boxes. Some other input dev~ces
usea
In particular applications
Wion
2-5
-
are data gloves, touch panels, image scanners, and voice systems.
Input
Devices
Keyboards
An alphanumeric keyboard on a graphics system is
used
primarily as a device
for entering text strings. The keyboard is an efficient device for inputting such
nongraphic data as
picture
labels associated with a graphics display. Keyboards
can
also
be
provided with features to facilitate entry of screen coordinates, menu
selections, or graphics functions.
Cursor-control keys and function keys are common features on general-
purpose keyboards. Function keys allow users to enter frequently used opera-
tions in
a
single keystroke, and cursor-control keys can
be
used
to select dis-
played objects or coordinate positions by positioning the screen cursor. Other
types of cursor-positioning devices, such as a trackball or joystick, are included
on some keyboards. Additionally, a numeric keypad is,often included on the key-
board for fast entry of numaic data. Typical examples of general-purpose key-
boards are given
in
Figs.
2-1,
2-33,
and
2-34.
Fig.
2-40
shows an ergonomic
keyboard design.
For specialized applications, input to a graphics application may come from
a set of buttons, dials, or
switches
that select data values or customized graphics
operations. Figure 2-41
gives
an
example of a
button
box
and a set of input dials.
Buttons and switches are often
used
to input predefined functions,
and
dials are
common devices for entering
scalar
values.
Real numbers within some defined
range are selected for input with
dial
rotations. Potenhometers are used to mea-
sure dial rotations, which
are
then converted to deflection voltages for cursor
movement.
Mouse
A
mouse
is small hand-held box used to position the screen cursor. Wheels or
rollers on the bottom of the mouse can be used to record the amount and direc-
Figure
2-40
Ergonomically
designed
keyboard
with removable palm
rests.
The
slope of each
half
of
the
keyboard
can
be
adjusted
separately.
(Courtesy
of
Apple
Computer,
Inc.)
Chapter
2
tion of movement. Another method for detecting mouse motion
is
with
an
opti-
Overview
of
Graphics
Svstrms
cal sensor. For these systems, the mouse
is
moved over a
special
mouse pad that
has a grid of horizontal and vertical lines. The optical sensor deteds movement
acrossthe lines in the grid.
Since
a
mouse
can
be picked up and put down at another position without
change
in
curs6r movement, it
is
used
for
making
relative change.%
in
the position
of the screen cursor. One, two, or
three
bunons
m
usually included
on
the top of
the mouse for signaling the execution of some operation,
such
as
recording
&-
sor position or invoking
a
function. Mast general-purpose graphics systems now
include
a
mouse and a keyboard as the major input devices, as
in
Figs.
2-1,2-33,
and
2-34.
Additional devices
can
be included in the
basic
mouse design to increase
the number of allowable input parameters. The
Z
mouse in
Fig.
242
includes
-
Figuw
2-41
A
button
box
(a) and a set of
input
dials
(b).
(Courtesy
of
Vcaor
Cownl.)
Figure
2-42
The
2
mouse
features
three
bunons,
a mouse
ball
underneath,
a
thumbwheel
on
the
side,
and a
trackball
on
top.
(Courtesy
of
Multipoinl
Technology
Corporat~on.)
three buttons, a thumbwheel on the side, a trackball on the top, and a standard
Mon2-5
mouse ball underneath. This design provides
six
degrees of freedom to select
Input
Devices
spatial positions, rotations, and other parameters. Wtth the
Z
mouse, we can pick
up an object, rotate it, and move it in any direction, or
we
can
navigate our view-
ing position and orientation through a threedimensional
scene.
Applications of
the
Z
mouse include ~irtual reality,
CAD,
and animation.
Trackball and Spaceball
As the name implies, a trackball is a ball that can
be
rotated
with
the fingers or
palm of the hand, as in Fig.
2-43,
to produce screen-cursor movement. Poten-
tiometers, attached to the
ball,
measure the amount and direction
of
rotation.
Trackballs are often mounted on keyboards (Fig.
2-15)
or
other
devices such as
the
Z
mouse (Fig.
2-42).
While a trackball is a two-dimensional positioning device, a spaceball (Fig.
2-45)
provides six degrees of freedom. Unlike the trackball, a spaceball does not
actually move. Strain gauges measure the amount of pressure applied to the
spaceball to provide input for spatial positioning and orientation as the ball is
pushed or pulled in various diredions. Spaceballs are used for three-dimensional
positioning and selection operations in virtual-reality systems, modeling, anima-
tion,
CAD,
and other applications.
joysticks
A
joystick consists of a small, vertical lever (called the stick) mounted on a base
that is used to steer the screen cursor
around.
Most bysticks select screen posi-
tions with actual stick movement; others respond to inksure on the stick.
FI~
2-44
shows a movable joystick. Some joysticks are mounted on a keyboard; oth-
ers lnction as stand-alone units.
The distance that the stick is moved in any direction from its center position
corresponds to screen-cursor movement in that direction. Potentiometers
mounted at the base of the joystick measure the amount of movement, and
springs
return
the stick to the center position when it
is
released. One or more
buttons
can
be
programmed to act as input switches to signal certain actions once
a screen position has been selected.
-
. .
Figure
2-43
A
three-button track
ball.
(Courlrsyof
Mtnsumne~l
Sysfems
lnc.,
Nomlk,
Connccticul.)
Chapter
2
Overview
of
Graphics
Systems
Figrrr
2-44
A
moveable pystick.
(Gurtesy
of
CaIComp
Group;
Snndns
Assm+tes,
Inc.)
In another
type
of movable joystick, the stick
is
used
to activate switches
that cause the screen cursor to move at a constant rate
in
the direction selected.
Eight switches, arranged in a circle, are sometimes provided, so that the stick
can
select any one of eight directions for cursor movement. Pressuresensitive joy-
sticks, also called isometric joysticks, have a nonmovable stick.
Pressure
on the
stick is measured
with
strain gauges and converted to movement of the cursor in
the direction specified.
Data
Glove
Figure
2-45
shows a data
glove
that can be
used
to grasp a
"virtual"
object. The
glove is constructed with a series of sensors that detect hand and finger motions.
Electromagnetic coupling between transmitting antennas and receiving antennas
is
used
to provide information about the position and orientation of the
hand.
The transmitting and receiving antennas can each be structured
as
a set of three
mutually perpendicular coils, forming a three-dimensional Cartesian coordinate
system. Input
from
the glove can be used to position or manipulate objects in a
virtual scene.
A
two-dimensional propdion of the scene can be viewed on a
video monitor, or a three-dimensional projection can
be
viewed with a headset.
Digitizers
A
common device for drawing, painting, or interactively selecting coordinate
po-
sitions on
an
object
is
a digitizer.
These
devices can
be
used to input coordinate
values
in
either a two-dimensional or a three-dimensional space. Typically, a dig-
itizer
is
used
to
scan
over a drawing
or
object and to input a set of discrete coor-
dinate positions, which can
be
joined with straight-Iine segments to approximate
the curve or surface shapes.
One
type
of digitizer
is
the graphics tablet (also referred to as a data tablet),
which
is
used
to input two-dimensional coordinates by activating a hand cursor
or
stylus at selected positions on a flat surface.
A
hand cursor contains cross hairs
for sighting positions, while a stylus
is
a
pencil-shaped
device that
is
pointed at
Section
2-5
Input
Dwices
. .
.
-
- -
-
-
-
.
Figure
2-45
A
virtual-reality
xene,
displayed
on
a
two-dimensional video
monitor, with input from
a
data
glove ad
a
spa;eball.
(Courfesy ofne
Compufrr Graphics Cmfer, Dnrmsfadf,
positions on the tablet. Figures
2-46
and
2-47
show examples .of desktop and
floor-model tablets, using hsnd
CUTSOTS
that are available wiih
2,4,
or
16
buttons.
Examples of stylus input with a tablet am shown
in
Figs.
2-48
and
2-49.
The
artist's digitizing system in Fig.
249
uses electromagnetic resonance to detect the
three-dimensional position of the stylus. This allows an artist to produce different
brush strokes with different pressures on the tablet surface. Tablet size varies
from
12
by
12
inches for desktop models to
44
by
60
inches or larger for floor
models. Graphics tablets provide a highly accurate method for selecting
coordi-
nate positions, with an accuracy that varies from about
0.2
mm on desktop mod-
els to about
0.05
mm
or less on larger models.
Many graphics tablets are constructed with a rectangular grid of wires
em-
bedded in the tablet surface. Electromagnetic pulses are aenerated
in
sequence
Figure
2-46
The
Summasketch
111
desktop
tablet
with
a
16-button
hand cursor.
(Courtesy of Surnmgraphin Corporalion.)