Lập trình đồ họa trong C (phần 9) pot
Bạn đang xem bản rút gọn của tài liệu. Xem và tải ngay bản đầy đủ của tài liệu tại đây (1.26 MB, 50 trang )
Section
10-9
B-Spline
Curves
and
Surfaces
(70-60)
This matrix can be obtained by solving for the coefficients in a general cubic
polynomial expression using the specified four boundary conditions.
We can also modify the B-spline equations to include a tension parameter
t
(as in cardinal splines). The periodic, cubic B-spline with tension matrix then has
the form
which reduces to
MB
when
t
=
1.
We obtain the periodic, cubic B-spline blending functions over the parame-
ter range from
0
to
1
by expanding the matrix representation into polynomial
form. For example, for the tension value
t
=
1,
we have
Open
Uniform
B-Splines
This class of B-splines is a cross between uniform B-splines and nonuniform
B-
splines. Sometimes it is treated as a special type of uniform 8-spline, and some-
times it is considered to be in the nonuniform B-spline classification. For the
open uniform B-splines, or simply open B-splines, the knot spacing is uniform
except at the ends where knot values are repeated
d
times.
Following are two examples of open uniform, integer knot vectors, each
with a starting value of
0:
We can normalize these knot vectors to the unit interval from
0
to
1:
10,0,0.33,0.67,1,
1,);
for
o'
=
2
and
11
=
3
l0,0,0,0,0.5,1,1,1,1t,
ford=4andn=4
Chapter
10
Three-D~mensional Object
Represemat~onr
For any values of paranreters
d
and
n,
we can generate an open uniform knot
vector with integer valucs using the calculations
forOSj<d
1,
fordsjSri
(IO-(I
;)
nd+2,
forj>n
for values of] ranging from
0
to
n
+
d.
With this assignment, the first d knots are
assigned the value
0,
and the last
d
knots have the value
n
-
d
+
2.
Open uniform B-splines have characteristics that are very similar to Bezier
splines. In fact, when
d
=
tr
+
1
(degree of the polynomial 1s
n)
open B-splines re-
duce to Bezier splines, and all knot valucs are either
O
or
1.
For example, with
a
cubic, open B-spline
(d
=
4)
and four control points, the knot vector
is
The polynomial curve ior an open B-spline passes through the iirst and last con-
trol points. Also, the slope of the parametric curves at the first control point is
parallel to the line connecting the first two control points. And the parametric
slope at the last control point is parallel to the line connecting the last two control
points.
So
geometric constraints for matching curve sections are the same as for
Kzier curves.
As with Bbzier cuncs, specifying multiple control points
at
the
same coor-
dinate position pulls ans B-spline curve cioser to that position. Since open B-
splines start at the first control point and end at the last specified control point,
closed curves are generated
by
specifyng the first and last control points at the
same position.
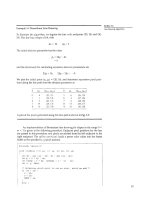
Example
10-2
Open Uniform, Quadratic B-Splines
From conditions
10-63
with
11
=
3
and
ir
=
1
(five control points), we obtain the
following eight values for the knot vector:
The total rangeof
u
is divided into seven subintervals, and each of the five blend-
ing functions
BkJ
is defined over three subintervals, starting at knot position
11,.
Thus, is defined from
u,
=
0
to
11,
=
1,
R,,
is
defined from
u,
=
0
to
u4
=
2,
and
Big
is defined from
14,
=
2
to
u7
=
3.
Explicit polynomial expressions zre
ob-
tained for the blending functions from recurrence relations 10-55 as
Figure
10-45
shows the shape of the these five blending functions. The local fea-
tures of B-splines are again demonstrated. Blending function
Bo,,
is nonzero only
in the subinterval from
0
to
I,
so the first control point influences the curve only
in this interval. Similarly, function
BdZ3
is
zero outside the interval from
2
to
3,
and
the position of the last control point does not affect the shape
3f
the begrnning
and middle parts of the curve.
Matrix formulations for open B-splines are not as conveniently generated as
they are for periodic, uniform B-splines. This is due to the multiplicity of knot
values at the beginning and end of the knot vector.
For this class of splines, we can specify any values and intervals for the knot vec-
tor. With nonuniform B-splines, we can choose multiple internal knot values and
unequal spacing between the knot values. Some examples are
Nonuniform B-splines provide increased flexibility in controlling a curve
shape. With unequally spaced intervals in the knot vector, we obtain different
shapes for the blending functions in different intervals, which can be used to ad-
just spline shapes. By increasing knot multiplicity, we produce subtle variations
in curve shape and even introduce discontinuities. Multiple knot values also re
duce the continuity by 1 for each repeat of a particular value.
We obtain the blending functions for a nonuniform B-spline using methods
similar
to
those discussed for uniform and open B-splines. Given a set of
n
+
I
control points, we set the degree of the polynomial and select the knot values.
Then, using the recurrence relations, we could either obtain the
set
of
blending
functions or evaluate curve positions directly for the display of the curve. Graph-
ics packages often restrict the knot intervals to
be
either
0
or
1
to reduce compu-
tations.
A
set of characteristic matrices then can
be
stored and used to compute
Section
10-9
8-Splme
Curves
and
Surfaces
la)
(bl
id)
Figzrrr
10-45
Opn, uniform 6-spline blending functions for
n
=
4
and
d
=
3
values along the spline curve without evaluatmg the recurrence relations for each
curve point to be plotted.
6 Spline
Surfaces
Formulation of a B-spline surface is similar to that for B6zier splines. We can ob-
tain a vector point function over a B-spline surface using the Cartesian product of
B-spline blending functions
in
the
form
Section
10-10
-
-
Figure
10-46
A
prototype helicopter, designed and modeled by
Daniel Langlois of
SOFTUIAGE,
Inc., Montreal,
using
180,000
Bspline surface patches. The scene
was then rendered using ray tracing, bump
mapping, and reflection mapping.
(Coudesy
silicon
Graphics,
Inc.)
Beta-Splines
whew the vector values for
P~,,~,
specify positions of the
(n,
+
I)
by (n2
+
1)
con-
trol points.
B-spline surfaces exhibit the same properties as those of their component
B-
spline curves.
A
surface can
be
constructed from selected values for parameters
d,
and
d,
(which determine the polynomial degrees to
be
used)
and from the
specified knot vector. Figure 10-46 shows an object modeled with 8-spline sur-
faces.
10-10
BETA-SPLINES
A
generalization of Bsplines are the beta-splines, also referred to as psplines,
that are formulated by imposing geometric continuity conditions on the first and
second ,parametic derivatives. The continuity parameters for beta-splines are
called
/3
parameters.
Beta-Spline Continuity Conditions
For
a
specified knot vector, we can designate the spline sections to the left and
right of
a
particular knot
ui
with the position vectors
P,-,(u)
and
PJu)
(Fig.
10-47).
Zero-order continuity (positional continuity),
Go,
at
u,
is obtained by requiring
~osition vectors along curve
First-order continuity (unit
tangent
continuity), G1, is obtained by requiring
sections
to
the
left
right
tangent vectors to
be
proportional:
of knot
u,.
345
Chapter
10
DIP;-
~(u:)
=
P;(u,),
PI
>
0
(10-hb)
Three-Dimensronal
Objcc!
Representaliom
Here, parametric first derivatives are proportional, and the unit tangent vectors
are continuous across the knot.
Second-order continuity
(cumture vector continuity),
G2,
is
imposed with the
condition
where
6
can be assigned any
real
number, and
pl
>
0.
The curvature vector pro-
vides a measure of the amount of bending of the curve at position
u,.
When
Pi
=
1
and
&
=
0,
beta-splines reduce to B-splines.
Parameter
is called the
bins parameter
since it controls the skewness of the
curde. For
PI
>
1,
the curve tends to flatten to the right in the direction of the unlt
tangent vector at the knots. For
0
<
p,
<
1,
the curve tends to flatten to the left.
The effect of
0,
on the shape of the spline curve is shown in Fig.
10-48.
Parameter
is called the
tension parameter
since it controls how tightly or
loosely the spline fits the control graph. As
/3,
increases, the curve approaches the
shape of the control graph, as shown in Fig.
10-49.
Cubic, Period~c Beta-Spline Matrix Representation
Applying the beta-spline boundary conditions to a cubic polynomial with a uni-
form knot vector, we obtain the tollowing matrix representation for a periodic
beta-spline:
-
Fiprt
10-48
Effect of parameter
/3,
on the shape of a beta-spline curve.
.
-
Figrrrr
10-49
Effect of parameter
&
on
the shape of
a
beta-spline curve.
-2&
2(P2
+
P:
+
P:
+
PJ
-2(P2
+
P:
+
PI
+
1)
Section
10-1
1
3(&
+
2P:)
Rational
Splmes
6(P?
-
P:)
681
where
S
=
p2
+
2fi:
+
4lj:
+ 401
+
2.
We
obtain the B-spline matrix
M,
when
/3,
=
1
and
=
0.
And we get the
8-spline with tension matrix MB,when
10-1
1
RATIONAL SPLINES
A rational function is simply the ratio of two polynomials. Thus, a rational
spline is the ratio of two spline functions. For example a rational B-spline curve
can
be
described with the position vector:
where the pk are a set of n
+
1
control-point positions. Parameters
q
are weight
factors for the control points. The greater the value of a particular
o,,
the closer
the curve 1s pulled toward the control point
pk
weighted by that parameter.
When all weight factors are set to the value
1,
we have the standard 8-spline
curve since the denominator in
Eq.
10-69
is
1
(the sum of the blending functions).
Rational splines have two important advantages compared to nonrational
splines. First, they provide an exact representation for quadric curves (conics),
such as circles and ellipses. Nonrational splines, which are polynomials, can only
approximate conics. This allows graphics packages to model all curve shapes
with one representation-rational splines-without needing a library of curve
functions to handle different design shapes. Another advantage of rational
splines
is
that they are invariant with respect to a perspective viewing transfor-
mation (Section
12-3).
This means that we can apply a perspective viewing trans-
formation to the control points of the rational curve, and we will obtain the cor-
rect view of the curve. Nonrational splines, on the other hand, are not invariant
with respect to a perspective viewing
transformation.
Typically, graphics design
packages usc nonuniform knot-vector representations for constructing rational
B-
splines. These splines are referred to as NURBs (nonuniform rational B-splines).
Homogeneous coordinate representations are used for rational splines,
since the denominator can be treated as the homogeneous factor in a four-dimen-
sional representation of the control points. Thus,
a
rational spline can be thought
of as the projection of a four-dimensional nonrational spline into three-dimen-
sional space.
Constructing a rational 8-spline representation is carried out with the same
procedures for constructing a nonrational representation. Given the set of control
points, the degree of the polynomial, the weighting factors, and the knot vector,
we apply the recurrence relations to obtain the blending functions.
-
Chapter
10
To plot conic sections with NURBs,
we
use a quadratic spline function
(d
=
Three-Dlmensional
Object
3)
and three control
points.
We can do this with a B-spline function defined with
Representat~ons
the open knot vector:
which is the same as a quadratic Bezier spline. We then set the weighting func-
tions to the following values:
and the rational B-spline representation is
We then obtain the various conics
(Fig.
10-50) with the following values for para-
meter
r:
r
>
1/2,
w,
>
1
(hyperbola section)
r
=
1
/2,
o,
=
1 (parabola section)
r
<
1
/2,
o,
<
1 (ellipse section)
r
=
0,
w,
=
0
(straight-line segment)
We can generate a one-quarter arc of a unit circle in the first quadrant
of
the
xy
plane
(Fig.
10-51) by setting
w,
=
cosdand
by
choosing the control pints
as
Figure
70-50
Conic sections
generated with
various values of
the
r.1tional-spline
wei5hting factor
w,.
I
p2=
(1,
O)
of
the
xy
plane.
Other sections of
a
unit circle can be obtained with different control-point posi-
tions. A complete circle can be generated using geometric transformation in the
xy
plane. For example, we can reflect the one-quarter circular arc about the
x
and
y
axes to produce the circular arcs in the other three quadrants.
In some CAD systems, we construct a conic section by specifying three
points on an arc. A rational homogeneous-coordinate spline representation is
then determined by computing control-point positions that wouId generate the
selected conic type. As an example, a homogeneous representation for a unit cir-
cular arc in the first quadran
I[
of the
xy
plane-is
10-1
2
CONVERSION
BETWEEN
SPLINE REPRESENTATIONS
Sometimes it is desirable to
be
able to switch from one spline representation
10
another.
For
instance, a Bezier representation is the most convenient one for sub-
dividing a spline curve, while a B-spline representation offers greater design flex-
ibility.
So
we might design a curve using B-spline sections, then we can convert
to an equivalent Bezier representation to display the object using a recursive sub-
d~vision procedure to locate coordinate positions along the curve.
Suppose we have a spline description of an object that can be expressed
with the following matrix product:
where
M,,l,,el
is
the matrix characterizing the spline representation, and
M,,,,
1s
the
column matrix of geometric constraints (for example, control-point coordi-
nates). To transform to a second representation with spline matrix
MrpllnrZ,
we
need to determme the geometric constraint matrix
Mgwm2
that produces the same
vector point function for the object. That is,
Three-D~mens~onal
Object
Or
Representations
Solving for
MRPOm2,
we have
and the required transformation matrix that converts from the first spline repre-
sentation to the second is then calculated as
A
nonuniform B-spline cannot be characterized ivith a general splme ma-
trix.
But
we
can rearrange
the
knot
5equence to change
the
nonuniform B-spline
to a Bezier representation. Then the Bezier matrix could be converted to any
other form.
The following example calculates the transformation matrix tor
conversion
from
a
periodic, cubic B-spline representation to
a
cub~c, Bezier spline representa-
tion.
And
the the hansformaticm matrix for converting from a cubic Bezier representa-
tion to
a
periodic, cubic B-spline representation
is
10-13
Section
10-13
DISPLAYING SPLINE CURVES
AND
SURFACES
[lisplaying Spline
Curves
and
Surfaces
To display a spline curve or surface, we must determine coordinate positions on
the curve or surface that project to pixel positions on the display device. This
means that we must evaluate the parametric polynomial spline functions in cer-
tain increments over the range of the functions. There are several methods we
can use to calculate positions over the range of a spline curve or surface.
Horner's Rule
The simplest method for evaluating
a
polynomial, other than a brute-force calcu-
lation of each term in succession, is
Horner's rule,
which performs the calculations
by successive factoring. This requires one multiplication and one addition at each
step. For a polynomial of degree
n,
there are
n
steps.
As an example, suppose we have a cubic spline representation where coor-
dinate positions are expressed as
with similar expressions for they and
z
coordinates. For a particular value of pa-
rameter
u,
we evaluate this polynomial in the following factored order:
The calculation of each x value requires three multiplications and three additions,
so that the determination of each coordinate position (x,
y,
2)
along a cubic spline
curve requires nine multiplications and nine additions.
Additional factoring tricks can be applied to reduce the number of compu-
tations required
by
Homer's method, especially for higher-order polynomials
(degree greater than
3).
But repeated determination of coordinate positions over
the range of a spline function can be computed much faster using forward-differ-
ence calculations or splinesubdivision methods.
Forward-Difference Calculations
A fast method for evaluating polynomial functions is to generate successive val-
ues recursively by incrementing previously calculatd values as, for example,
Thus, once we know the increment and the value of xk at any step, we get the
next value by adding the increment to the value at that step. The increment Axk at
each step is called the
forward difference.
If
we divide the total range of
u
into
subintervals of fixed size
6,
then two successive
x
positions occur at x,
=
x(uk)
and xk+,
=
x(u~+,),
where
and
uo
=
0.
Chapter
10
To illustrate the method, suppose we have the lineiir spline representation
Three-D~mensional
Object
x(u)
=
n,,u
+
h,.
TWO surc15sive x-coordinate positions are represented
as
Reprcrentationr
Subtracting the two equations, we obtain the forward difference:
Axk
=
a,&
In
this case, the forward difference is a constant. With higher-order polynomials, the
forward difference is itself a polynomial function of parameter
u
with degree one
less than the original pol\:nomial.
For the cubic spline representation in
Eq.
10-78, two successive x-coordinate
positions have the polynomial representations
The forward difference now evaluates to
which is a quadratic function of parameter
uk.
Since
AxL
is a polynomial function
jf
11,
we can use the same incremental procedure to obtain successive values of
Ax,.
That is,
where the second forward difference
IS
the linear function
Repeating this process once more, we can write
with the third forward ditference
as
the constant
Equations 10-80, 10-85, 111-87, and 10-88 provide an
incremental
forward-differ-
ence calculation of point5 along the cubic curve. Starting at
u,
=
0 with a step size
6,
we obtain the initial values for the
x
coordinate and its iirst two forward differ-
ences as
xo=
d,
Ax,
=
n,63
+
bra2
+
c,6
A2x,,
=
6n,S3
+
2b,tj2
Once these initial values have been computed, the calculation for each successive
r-coordinate position requires onlv three additions.
We can apply forward-difference methods to determine positions along
w.bn10-13
spline curves of any degree
n.
Each successive coordinate position
(x,
y,
z)
is
Displaying Spline
Curves
and
evaluated with a
series
of
3n
additions. For surfaces, the incremental calculations
Surfaces
are applied to both parameter
u
and parameter
v.
Subdivision
Methods
Recursive spline-subdivision procedures are
used
to repeatedly divide a given
curve section
in
half, increasing the number of control points at each step. Subdi-
vision methods are useful for displaying approximation spline curves since we
can continue the subdivision process until the control graph approximates the
curve path. Control-point coordinates then can be plotted as curve positions. An-
other application of subdivision is to generate more control points for shaping
the curve. Thus, we could design a general curve shape with a few control points,
then we could apply a subdivision procedure to obtain additional control points.
With the added control pants, we can make fine adjustments to small sections of
the curve.
Spline subdivision is most easily applied to a Bezier curve section because
the curve passes through the first and last control points, the range of parameter
u
is always between 0 and
1,
and it is easy to determine when the control points
are "near enough to the curve path. Ezier subdivision can
be
applied to other
spline representations with the following sequence of operations:
1.
Convert the spline representation in use to a Bezier representation.
2.
Apply the Ezier subdivision algorithm.
3.
Convert the Kzier representation back to the original spline representation.
Figure 10-52 shows the first step in a recursive subdivision of a cubic Bezier
curve section. Positions along the Bbzier curve are described with the parametric
point function P(u) for 0
5
u
5
1.
At the first subdivision step, we use the
halfway point P(0.5) to divide the original curve into two sections. The first sec-
tion is ihen described
with Pz(t), where
with the point ?unction P,(s), and the section is described
s
=
2u.
for 0
5
u
5
0.5
1~2~-I, for0.55ucI
Each of the two new curve sections has the same number of control points as the
original curve section. Also, the boundary conditions (position and parametric
Before
Subdivision
Aher
Subdivision
Fiprc
10-52
Subdividing
a cubic
Bezier
curve
section
into
two
sections, each
with
four
control points.
Chapter
10
Three-Dimensional
0bjw1
Representations
slope) at the two ends
of
each new curve section must match the position and
slope values for the original curve
PW.
This gves us four conditions for each
curve
section that we can
use
to determine the control-point positions. For the
first half of the curve, the four new control points are
And for the second half
of
the curve,
we
obtain the four control points
An efficient order
for
con~yuting the new control points can
be
set
up
with only
add and shift (division
by
2)
operations
as
These steps can
be
repeated any number of times, depenaing on whether
Section
10-14
we are subdividing the curve to gain more control points
or
whether we are try-
Sweep
Representat~ons
ing to locate approximate curve positions. When we are subdividing to obtain a
set of display points, we can terminate the subdivision procedure when the curve
sections are small enough. One way to determine this is to check the distances
between adjacent pairs
of
control points for each section. If these distances are
"sufficiently" small, we can stop subdividing. Or we could stop subdividing
when the set of control points for each section is nearly along a straight-line
path.
Subdivision methods can
be
applied to Bezier curves of any degree. For a
Bezier polynomial of degree
n
-
1,
the
2n
control points for each half of the curve
at the first subdivision step are
where
C(k,
i)
and
C(n
-
k,
n
-
i)
are the binomial coefficients.
We can apply subdivision methods directly to nonuruform Bsplines by
adding values to the knot vector. But, in general, these methods are not as effi-
cient as B6zier subdivision.
10-1
4
SWEEP REPRESENTATIONS
Solid-modeling packages often provide a number of construction techniques.
Sweep representations are useful for constructing three-dimensional obpcts that
possess translational, rotational, or other symmetries. We can represent such ob-
jects by specifying a twodimensional shape and a sweep that moves the shape
through a region of space.
A
set of two-dimensional primitives, such as circles
and rectangles, can
be
provided for sweep representations as menu options.
Other methods for obtaining two-dimensional
figures
include closed spline-
curve constructions and cross-sectional slices of solid objects.
Figure 10-53 illustrates a translational sweep. The periodic spline curve in
Fig. 10-53(a) defines the object cross section. We then perform a translational
Figurr
10-53
Constructing a solid with a translational sweep. Translating the
control points of the
periodic
spline curve
in
(a) generates the solid
shown in
(b),
whose surface can
be
described
with pqint function
PW).
Figun
10-54
Constructing a solid with a
rotational sweep Rotating the
control points of the periodic spline
curve in
(a)
about the given rotation
axis generates
the
sohd shown in
(b),
whose
surface
can be
described
with pomt function
P(u,v).
sweep by moving the control points
p,
through
p3
a set distance along a straight-
line path perpendicular to the plane of the cross section. At intervals along this
we replicate the cross-sectional shape and draw a set of connecting lines in
the direction of the sweep to obtain the wireframe representation shown in Fig.
10-53(b).
An example of object design using a rotational sweep is given in Fig. 10-54.
This time, the periodic spline cross section is rotated about an axis of rotation
specified in the plane of the cross section to produce the wireframe representa-
tion shown
in
F&.
10-54(b). Any axis can
be
chosen for a rotational sweep.
If
we
use a rotation axis perpendicular to the plane of the spline cross section in Fig.
10-54(a), we generate
a
two-dimensional shape. But if the cross section shown in
this figure has depth, then we are using one three-dimensional object to generate
another.
In general, we
can
specify sweep constructions using any path. For rota-
tional sweeps, we can move along a circular path through any angular disfance
from 0 to
360'.
For noncircular paths, we can specify the curve function describ-
ing the path and the distance of travel along the path. In addition, we can vary
the shape or size of the cross section along the sweep path.
Or
we could vary the
orientation of the cross section relative to the sweep path as we move the shape
through a region of space.
10-15
CONSTRUCTIVE SOI-ID-GEOMETRY METtIODS
Another technique for solid modeling is to combine the vdumes occupied by
overlapping three-dimensional objects using set operations. This modeling
method, called constructive solid geometry
(CSG),
creates a new volume by ap-
plying the unlon, intersection, or difference operation to two specified volumes.
Figures 10-55 and 10-56 show examples for forming new shapes using the
set operations. In Fig. 10-55(a), a bIock and pyramid are placed adjacent to each
other. Specifying the union operation, we obtain the combined object shown
in
Fig. 10-55(b). Figure 10-%(a) shows a block and a cylinder with overlapping vol-
umes. Using the intersection operation, we obtain the resulting solid
in
Fig. 10-
%(b).
With a difference operation, we can get the solid shown in Fig. 10-%(c).
A
CSG
application-starts with an ktial set of three-dirne&nal objects
(primitives), such as blocks, pyramids, cylinders, cones, spheres, and closed
spline surfaces. The primitives can,be provided by the
CSG package as menu se-
lections, or the primitives themselves could
be
formed using sweep methods,
spline constructions, or other modeling procedures. To create a new three-dimen-
sional shape using
CSG
methods, we-first select two primitives and drag them
into position in some region of space. Then we select an operation (union, inter-
section, or difference) for cornbig the volumes of the two primitives. Now we
have a new object, in addition to the primitives, that we can use to form other ob-
jects. We continue to construct new shapes, using combinations of primitives and
the objects created at each step, until
we
have the final shape. An object designed
with this procedure is represented with a binary
tree.
An example tree represen-
tation for a
CSG
object is given in Fig. 10-57.
Ray-casting methods are commonly used to implement constructive solid-
geometry operations when objects are described with boundary representations.
we apply
ray
casting by constructing composite objects in world ckrdinates
with the
xy
plane corresponding to the pixeI plane of a video monitor. This plane
is
then referred to as the "firing plane" since we fire a ray from each pixel posi-
tion through the objects that are to be combined (Fig. 10-58). We then determine
surface intersections along each ray path, and sort the intersection points accord-
ing to the distance from the firing The surface limits for the composite ob-
ject are then determined by the specified set operation. An example of the ray-
casting determination of surface limits for a
CSG
object is given in Fig. 10-59,
which shows
yt
cross sections of two primitives and the path of a pixel ray per-
pendicular to the firing plane. For the union operation, the new volume is the
combined interior regions occupied bv either or both primitives. For the intersec-
tion operation, the new volume is the-interior region common to both primitives.
.
.
.
-
.
-
-
- -
. .
I'i~~lrc
10-56
(a)
Two overlapping objects.
(b)
A wedge-shaped
CSG
object
formed with the intersection operat~on.
(c)
A
CSG
object
formed with
a
difference operation by subtracting the
Section
10-1
5
Construcrive Solid-Geometry
Methods
la)
(b)
Figure
10-55
Combining two objects
(a) with a union operation
produces a single, composite
solid object (b).
overlapping volume of the-cylinder
from
the block volume
Object
(
csG
)
-
-
Figure
10-57
A
CSG
tree representation for an
object.
Operation
'
Surface Limits
Union
I
A,
D
Intersection
c.
0
Difference
8.
D
(obi,
-
obi,)
;
i
Figirrc
10-58
Figure
10-59
Implementing
CSG
Determining surface limits along a pixel ray.
operations using ray casting.
And a difference operation subtracts the volume of one primitive from the other.
Each primitive can
be
defined in its own local (modeling) coordinates.
Then, a composite shape can be formed by specifying the rnodeling-transforma-
Firing
tion matrices that would place two in an overlapping position in
world coordinates. The inverse of these modeling matrices can then be used to
transform the pixel rays to modeling coordinates, where the surface-intersection
calculations are carried out for the individual primitives. Then surface intersec-
tions for the two objects are sorted and used to determine the composite object
Pla
limits according to the specified set operation. This procedure is Apeated for
each pair of objects that are to be combined in the
CSG
tree for a particular object.
Once a
CSG
object has been designed, ray casting is used to determine
,
physical properties, such as volume and mass. To determine the volume of the
object, we can divide the firing plane into any number of small squares, as shown
in Fig.
10-60.
We can then approximate the volume
V.,
of the object for a cross-
sectional slice with area
A,,
along the path of
a
ray from the square
at
position
(i,
fi,yur-r
10-60
j)
as
Determining object volume
along
a
ray path for a small
V,,
-
A,j
hz,,
11
0-953
area
A,,
on the firing plane.
where
Az,,
is the depth of the object along the ray from position
(i,
j).
If
the object
has internal holes,
Az;,
is the sum of the distances between pairs of intersection
358
points along the ray. The total volume of the
CSG
object is then calculated as
(J
11-96)
Section
10-16
Ocrrees
Given the density function,
p(x,
y,
z),
for the object, we can approximate the
mass along the ray from position
(i,
j)
as
where the one-dimensional integral can often be approximated without actually
carrying out the integration, depending on the form of the density function. The
total mass of the CSG object is then approximated as
Other physical properties, such as center of mass and moment of inertia, can be
obtained with similar calculations. We can improve the approximate calculations
for the values of the physical properties by taking finer subdwisions in the firing
plane.
If
object shapes are reprewllled with octrees, we can implement the set op-
erations in
CSG
procedures by scanning the tree structure describing the contents
of spatial octants. This procedure, described in the following section, searches the
octants and suboctants of
a
unit cube to locate the regions occupied by the two
objects that are to
be
combined.
10-16
OCTREES
Hierarchical tree structures, called
octrees,
are used to represent solid objects in
some graphics systems. Medical imaging and other applications that require dis-
plays of object cross sections commonly use
octree
representations. The tree
structure
is
organized so that each node corresponds to a region of three-dimen-
sional space. This representation for solids takes advantage of spatial coherence
to reduce storage requirements for three-dimensional objects. It also provides a
convenient representation for storing information about object interiors.
The octree encoding procedure for a three-dimensional space is an exten-
sion of an encoding scheme for two-dimensional space, called quadtree encod-
ing. Quadtrees are generated by successively dividing a two-dimensional region
(usually
a
square) into quadrants. Each node in the quadtree has four data ele-
ments, one for each of the quadrants
in
the region (Fig.
10-61).
If
all pixels within
a quadrant have the same color (a homogeneous quadrant), the corresponding
data element in the node stores that color. In addition, a flag is set in the data ele-
ment to indicate that the quadrant is homogeneous. Suppose all pixels in quad-
rant
2
of Fig.
10-61
are found to
be
red. The color code for red is then placed in
data element
2
of the node. Otherwise, the quadrant is said to be heterogeneous,
and that quadrant is itself divided into quadrants (Fig.
10-62).
The corresponding
data element in the node now flags the quadrant as heterogeneous and stores the
pointer to the next node in thequadtree.
An algorithm for generating a quadtree tests pixel-intensity values and sets
up the quadtree nodes accordingly.
If
each quadrant in the original space has a
Chapter
10
Three-D~niensional Object
Quadranl
Quadrant
I
Quadran
1
Qua:ral
1
Data
Elements
3
in
the
Representative
Ouadtree
Node
Region
of
a
Two-Dmensional
Space
F@rc
70-6
1
Region of
a
two-dimensional space divided intu numbered
quadrants and the associated quadtree node with four
data elements.
single color specification, the quadtree has only one node. For a heterogeneous
region of space, the suc.cessive subdivisions into quadrants continues until all
quadrants are homogeneous. Figure
10-63
shows a quadtree representation for
a
region containing one area with a solid color that is different from the uniform
color specified for all other areas in the region.
Quadtree encodings prowde considerable savings in storage when large
color areas exist in a region of space, since each single-color area can
be
repre-
sented with one node. For an area containing
2''
by
2"
pixels, a quadtree repre
sentation contains at n~c~st
11
levels. Each node in the quadtree has at most four
immediate descendants
An octree encoding scheme divides regions
of
three-dimensional space
(usually cubes) into octants and stores eight data elements in each node of the
tree (Fig.
10-64).
Individual elements of a three-dimensional space are called
vol-
ume elements,
or
voxels.
When all voxels in an octant are of the same type, this
Reg~on
ol
a
Two-Dimensional
Space
Quadtree
Representation
-
-
.
-
.
-,
.
-
.
.
-
- -
-
-
- -
. .
-
-
Fisrris.
10-62
Region of
a
two-d~mensional space with two levels ot quadrant
divisions and the .issociated quadtree representation
Figure
10-63
Quadtree representation for a region containing one foreground-color
pixel on a solid background.
type value is stored in the corresponding data element of the node. Empty re-
gions of space are represented by voxel
type
"void." Any heterogeneous octant is
subdivided into octants, and the corresponding data element in the node points
to the next node in the octree. Procedures for generating octrees are similar to
those for quadtrees: Voxels in each octant are tested, and octant subdivisions con-
tinue until the region of space contains only homogeneous octants. Each node in
the octree can now have from zero to eight immediate descendants.
Algorithms for generating octrees can be structured to accept definitions of
objects in any form, such as a polygon mesh, curved surface patches, or solid-
geometry constructions. Using the minimum and maximum coordinate values of
the object, we can define a box (parallelepiped) around the object. This region of
three-dimensional space containing the object is then tested, octant by octant, to
generate the
o&ee
representation.
Once an octree representation has been established for
a
solid object, vari-
ous manipulation routines
can
be
applied to the solid. An algorithm
for
perform-
ing set operations can
be
applied to two octree representations for the same re-
gion of space. For a union operation,
a
new octree is wnstrncted with the
combined regions for each of the input objects. Similarly, intersection or differ-
Region
of
a
Three-Dimensional
Space
Data Elements
in
the Representative
Octree Node
Section
10-16
Ocrrees
Figure
10-64
Region of a three-dimensional space divided mto numbered
octants and the associated octree node with eight data elements
Chapter
10
ence operations are perfonned by looking for regions of overlap in the two oc-
Three-Dimensional Object
trees. The new octree is then formed by either storing the octants where the two
Reprerentat'ons
objects overlap or the region occupied by one object but not the other.
Three-dimensonal octree rotations are accomplished by applying the trans-
formations to the occupied octants. Visible-surface identification is carried out by
searching the octants from front to back. The first object detected is visible, so
that info-mation can
be
transferred to a quadtree representation for display.
10-17
BSP
TREES
This representation scheme is similar to
octree
encoding, except
we
now divide
space into two partitions instead of eight at each step. With a binary space-parti-
tioning
(BSP)
tree,
we subdivide a scene into two sections at each step with a
plane that can be at any position and orientation. In an octree encoding, the scene
is subdivided at each step with three mutually perpendicular planes aligned with
the Cartesian coordinate planes.
For adaptive subdivision of space,
BSP
trees can provide a more efficient
partitioning since we can position and orient the cutting planes to suit the spatial
distribution of the objects. This can reduce the depth of the tree representation for
a scene, compared to an octree, and thus reduce the time to search the tree. In ad-
dition,
BSP
trees are useful for identifying visible surfaces and for space parti-
tioning in ray-tracing algorithms.
10-1
8
FRACTAL-GEOMETRY METHODS
All
the object representations we have considered in the previous sections used
Euclidean-geometry methods; that is, object shapes were described with equa-
tions. These methods are adequate for describing manufactured objects: those
that have smooth surfaces and regular shapes. But natural objects, such as moun-
tains and clouds, have irregular or fragmented features, and Euclidean methods
do not realisticalIy model these objects. Natural objects can be realistically de-
scribed with fractal-geometry methods, where procedures rather than equations
are used to model objects. As we might expect, procedurally defined objects have
characteristics quite different from objects described with equations. Fractal-
geometry representations for objects are commonly applied in many fields to de-
scribe and explain the features of natural phenomena. In coinputer graphics, we
use
fractal methods to generate displays of natural objects and visualizations of
various mathematical and physical systems.
A
fractal object has two basic characteristics: infinite detail at every point
and a certai~.
self-similnrity
between the object parts and the overall features of the
object. The self-similarity properties of ,an object can take different forms, de-
pending on the choice of fractal representation.
We
describe a fractal object with
a
procedure that specifies
A
repeated operation for producing the detail
in
the ob-
ject subparts. Natural objects are represented with procedures that theoretically
repeat an infinite number of times. Graphics displays of natural objects are, of
course, generated witha
f
nite number of steps.
If
we zoom in on
.I
continuous Euclidean shape, no matter how compli-
cared, we can eventually get the zoomed-in view to smooth out.
But
if we zoom
Section
10-1
8
~ractalGeometr~ Methods
Distant
Mountain
Closer
View
Closer
Yet
Figure
10-65
The ragged appearance of a mountain outline at different levels of
magnification.
in on a fractal object, we continue to see as much detail in the magnification as
we did in the original view.
A
mountain outlined against the sky continues to
have the same jagged shape as we view it from a closer and closer position (Fig.
10-65).
As
we near the mountain, the smaller detail in the individual ledges and
boulders becomes apparent. Moving even closer, we
see
the outlines of rocks,
then stones, and then grains of sand. At each step, the outline reveals more twists
and turns.
If
we took the grains of sand and put them under a microscope, we
would again see the same detail repeated down through the molecular level.
Similar shapes describe coastlines and the edges ofplants and clouds.
Zooming in on a graphics display of a fractal object is obtained by selecting
a smaller window and repeating the fractal procedures to generate the detail in
the new window. A consequence of the infinite detail of a fractal object is that it
has no definite size. As we consider more and more detail, the size of an object
tends to infinity, but the coordinate extents of the object remain bound within
a
finite region of space.
We can describe the amount of variation in the object detail with a number
called the
fractal dimension.
Unlike the Euclidean dimension, this number is not
necessarily an integer. The fractal dimension of an object is sometimes referred to
as the
fractional dimension,
which is the basis for the name "fractal".
Fractal methods have proven useful for modeling a very wide variety of
natural phenomena. In graphics applications, fractal representations
are
used to
model terrain, clouds, water, trees and other plants, feathers, fur, and various
surface textures, and just to make pretty patterns. In other disciplines, fractal pat-
terns have been found in the distribution of stars, river islands, and moon craters;
in rain fields; in stock market variations; in music; in traffic flow; in urban prop-
erty utilization; and in the boundaries of convergence regions for numerical-
analysis techniques.
Fractal-Generation Procedures
A
fractal object is generated by repeatedly applying a specified transformation
function to points within a region of space. If
Po
=
(xO,
yo,
zo)
is a selected initial
point, each iteration of a transformation function
F
generates successive levels of
detail with the calculations
Chapter
10
In general, the transformation funct~on can be applied to a specified point
ThreeDimensional
Object
set, or we could apply the transformation function to an initial
sel
of primitives,
Represenrations
such as straight lines, curves, color areas, surfaces, and solid objects. Also, we can
use either deterministic or random generation procedures at each iteration. The
transformation function may
be
defined in terms of geometric transformations
(scaling, translation, rotation), or it can be set up with nonlinear coordinate trans-
formations and decision parameters.
Although fractal objects, by definition, contain infinite detail, we apply the
transformation function a finite number of times. Therefore, the objects we dis-
play actually have finite dimensions.
A
procedural representation approaches a
"true" fractal as the number of transformations is increased to produce more and
more detail. The amount of detail included in the final graphical display of an ob-
jed
depends on the number of iterations performed and the resolut~on of the dis-
play system We cannot display detail variations that are smaller than the size of
a pixel. To see more of the object detail, we zoom in on selected sections and
re-
peat the transformation function iterations.
Classification
01
Fractals
Self-similar fractals have parts that are scaled-down versions of the entire object.
Starting with an initial shape, we construct the object subparts by apply a scaling
parameter s to the overall shape. We can use the same scaling factors for all sub-
parts, or we can use different scaling factors for different scaled-down parts of
the object.
If
we also apply random variations to the scaled-down subparts, the
fractal is said to be statistically sey-similar. The parts then have the same statistical
properties. Statistically self-similar fractals are commonly used to model trees,
shrubs, and other plants.
Self-afSine fractals have parts that are formed with different scaling para-
meters,
s,,
sy,
s,,
in different coordinate directions. And we can also include ran-
dom variations to obtain statistically self-afine fractals. Terrain, water, and clouds
are typically ndelecl u.ith statistically self-affine fractal construction methods.
Invariant fractal sets are formed with nonlinear transformations. This class
of fractals includes selj-squaring fractals, such as the Mandelhrot set, which are
formed with squaring functions in complex space; and sclf-irrverse fractals,
formed with inversion procedures.
Fractal
Dimension
The detail variation in a fractal object can
be
described with a number
D,
called
the fractal dimension, which
is
a measure of the roughness, or fragmentation, of
the object. More jagged-looking objects have larger fractal dimensions. We can set
up some iterative procedures to generate fractal objects using a given value for
the fractal dimension
D.
With other procedures, we may be able to determine the
fractal dimension from the properties of the constructed object, although, in gen-
eral, the fractal dimension is difficult to calculate.
An expression for the fractal dimension of a self-similar fractal, constructed
with
a
single scalar factor
s,
is obtained by analogy with the subdivision of a Eu-
clidean object. Figure 10-66 shows the relationships between the scaling factor
r;
and the number of subparts n for subdivision of a unit straight-line segment,
A
square, and a
cube.
With
s
=
1
/2,
the unit line segment (Fig. 10-&(a)) is divided
into two equal-length subparts. Similarly, the square in Fig. 10-6Hb) is divided
into four equal-area subparts, and the cube (Fig. 10-66(c)) is divided into eight
equal-volume subparts. For each of these objects, the relationship between the
Fisprr
10-66
Subdividing objects with Euclidean dimensions
(a)
DE
=
I,
(b)
DC
=
2,
and
(c)
D,
=
3
using
scaling
factors
=
1
/2.
number of subparts and the scaling factor is
n
.
sDr
=
1.
In analogy with Euclid-
ean objects, the fractal dimension
D
for self-similar objects can be obtained from
Solving this expression for
D,
the fractal similarity dimension, we have
For a self-similar fractal constructed with different scaling factors for the different
parts, the fractal similarity dimension isobtained from the implicit relationship
where
sk
is
the scaling factor
for
subpart number
k.
In Fig.
10-66,
we considered subdivision of simple shapes (straight line, rec-
tangle, box).
If
we have morecomplicated shapes, including curved lines and ob-
jects with nonplanar surfaces, determining the structure and properties
of
the
subparts is more difficult. For general object shapes, we can use
topological
rover-
Section
10-1
8
Fraaal.Cmmetry Methods