Advances in Steel Structures - part 40 doc
Bạn đang xem bản rút gọn của tài liệu. Xem và tải ngay bản đầy đủ của tài liệu tại đây (858.83 KB, 10 trang )
370
(1'
k~c~g = s th~
~,Lj 60
J. Kesti and J.M. Davies
(8)
in which L is the critical length for distortional buckling or the distance between restraints which limit
rotation of the flange part of the section. The elastic stiffness term for the web is modified to take into
account the more flexible perforated part of the web. Thus the perforated part of the web is replaced
by a plate of equivalent thickness, tr, which has the same bending stiffness as the perforated web part.
For the particular perforation type used in this study, the equivalent thickness was determined by
means of the finite element method but, for simpler cases, this may be done by hand calculation. The
elastic stiffness term for the web with a different thickness, tr, in the middle part may be expressed as:
1
= (9)
kc~e 6(l o2 3- b~+ 2b2w bwb~ l l2(l v2 )( b2~ w + h~ j+ EtZr- 2h~ bwb~h~ lj
The critical half-wave length for distortional buckling may now be expressed as:
11
TM
)2 l~y(x ~
hx)2
Lcr = ~r Ixe (xo - h x +I,o- -
Iy
(10)
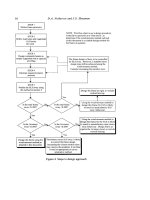
The manual calculation method for the distortional buckling of a C-section with reduced thickness in
part of the web was verified by comparing its predictions with values given by GBT. C-sections with
a height in the range 150 to 225 mm and a thickness in the range 1 to 2 mm were used for this
comparison. The flange width was 50 mm and stiffener width was 15 mm. The reduced thickness
value of 0.39t was used, corresponding to the studied perforation type. The mean ratio between the
calculated and GBT value of 0.96 and the standard deviation value of 0.04 demonstrate a good
performance for the proposed method.
Distortional buckling of the web-stiffened C-sections is much more complicated and is usually a
combination of distortional buckling of the edge and web-stiffeners and should be thus determined by
using the FSM or GBT.
DESIGN EXPRESSIONS
Current design recommendations do not include the design of perforated sections. In this study, the
perforations were considered by using an equivalent thickness for the perforated part when
determining the elastic local and distortional buckling stresses. In Eurocode 3, local buckling is taken
into account by using effective widths for plane elements and distortional buckling is taken into
account by reducing the thickness of the stiffeners. The reduction is based on the Eurocode column
design curve ao with ct = 0.13.
Schafer and Pek6z (1999) proposed a new design method for considering local and distortional
buckling in which local buckling and distortional buckling are seen as competitive buckling modes.
Either one of them may be chosen to represent the buckling mode for each plane element. In order to
properly integrate distortional buckling into the analysis, reduced post-buckling capacity in the
distortional mode and the ability of the distortional mode to control the failure mechanism, even when
Local and Distortional Buckling of Perforated Steel Wall Studs
371
at a higher buckling stress than the local buckling, must be considered. Schafer and Pekoz therefore
proposed a method where the critical buckling stress is defined for each plane element as:
Lr "-
min Lf cr,f ,
R d
f ~r,a ] ( 11 )
The
term
fcr, f
is local buckling stress based on a buckling coefficient value of k = 4.0 and
fcr, d
is the
distortional buckling stress. The reduction factor for the distortional buckling stress is as follows:
where
R d
= 1 when ,;ta < 0.673 (12a)
1.17
-~+0.3 when ,;ta> 0.673 (12b)
Rd- Ad+l
2d =4f/fcr,d "
Finally local and distortional buckling are considered using an effective width approach in which the
effective width of each plane element is determined using the well-known Winter reduction:
p=l
p=(1-0.22/2)/2
2=4f/fcr .
when 2<0.673 (13a)
when )1, > 0.673 (13b)
Schafer and Pek6z suggested that this reduction could be made for the entire member instead of each
element if the buckling stresses were determined numerically. The above approach was examined for
the strength capacity of laterally braced flexural members but, in this study, it has also been applied to
compression members.
COMPARISON OF TEST RESULTS AND PREDICTED VALUES
Results from the compression testing of both section types are available. Salmi (1998) carried out
some tests on perforated C- and web-stiffened C-sections. Kesti and Makel~iinen (1999) have also
conducted tests on perforated web-stiffened C-sections. The dimensional notations are shown in
Figure 3 and the measured dimensions, yield stresses and failure loads are given in Table 1 for web-
stiffened C-sections and in Table 2 for C-sections. The quoted metal thickness value is the core
thickness without the zinc layer. The TCJ- and TCS-Sections are from Salmi's test series.
Figure 3: Notations for section dimensions.
372
J. Kesti and J.M. Davies
TABLE 1
TEST DATA FOR WEB-STIFFENED C-SECTIONS
L h bl/b2 el/c2 el/e2 alia2 fl/f2 dl/d2 t Area Yield Failure
A Stress load
~[rnrn] [nun] [mm] [nun] [mm] [mm] [mm] [nun] [mm] [mm 2] [N/mm 2] [kN]
CC-1.2-W-1 800 173.7 49.8148.9116.2/16.4 22.8/24.8 9.3/9.2 22.4/22.4 13.1/10.7 1.15 301.3 386 64.4
CC-1.2-W-2 800 173.7 49.7/49.8 16.2/16.1 22.8/24.7 9.3/9.3 22.4/22.4 13.1/10.7 1.15 300.8 386 73.5
CC-1.5-W-1 800 174.1 49.9/50.2 16.2/16.8 23.6/22.9 8.8/8.3 23.3/22.5 10.0/10.9 1.47 377.2 380 96.2
CC-1.5-W-2 800 174.2 49.5/49.8 16.3/16.7 23.0/23.1 8.9/7.9 22.6/22.5 11.3/10.6 1.47 377.1 380 83.1
TCJ1
TCJ2
TCJ3
TCJ4
TCJ5
800 149.5 45.3/46.2 16.7/15.5 22.1/25.3 5.1/5.3 18.0/17.8 4.2/4.2 1.16 256.1 387 59.9
700 149.1 46.7/48.4 19.9/15.5 12.7/16.3 5.3/5.1 17.0/17.2 14.0/14.0 1.45 329.6 363 84.1
800 174.6 43.2/44.4 14.9/16.8 33.6/37.9 5.3/5.3 17.8/17.8 4.8/4.8 1.17 282.8 395 63.3
700 198.9 39.2/40.0 16.9/17.0 33.9/37.8 5.3/5.2 16.8/17.8 17.4/17.4 1.45 376.9 366 76.6
700 224.3 46.6/46.3 17.0/16.8 35.3/38.01 5.3/5.3 17.4/18.0 28.8/28.8 1.16 346.6 395 67.3
TCS1
TCS2
TCS3
TCS4
TCS5
TABLE 2
TEST DATA FOR C-SECTIONS
L h bl/b2
Cl/C2
[mm] [mm] [mm] [mm]
800 149.0 49.7/48.2 16.8/15.9
796 173.7 46.2/47.5 16.4/17.0
796 173.8 49.1/49.6 16.4/13.4
798 199.0 44.0/43.3 16.2/16.2
897 223.8 49.0/49.2 18.9/15.7
e t Area A Yield Failure
Stress load
[mm] [mm] [mm 2] [N/mm 2] [kN]
45.5 1.16 257.1 388 52.5
57.9 1.17 284.1 392 55.3
57.9 1.95 476.6 356 108.3
70.5 1.45 378.1 366 74.5
82.9 1.16 346.6 395 57.3
In the analysis of the C-sections, the local buckling stress of the perforated section was determined by
FEM in order to provide a more exact value for the effective width expressions. As mentioned above,
the analytical method for the determination of the local buckling stress is quite conservative if the web
is assumed to be simply supported without any contribution from the flanges. The effective width was
determined by reducing the area of the whole web,
t'hw.
Nevertheless, the effective width can be, at
most, the width of the entire web section. In the design of the web-stiffened section, the perforated
web part was ignored and the plate element between the perforated part and plain part was assumed to
be an unsupported element for the determination of the effective widths.
The elastic distortional buckling stresses for both the section types were determined using the
Generalized Beam Theory taking into account the actual column length and the fixed-ended boundary
conditions. The analysis was carded out using the computer program written by Davies and Jiang
(1995). Manual calculation methods would require that the column is sufficiently long for the end
boundary conditions to be insignificant. The perforated web part was replaced with an equivalent
thickness of 0.39t corresponding to the same bending stiffness. The web-stiffeners of the TCJ-sections
were relatively small and thus the web-stiffeners may buckle at a lower stress than the edge-stiffeners.
Thus, the distortional buckling stress was determined separately for the modes which included either
buckling of the web-stiffeners or edge-stiffeners.
The predicted values were determined using both the EC3 method and Schafer's method. A
comparison of the predicted and test values is given in Figure 4. The mean value for the capacity ratio
Ntest/Np is 1.02 according to the EC3 method and 1.09 according to Schafer's method. The standard
deviations are 0.08 and 0.11 respectively.
Local and Distortional Buckling of Perforated Steel Wall Studs
1,50
1,40
1,30
1,20
z" 1,1o
"~ 1,00
z 0,90
0,80
0,70
0,60
0,50
// ~\
"it
r \~,
"'- Schafer
-4- EC3 d
r w' 'r
c )
c-,4 c',4 ~ t.~
, ,._
r
c_) ~ r c,.)
Figure 4: Comparison of test results and predicted values
373
THE DESIGN OF STUDS OF FULL LENGTH WHICH ARE RESTRAINED BY SHEETING
This study is mainly concerned with the local and distortional buckling of perforated wall studs. These
buckling modes are taken into account in the design by using an effective area approach. Flexural
buckling modes should also be considered in the design of studs of full length. Minor axis buckling is
usually prevented by the sheeting connected to both flanges of the section. In any case, the screw
connections have limited shear stiffness and the flexural buckling stress about the minor axis of the
stud should be determined as the buckling stress of the compressed strut on an elastic foundation
(H6glund, 1998). The web perforations decrease the flexural buckling capacity about the strong axis
of the stud due to shear deformations. Allen (1969) presented a buckling load formula for sandwich
structures with thick faces when the bending stiffness of the faces is significant compared to that of the
whole structure. This sandwich theory was also applied to the perforated steel studs. The buckling
load can be expressed as
1~ Ne/ N# Nel
Ncr ~d = Ne S,, S,, N e
(14)
9 N, N#
1-~
S v Sv )
where Ne is the Euler load for the column ignoring the effect of shear deformation, Nef is the Euler
buckling load of one flange part and Sv is the shear stiffness of the section. Flexural buckling may be
taken into account by reducing the yield stress using the column curves given in Eurocode 3.
The elastic distortional buckling stress of the perforated stud is quite low when distortional buckling is
free to develop. The sheathing screws offer considerable resistance to distortional buckling but the
utilisation of this support requires that the sheeting retains its capacity and stiffness for the expected
service life of the structure. The resistance of sheathing screws to distortional buckling may be taken
into account by using a convenient buckling length in the rotational stiffness equations (6) - (8) or in
the numerical analysis. However, the possibility of a failed screw connection in any location should be
considered and a minimum buckling length of twice the screw pitch may conservatively be used in the
design.
374
CONCLUSION
J. Kesti and J.M. Davies
An analytical prediction has been given for the local and distortional buckling capacity of perforated
studs. The elastic local or distortional buckling strength may be determined by replacing the
perforated web part with a plain plate of equivalent thickness. The effective cross-sectional area may
be determined according to Eurocode 3 or by using the method suggested by Schafer. A comparison
of test results for short perforated columns with the predicted values showed that the method used
gives reasonable results for perforated C-sections with or without web-stiffeners. The analysis also
showed that the local buckling stress of the perforated web of the C-section is conservative if it is
determined assuming that the web is simply supported without any contribution from the flanges.
ACKNOWLEDGMENTS
This paper was prepared while the first author was on a one-year study leave at Manchester University.
This leave was supported by The Academy of Finland. The facilities made available by the Manchester
School of Engineering are gratefully acknowledged.
REFERENCES
Allen, H. (1969), Analysis and Design of Structural Sandwich Panels, Pergamon Press.
Davies, J. and Jiang, C. (1995). GBT - Computer program, public domain, University of Manchester.
Eurocode 3 (1996), CEN ENV 1993-1-3 Design of Steel Structures - Supplementary Rules for Cold
Formed Thin Gauge Members and Sheeting, Brussels.
Htiglund, T. and Burstrand, H. (1998), Slotted Steel Studs to Reduce Thermal Bridges in Insulated
Walls,
Thin-Walled Structures,
32:1-3, 81-109.
Kesti, J. and Makelainen, P. (1999), Compression Behaviour of Perforated Steel Wall Studs,
4 th
International Conference on Steel and Aluminium Structures ICSAS'99,
Espoo, Finland, 123-130.
Lau, S. and Hancock, G. (1987), Distortional Buckling Formulas for Channel Columns,
Journal of
Structural Engineering,
113:5, 1063-1078.
NISA, Version 6.0 (1996), Users Manual, Engineering Mechanics Research Corporation (EMRC),
Michigan.
Salmi, P. (1998), Uumasta termorei'itettyjen profiilien mitoituksesta, Ter~rakenteiden tutkimus ja
kehitysp~iiv~it, 1998, Lappeenranta, Finland.
Schafer, B. and PekiSz, T. (1999). Local and Distortional Buckling of Cold-Formed Steel Members
with Edge Stiffened Flanges,
4 th International Conference on Steel and Aluminium Structures
ICSAS'99,
Espoo, Finland, 89-97.
AN EXPERIMENTAL INVESTIGATION INTO
COLD-FORMED CHANNEL SECTIONS IN
BENDING
V Enjily l, M H R Godley 2 and R G Beale 2
~Centre for Timber Technology and Construction, Building Research
Establishment, Watford, WD2 7JR, UK
2Centre tbr Civil Engineering, Oxford Brookes Universky, Oxford, OX3
0BP,
UK
ABSTRACT
The objective of this research was to investigate the post-buckling behaviour of cold-formed plain
channel sections in bending.
26 cold-formed plain sections were tested with their unstiffened flanges in compression with a range of
external flange width/thickness ratios (B/t) ranging from 5 to 94. The sections with B/t ratios less than
15 were able to carry the full plastic moment. Sections with higher B/t ratios developed trapezoidal
yield lines with ultimate loads accurately predicted by the classical yield line theory of Murray.
24 channel sections were tested with their stiffened webs in compression with web width/thickness
ratios (D/t) ranging from 18 to 186. Sections with D/t less than 60 carried the full plastic moment.
Initial tests on specimens with D/t ratios between 60 and 100 failed with local web crushing. A
modified loading procedure involving applying the load in the middle of the flanges was adopted
which produced results with some sections with D/t ratios between 60 and 100 carrying the full plastic
moment. All sections with D/t ratios in excess of 100 failed with a 'pitched roof' mechanism in the
stiffened web. Murray' s theory was less able to predict collapse behaviour in this case but comparisons
with the theory are given.
The experimental results are compared with BS5950 and design recommendations drawn up.
KEYWORDS
Cold-formed, steel, channels, bending, design
INTRODUCTION
Considerable research has been carried out, both experimentally and theoretically, into cold-formed
channel sections in axial compression, for example, Rhodes and Harvey (1976), Stowell (1951),
375
376
V. Enjily et al.
Murray (1984) and Little (1982) but little research has been reported into bending, Rhodes
(1982,1987), Enjily (1985). The objective of this research was to conduct a full experimental
investigation of cold-formed plain channels in bending and to correlate the results with yield line
theory.
UNSTIFFENED COMPONENTS (FLANGES) IN COMPRESSION
Experimental Technique
All specimens were tested in four point bending.
Load was applied by use of a screw jack and spreader beam so that the load shedding part of the
experimental cycle could be followed. The end conditions were simply-supported. Two spans of
1000mm and 500mm were tested with a region of pure bending of 300mm and 200mm in the centre of
each specimen. Measurements of central deflection were made by use of a dial gauge on the centre of
the web which was in tension and by means of a cathetometer sighted on the web-flange junction.
Load cells were placed under each support as shown in figure 1.
Figure 1: Experimental Layout and System of Loading
To ensure that the sections maintained shape, end-plates were welded onto the ends of each specimen.
These end plates were made from 4mm thickness steel plate and extended 25mm beyond the outer
fibres of the section. They also served to ensure that the end conditions were simply-supported (see
figure 2).
A screw jack was used in order to apply displacement increments. The load was applied via two rollers
nesting on the inside of the web. After each load increment was applied the system was allowed to
stabilise. An initial set of experiments was performed on a channel with dimensions 100"50"1.6 and
the stabilisation time was varied from between three and eight minutes in order to see if there was any
significant creep. The resulting maximum loads only varied by 30N. Hence all experiments reported
herein were tested at a stabilisation time of three minutes.
Experimental Investigation &to Cold-Formed Channel Sections in
Bending
377
r
i :. L
r-
PLA___"_.
ClIOI$-IECTI OI;
l-I
ilID PLATE
CUAIiI.[ x. tnrcTIOIt (
Figure 2" Details of end-plates
The experimental results are summarised in Table 1. Sample experimental curves are given in figure
3. Note the double 'kink' in the experimental curve of figure 3b. This occurred when one flange
buckled before the second. In most cases failure occurred simultaneously in both flanges.
TABLE 1
TEST RESULTS FOR THE ULTIMATE LOADS OF CHANNEL SECTIONS WITH THEIR FLANGES IN COMPRESSION.
Experiment Section Size
[Yiek [
Young's
Reference
(D*B*t) !
Slrer th ] Modulus
,
](N/Ill 12) ] (N/ram 2)
]
M9
MI0
Mll
'MI2
_
MI3
MI4
Mi5
M16
Q~
Q2
.Q3
Q4
30* 8"i.6 ~ 232.5
45* 16"1.6 jr'232.5 "
60* 24"1.6 jr 232.5
75* 32"1.6 jr'232.5
90* 40"1.6 jr232.5
105" 48"1.6 jr232.5
120" 56"i.6 ~232.5
135" 64"1.6 4232.5
160" 80"!.6 Jr 183.(3
210"105"1.6 ~_183.(3
240"120"1.6 J183.G
270"135"1.6 /183.0
_Q5 3o0"150"1.6 T183.0
9
10
11
12
13
14
,15
16
Q6
Q7
Q8
Q9
Q10
30* 8"1.6 4232.5
45* 16"i.6 ~232.5
60* 24"1.6 ]_232.5
75* 32"1.6 ~232.5
90* 40"1.6 [232.5
105" 48"1.6 42325
120" 56"1.6 ~232.5
135" 64"1.6 E232.5
160" 80"1.6 ~183.0
210"105"1.6 ~183.0
240"120"1.6 ~183.0
270"135"1.6 ~'83.0
300"150"1.6 UI.83.0
198700
198700
198700
198700
198700
198700
198700
198700
196000
196000
196000
196000
196000
198700
198700
198700
198700
198700
198700
198700
198700
196000
196000
196000
196000
196000
ExpeimentalIFuli-Plastic Experimental
1BS5950
l Experimental 1;pan
l B/t
Faih'e Load | Load (kN)
Failur~ Load/] Failure Failure Load/
| imm)
ratio
(kN)
t
I Full Plastic 1 Load
BS5950 [ t
i
Load Failure Load
-I
0.13 0.122 1.065 1. 0.122 1.065 ~ i000 4.50C
0.58
- 4
0.502 1.155 1.0.475 1222
I ~000 1.
9.50c
1.3(3 Jr I.!54 . 1.126 1.0.660 1.970 " J ~000 1. 14.50(3
1.89 Jr 2.079 0.909 1.1.153 1.639 "' j O00 1.19.50(3
2.19 Jr 3.275 0.669 ~ 1.635 1.339 .[ 000 1. 24.500
2.46 Jr 4.743 0.519 1.1.952 1.160 1. 000 ~29.500
2.71
4
6.684 0.418 1.2.132 1.271" ~ 000 1. 34.500
3.04 jr 8.497 0.358 1.2.259 1.346 J 000 ~39.500
3.80 Jr 10.495 0.362 1.2.355 1.614 1. 000 ~ 49.500
5.10 jr 18.166 0.281 1.2.689 1.897 ] 000 1. 65.125
5.40 Jr 23.773 0.227 ~ 2.908 1.857' 1. 000 1. 74.500
6.40 jr 30.133 0.212 1-3.140 2.038 .,. 1. 000 1-83"875
7.40 Jr36.,724 0.201 ].3.361 2.202 . ~ 000 1.93.250
0.32 jr 0.284 1.123 1.0.284 1.123 1. 500 [. 4.500
1.34 Jr 1.172 1.144 ~1.107 1.211 I 500 ~ 9.500(
2.90 Jr 2.693 1.077 ~1.339 1.884 ( 500 ~14.500
4.24 Jr 4.fl50 0.874 ~2.690 1.576 1. 500 ~ 19.500
5.02 Jr 7.641 0.657 1-3.816 1.316 I 500 1.24.500
5.82 Jr I1.068 0.526 [_4.556 1.278 1. 500 [_29.500
6.27 ].i5.i29 0.414 1-4.975 1.260 1. 500 1.34.500
6.80 Jr 19.825 0.343 1-5.271 1.290 1. 500 1-39.500
8.70 ]-24.484 0.355 1-5.494 1.583 ~ 500 1-49.500
11.70 ]_42.388 0.276 [_6.273 1.865 ~ 500 1-65.125
13.10 Jr55.470 0.236 1-6.785 1.931 " I 500 ~74.500
11.90 ]_70.3"09 0.169 ~7.328 1.624 I 500 ~83.875
12.70 185.6"89 0.148 17.855 1.617 / 500 /9~ 250
Theoretical Analysis
To enable an understanding of the ultimate post yield behaviour of channels the simple yield line
model described by Murray (1984) was used. Channels with flange/thickness ratios less than 15 were
able to attain their full plastic moment capability. Longer flanges developed local buckles in the
flanges which ultimately produced a series of yield lines as shown in Figure 4 In the analysis the
compression elements were divided into a series of strips. Element equilibrium of each strip was used
to derive values of the elemental force in each strip and their corresponding moments of resistance.
378
V. Enjily et al.
Figure 3a Figure 3b
Figure 3c Figure 3d
Figure 3: Typical experimental curves, flanges in compression
Figure 4: Side Elevation in the region of localised buckling
Experimental Investigation into Cold-Formed Channel Sections in Bending
379
These elemental values were then integrated to obtain the total moment of resistance of the
compression flange. Full details of the procedure are found in Enjily (1985) and Enjily et al (1998).
Figure 5 is a comparison between theory and experiment.
Figure 5: Comparison between theory and experiment (Specimen 14)
Discussion
In all cases the channels failed by forming a yield line mechanism in one, or both, of the unstiffened
webs. The experimental results are summarised in Table 1. It can be seen that channel sections can
carry the full plastic moment for flanges with B/t ratios less than 16.
The test results were compared with the maximum loads predicted by BS5950 Part 5(1987). The
maximum loads predicted by BS5950 are also given in Table 1. The load factors against collapse
calculated by BS5950 are seen to be very conservative giving results that vary from 1.065 to 2.2; the
larger discrepancies occurring for the largest flange wide/thickness ratios.
Stiffened component (web) in compression
Experimental Technique
The initial arrangement of the test rig for specimens tested with the web in compression was identical
to that for the case with the flanges in compression, with the exception that the cathetometer was used
at mid-span. Initially, the load was applied through rollers sitting on the web. However, local crushing
occurred under one or both rollers for experiments 1-8 and P6-P9 resulting in premature failure.
Owing to the thinness of the webs, and in order to overcome the bearing and tensile stresses exerted on
the flanges by this loading, small steel plates were welded to the outer surface of the flanges (close to
the free edge) at distances 300mm apart. Holes were drilled through the plates and flanges. Four long
strip-plates were attached with plate hangers and bolted to the sections. 40mm bars were placed
through the plate hangers to provide supports for a load-spreader beam. The screw jack was then
placed on top of the spreader and reacted against an independently mounted beam. The force applied
by the screw jack was then reacted through this improved loading arrangement into the flanges of the
channel section putting it into bending. Figure 6 shows a diagram of the improved loading system.
This system was applied to specimens Y1-Y11.The results of the experiments with the webs in
compression are summarised in Table 2.
Typical experimental curves are given in Figure 7. Local crushing was observed in most of the