Tiếng anh chuyên ngành kế toán part 11 docx
Bạn đang xem bản rút gọn của tài liệu. Xem và tải ngay bản đầy đủ của tài liệu tại đây (91.98 KB, 10 trang )
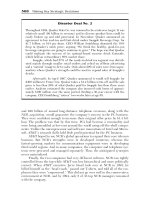
88 Understanding the Numbers
EXHIBIT 2.35
Adjustment worksheet for sustainable earnings base:
Baker Hughes Inc., years ended September 30
(in millions).
1995 1996 1997
Reported net income or (loss)
$105.4 $176.4 $97.0
Add
Pretax LIFO liquidation losses
Losses on sales of fixed assets
Losses on sales of investments
Losses on sales of “other” assets
Restructuring charges (unusual charge)
39.6 52.1
Investment write-downs
Inventory write-downs (included in cost of sales)
21.9
Other asset write-downs
Foreign currency losses
1.9 11.4
Litigation charges
Losses on patent infringement suits
Exceptional bad debt provisions
Temporary expense increases
Temporary revenue reductions
Other
Other
Other
Subtotal
$1.9 $51.0 $74.0
Multiply by
(1 – Combined federal and state tax rates)
58% 58% 58%
Tax-adjusted additions
$1.1 $29.6 $42.9
Add
After-tax LIFO liquidation losses
Increases in deferred tax valuation allowances
Other nonrecurring tax charges
Losses on discontinued operations
Extraordinary losses
Losses/cumulative-effect accounting changes
14.6 12.1
Other (acquired in-process R&D)
118.0
Other
Other
Subtotal
$14.6 $130.1
Total additions
$15.7 $29.6 $173.0
Analyzing Business Earnings 89
EXHIBIT 2.35 (Continued)
1995 1996 1997
Deduct
Pretax LIFO liquidation gains
Gains on sales of fixed assets (disposal of assets)
18.3 31.7 18.4
Gains on sales of investments (Varco stock)
44.3
Gains on sales of other assets
Reversals of restructuring charges
Investment write-ups (trading account)
Foreign currency gains
4.1
Litigation revenues
Gains on patent infringement suits
Temporary expense decreases
Temporary revenue increases
Reversals of bad-debt allowances
Other
Other
Other
Subtotal
$18.3 $76.0 $22.5
Multiply by
(1 – Combined federal and state tax rate)
58% 58% 58%
Tax-adjusted deductions
$10.6 $44.1 $13.1
Deduct
After-tax LIFO liquidation gains
Reductions in deferred tax valuation allowances
Loss carryforward benefits—from prior periods
13.1 3.3 4.2
Other nonrecurring tax benefits
(IRS audit agreement)
11.4
Gains on discontinued operations
Extraordinary gains
Gains/cumulative-effect accounting changes
Other
Other
Other
Subtotal
$13.1 $3.3 $15.6
Total deductions
$23.7 $47.4 $28.7
Sustainable earnings base
$97.4 $158.6 $241.3
90 Understanding the Numbers
EXHIBIT 2.36 Summary of nonrecurring items search process: Baker
Hughes Inc.
Step and Search Location Nonrecurring Item Revealed
1. Income statement
Unusual charge (1996-1997)
1
Acquired in-process research and development (1997)
1
Gain on sale of Varco stock (1996)
1
Cumulative effect of accounting changes (1995, 1997)
1
2. Statement of cash flows Acquired in-process research and development (1997)
2
Gain on sale of Varco stock (1996)
2
Gain on disposal of assets (1995–1997)
1
Foreign currency translation (gain)/loss, net
(1995–1997)
1
Cumulative effect of accounting changes (1995, 1997)
2
3. Inventory note No nonrecurring items located
4. Income tax note 1992 and 1993 IRS audit agreement (1997)
1
Operating loss and credit carryforwards (1995–1997)
1
5. Other income (expense) note No note provided
6. MD&A Petrolite inventory writedown in cost of sales (1997)
1
Unusual charge (1996-1997)
2
Acquired in-process research and development (1997)
3
Gain on sale of Varco stock (1996)
3
1992 and 1993 IRS audit agreement (1997)
2
Foreign currency translation (gain)/loss, net
(1996–1997)
2
7. Other notes revealing nonrecurring
items:
a. Significant accounting policies Cumulative effect of accounting changes (1995, 1997)
3
b. Acquisitions and dispositions Acquired in-process research and development (1997)
4
Unusual charges (1996-1997)
3
Gain on sale of Varco stock (1996)
4
c. Unusual charge Unusual charges (1996-1997)
4
d. Segment information Unusual charges (1996-1997)
5
Acquired in-process research and development (1997)
5
Petrolite inventory writedown in cost of sales (1997)
2
Gain on
sale of Varco stock (1996)
5
Note: The superscripts 1, 2, 3, and so on indicate the number of times the nonrecurring item was found.
For instance, “Gain on sale of Varco stock” was found in the income statement (first location); in the
statement of cash flows (second location); in MD&A (third location); in the “Acquisitions and disposi-
tions” note (fourth location); and in the “Segment and related information” note (fifth location).
Analyzing Business Earnings 91
worksheet, the company’s three-year operating performance is virtually impos-
sible to discern.
The efficient search sequence for identifying nonrecurring items in Ex-
hibit 2.3 was based on the experience of the authors supported by a large-scale
study of nonrecurring items by H. Choi. While the recommended search se-
quence may not be equally effective in all cases, Exhibit 2.37 demonstrates
that most of Baker Hughes’s nonrecurring items could be located by employing
only steps 1 to 5, a sequence that is very cost-effective. In fact, 92% of all
material nonrecurring items were located through the first four steps of the
search sequence. Further, locating these items requires reading very little text,
and the nonrecurring items are generally set out prominently in either state-
ments or schedules.
Exhibit 2.37 presents information on the efficiency of the search process.
The meaning of each column in the exhibit is as follows:
Column 1: The number of nonrecurring items located at each step in
the search process. This is based on all 17 nonrecurring
items without regard to their materiality.
Column 2: The cumulative percentage of all nonrecurring items
located through each step of the search process. Ninety
four percent of the total nonrecurring items were located
through the first five steps of the search process. All
nonrecurring items were located by step 6.
EXHIBIT 2.37 Efficiency of nonrecurring items search process: Baker
Hughes Inc.
Incremental Nonrecurring Items Discovered
(1) (2) (3) (4)
All Non- All
recurring Cumulative Material
a
Cumulative
Step and Search Location Items % Located Items % Located
1. Income statement 6 35% 6 50%
2. Statement of cash flows 6 71 3 75
3. Inventory note 0 71 0 75
4. Income tax note 4 94 2 92
5. Other income (expense) note 0 94 0 92
6. MD&A 1 100 1 100
7a. Significant accounting
policies note 0 100 0 100
7b. Acquisitions and dispositions
note 0 100 0 100
7c. Unusual charge note 0 100 0 100
7d. Segment and related
information note 0 100 0 100
Total nonrecurring items 17 100% 12 100%
a
Five percent or more of the amount of the net income or net loss, on a tax-adjusted basis.
92 Understanding the Numbers
Column 3: Same as column 1 except only material nonrecurring items
(those items exceeding 5% of net income on an after-tax
basis).
Column 4: Same as column 2 except that only material nonrecurring
items were considered.
SOME FURTHER POINTS ON THE
BAK ER HUGHES WORKSHEET
The construction of an SEB worksheet always requires a judgment call. One
could, of course, avoid all materiality judgments by simply recording all nonre-
curring items without regard to their materiality. However, the classification
of items as nonrecurring, as well as on occasion their measurement, calls for
varying degrees of judgment. Some examples of Baker Hughes items that re-
quired the exercise of judgment, either in terms of classification or measure-
ment, are discussed next.
The Petrolite Inventor y Adjustment
A pretax addition was made in Exhibit 2.35 for the effect on 1997 earnings of
inventory obtained with the Petrolite acquisition (see Exhibits 2.30 and 2.34).
Accounting requirements for purchases call for adjusting acquired assets to
their fair values. This adjustment required a $21.9 million increase in Petrolite
inventories to change them from cost to selling price. This meant that there
was no profit margin on the subsequent sale of this inventory in the fourth
quarter of 1997. That is, cost of sales was equal to the sales amount. Baker
Hughes labeled this $21.9 million acquisition adjustment “nonrecurring
charge to cost of sales for Petrolite inventories” (see segment disclosures in
Exhibit 2.34).
This Petrolite inventory charge raised the level of cost of sales in relation-
ship to sales. However, this temporary increase in the cost-of-sales percentage
(cost of sales divided by sales) was not expected to persist in the future. We
concurred with the Baker Hughes judgment and treated this $21.9 million
cost-of-sales component as a nonrecurring item in developing sustainable
earnings.
Foreign Exchange Gains and Losses
Information on foreign exchange gains and losses was disclosed in the state-
ment of cash flows (Exhibit 2.28) and in the MD&A (Exhibit 2.30). The state-
ment of cash flows disclosed foreign-currency losses of $1.9 million in 1995
and $8.9 million in 1996. A $6.1 million gain was disclosed in 1997. However,
the MD&A disclosed a foreign-currency loss of $11.4 million for 1996 and a
gain of $4.1 million for 1997. The foreign-currency items in the statement of
Analyzing Business Earnings 93
cash flows represent recognized but unrealized gains and losses. As such, there
are no associated cash inflows and outflows. However, the disclosures in the
MD&A represent all of the net foreign-exchange gains and losses, both real-
ized and unrealized. These are the totals that would have been added or de-
ducted in arriving at net income and also represent the nonrecurring foreign
currency gains and losses.
For 1996 and 1997, the Baker Hughes worksheet includes the foreign cur-
rency gain and loss disclosed in the MD&A, a loss of $11.4 million for 1996 and
a gain of $4.1 million for 1997. In the absence of a disclosure of any foreign
currency gain or loss in the MD&A for 1995, the worksheet simply included
the $1.9 million loss disclosed in the statement of cash flows. Adjusting the
foreign-currency gains and losses out of net income is based on a judgment that
comparative performance is better represented in the absence of these
irregular items.
The Tax Rate Assumption and Acquired R&D
The tax rate used in the Baker Hughes worksheet was a combined (state, fed-
eral, and foreign) 42%. This is the three-year average effective tax rate for the
company once nonrecurring tax items were removed from the tax provision.
Two nonrecurring tax items stand out in the income tax disclosures in Ex-
hibit 2.29. First is the increase in the tax provision because of the lack of tax
deductibility of the $118 million of acquired in-process research and develop-
ment in 1997.
49
The tax effect of this nonrecurring item, $41.3 million, pushed
the effective rate up to 49% for 1997. Because of this lack of deductibility for
tax purposes, the pretax and after-tax amounts of this charge are the same,
$118 million. Therefore, we recorded the $118 million charge with the other
tax and after-tax items in the bottom section of the SEB worksheet. Because
this item is added back to net income on its after-tax basis, no additional ad-
justment was needed for the $41.3 million tax increase resulting from the lack
of deductibility.
The second adjustment was for the $11.4 million nonrecurring tax reduc-
tion that resulted from an IRS audit agreement. The tax rate scales the num-
bers in the worksheet to their after-tax amounts. The goal should be a rate that
is a reasonable representation of this combined rate. It is usually not cost bene-
ficial to devote an inordinate amount of time to making this estimate.
Equity Earnings and Disposal of
the Varco Investment
The MD&A included discussion of the gain on the sale of the Varco investment.
This is a clear nonrecurring item, and it was adjusted from results in the Baker
Hughes SEB worksheet. Baker Hughes accounted for its investment in Varco by
using the equity method. This indicates that its ownership was sufficient to pro-
vide it with the capacity to exercise significant influence over Varco. Baker
94 Understanding the Numbers
Hughes disclosed that it recognized equity income from Varco of $3.2 million in
1995 and $1.8 million in 1996. However, the disposal of the Varco investment
did not qualify as a discontinued operation. If it had been so classified, then the
Baker Hughes share of earnings would have been removed from income from
continuing operations of 1995 and 1996 and reported with discontinued opera-
tions—along with the gain on the disposition of the investment.
Clearly, a case could be made for treating the 1995 and 1996 equity earn-
ings as nonrecurring and removing them from earnings in developing the SEB
worksheet. This would not alter the message conveyed by the SEB worksheet in
this particular case. However, if the effect were more material, then a judg-
ment to treat as nonrecurring the equity earnings from the Varco investment
would be in order.
Using the Summary Disclosures of Unusual Charges
In completing the worksheet, the summary totals from the unusual-charge dis-
closures (Exhibit 2.33) were used. Alternatively, the detail on the charges
could have been recorded in appropriate lines in the worksheet. We saw this as
offering no advantage here.
Having the detail on the makeup of the unusual charges is helpful in de-
termining whether other additional nonrecurring items have already been in-
cluded in these totals. Recall that the 1997 Petrolite inventory adjustment of
$21.9 million was not included in the unusual charges total (it was included in
cost of sales). Summaries for unusual charges, it should be noted, usually do
not include all items that could reasonably be considered nonrecurring. In ad-
dition, care should be taken not to duplicate the recording of items already in-
cluded in summary totals for unusual charges.
SUMMARY
An estimation of the sustainable portion of earnings should be the centerpiece
of analyzing business earnings. This task has become a far greater challenge
over the past decade as the number of nonrecurring items has increased dra-
matically. This explosion has been driven by corporate reorganizations and
associated activities. Some of the labels attached to these producers of non-
recurring items are restructuring, rightsizing, downsizing, reengineering, re-
deployment, repositioning, reorganizing, rationalizing, and realignment. The
following are some key points for the reader to consider:
• An earnings series from which nonrecurring items have been purged is
essential in order to both evaluate current trends in operating perfor-
mance and make projections of future results.
• The identification and measurement of nonrecurring items will typically
require the exercise of judgment.
Analyzing Business Earnings 95
• There are no agreed-upon definitions of nonrecurring items as part of
GAAP. Moreover, a variety of labels are used beyond the term nonrecur-
ring and they include special, unusual, nonoperating, and noncore.
• It is common to treat items as nonrecurring even though they may appear
with some regularity in the income statement. However, these items are
usually very irregular in terms of their amount as well as whether they are
revenues/gains or expenses/losses.
• The key question to pose in making the nonrecurring judgment is: Will
underlying trends in operating performance be obscured if the item re-
mains in earnings?
• Many material nonrecurring items will be separately disclosed on the face
of the income statement. However, a substantial number will be disclosed
in other statements and locations. It is typically necessary to extend the
search for nonrecurring items well beyond the income statement.
• In response to reductions in the time available for a whole range of im-
portant activities, an efficient and abbreviated search sequence is pre-
sented in the chapter and illustrated with a comprehensive case example.
While a comprehensive review of all financial reporting is the gold stan-
dard, reliable information on sustainable earnings can typically be devel-
oped while employing only a subset of reported financial information.
FOR FURTHER READING
Bernstein, L., and J. Wild, Financial Statement Analysis: Theory, Application, and
Interpretation, 6th ed. (Homewood, IL: Irwin McGraw-Hill, 1998).
Comiskey, E., and C. Mulford, Guide to Financial Reporting and Analysis (New
York: John Wiley, 2000).
Comiskey, E., C. Mulford, and H. Choi, “Analyzing the Persistence of Earnings: A
Lender’s Guide,” Commercial Lending Review (winter 1994–1995).
White, G., A. Sondhi, and D. Fried, The Analysis and Use of Financial Statements
(New York: John Wiley, 1997).
Mulford, C., and E. Comiskey, Financial Warnings (New York: John Wiley, 1996).
Special Committee on Financial Reporting of the American Institute of Certified
Public Accountants, Improving Business Reporting—A Customer Focus (New
York: AICPA, 1994).
INTERNET LINKS
www.fasb.org This site provides updates on the agenda of the FASB.
It also includes useful summaries of FASB statements
and other information related to standard setting.
www.freeedgar.com This site provides a very convenient alternative source
of SEC filings.
96 Understanding the Numbers
www.sec.gov A source for accessing company Securities and
Exchange Commission filings. This site also includes
Accounting and Auditing Enforcement Releases of the
SEC. These releases provide very useful examples of
the actions sometimes taken by companies to
misrepresent their financial performance or position.
ANNUAL REPORTS REFERENCED IN THE CHAPTER
Advanced Micro Devices Inc. (1999)
Air T Inc. (2000)
Akorn Inc. (1999)
AK Steel Holdings Corporation (1999)
Alberto-Culver Company (2000)
Amazon.Com Inc. (1999)
American Building Maintenance Inc. (1989)
American Standard Companies Inc. (1999)
AmSouth Bancorporation (1999)
Archer Daniels Midland Company (2000)
Argosy Gaming Company (1995)
Armco Inc. (1998)
Armstrong World Industries Inc. (1999)
Artistic Greetings Inc. (1995)
Atlantic American Corporation (1999)
Avado Brands Inc. (1999)
Avoca Inc. (1995)
Baker Hughes Inc. (1997)
Baltek Corporation (1997)
C.R. Bard Inc. (1999)
Baycorp Holdings Ltd. (1999)
Bestfoods Inc. (1999)
Biogen Inc. (1999)
BLC Financial Services Inc. (1998)
Brooktrout Technologies Inc. (1998)
Brush Wellman Inc. (1999)
Burlington Resources Inc. (1999)
Callon Petroleum Company (1999)
Champion Enterprises Inc. (1995)
Chiquita Brands International Inc. (1999)
Analyzing Business Earnings 97
Cisco Systems Inc. (1999)
Colonial Commercial Corporation (1999)
Corning Inc. (1999)
Cryomedical Sciences Inc. (1995)
Dal-Tile International Inc. (1999)
Dana Corporation (1999)
Dean Foods Company (1999)
Decorator Industries Inc. (1999)
Delta Air Lines Inc. (1996, 2000)
Detection Systems Inc. (2000)
Dibrell Brothers Inc. (1993)
Escalon Medical Corporation (2000)
Evans and Sutherland Computer Corporation (1998)
The Fairchild Corporation (2000)
First Aviation Services Inc. (1999)
Freeport-McMoRan Inc. (1991)
Galey & Lord Inc. (1998)
Geo. A. Hormel & Company (1993)
Gerber Scientific Inc. (2000)
Gleason Corporation (1995)
Goodyear Tire and Rubber Company (1995, 1998)
Handy and Harman Inc. (1997)
M.A. Hanna Company (1999)
Hercules Inc. (1999)
H.J. Heinz Company (1995)
Holly Corporation (2000)
Hollywood Casino Corporation (1992)
Imperial Holly Corporation (1994)
Imperial Sugar Company (1999)
JLG Industries Inc. (2000)
KeyCorp Ohio Inc. (1999)
Kulicke & Soffa Industries Inc. (1999)
Lufkin Industries Inc. (1999)
Mason Dixon Bancshares Inc. (1999)
Maxco Inc. (1996)
Meredith Corporation (1994)
Micron Technology Inc. (2000)
NACCO Industries Inc. (1995)
National Steel Corporation (1999)