Tiếng anh chuyên ngành kế toán part 13 pdf
Bạn đang xem bản rút gọn của tài liệu. Xem và tải ngay bản đầy đủ của tài liệu tại đây (109.44 KB, 10 trang )
108 Understanding the Numbers
al
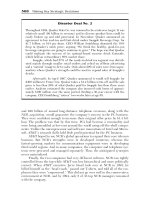
ternatives (see Exhibit 3.5). ‘Stay with the publisher’ shows that you make
$12 for every book sold. ‘Sell through the Web site’ is a bit more involved in
that it shows that you first must cover your fixed cost before making any profit.
Note that they intersect at about 9,100 books sold, which means that you would
be indifferent to which business model you chose at this volume of books sold.
3
But at less than the 9,100 you should stay with your publisher; at greater than
that volume, build your own Web site. At the 20,000 books-per-year level you
said you are sure this project will hit, you make $240,000 per year (20,000 ×
$12 royalty per book) if you stay with your publisher, and $360,000 with the
Web site (20,000 × [$80 − $57] − $100,000 fixed costs). Another way to think
about this is that if we set up our own Web site there is an additional variable
cost for each book we sell—the $12 we could have made from the publisher
(see Exhibit 3.6). This is called an opportunity cost. It is a relative measure—
EXHIBIT 3.5 Prof it chart.
5,000 10,000 15,000 20,000 25,000
Dollars (thousands)
Units
Stay with publisher
Sell through Web site
–200
–100
0
100
200
300
400
500
600
EXHIBIT 3.6 Revised Web site CVP analysis.
0 10,0005,000 15,000 20,000 25,000
Dollars (thousands)
Units
Total revenue line
Revised total cost line
$69x + $100,000
Break-even now
indifference point
0
500
1,000
1,500
2,000
2,500
Cost-Volume-Profit Analysis 109
what is sacrificed when we choose one alternative, selling through the Web
site, over the next best alternative, staying with the publisher. If we think this
way, our contribution margin is now only $11 ($80 selling price less $57 vari-
able costs less $12 royalty per book sacrificed). We do arrive at the same indif-
ference point using this method—using the general rule:
I think this is the better way to think about the Web-site alternative. Note,
using this method, at 20,000 books per year we make a total contribution of
$220,000 (20,000 × $11), which covers our fixed costs and yields the $120,000
incremental profit—same as ($360,000 − $240,000).”
Abbey was becoming very interested in this business opportunity. She
liked the 50% greater return ($120,000/$240,000). “How fast can we get this
Web site up and running?”
“Let’s talk a bit more. I also presented today in class what we have done so
far. Many students liked the idea. The only criticism was that Web customers
expect lower prices since they know the middle person has been eliminated.
The class agreed that a 10% to 15% price decline would be very likely, resulting
in a price closer to $70. This is not so good for us. Even though our variable cost
will fall to $67.50 since part of it is price dependent ($35 printing + $10 logis-
tics + $12 opportunity cost + [15% × $70]), our contribution margin would
now only be $2.50 per book. Just to match what you could make with your
publisher, we would have to sell about 40,000 books a year ($100,000/$2.50
per book). At the 20,000-book level, we would now be worse off by $50,000
([20,000 × $2.50] − $100,000). Well, you asked about the risks and here they
are. The price could even be lower, so there is a high probability we could wind
up worse off.”
“So, you’re my business partner, what do you suggest?” was Abbey’s reply.
“That’s a hard one,” was all Stephen could say.
CVP for Decision Making
The next day Abbey called Stephen for more advice. “Public Broadcasting Sys-
tem of Florida called me after our talk yesterday. They just began planning
their end-of-year membership drive and heard about my book project. They
want to offer a free copy of my book to any member who donates $250
or more.”
Stephen thought that was great.
“Unfortunately, since they are a public company they have constraints on
their spending. They can give a gift equivalent to only 20% of the donation.
CVP Point
Fixed Costs
Contribution Margin
units
=
=
=
$,
$
,
100 000
11
9 091
110 Understanding the Numbers
Fifty dollars a book for 5,000 books was their offer to me. Since we just went
over the numbers, I said I couldn’t possibly do this since our variable costs
alone were greater than $50 a unit. This analysis we did does help with decision
making. Last year I might have agreed to the deal. I am starting to feel like a
businessperson.”
Stephen asked whether the PBS group accepted her decision. When
Abbey said that they were very persistent and would call back next week,
Stephen suggested he and Abbey meet again for lunch. He needed to review
some of his class notes on relevant cost analysis, specifically on something he
remembered as “special orders.”
At lunch Stephen explained some analysis he had done. “Abbey, this is
ca
lled a special order situation. These types of business decisions are short-
run decisions that have no long-term ramifications.
4
Assuming that we have
the Web site up by that time, we have to be careful in identifying only those
costs that are relevant to the decision. For instance, the $100,000 we will
spend on our site per year is not relevant, since regardless of whether we ac-
cept this special order, those costs will still be there. The rule that we use is:
A cost is relevant if and only if it will change due to the decision being ana-
lyzed, in this case our special order. Let’s review the relevant costs. First,
there’s the $35 charge to print the books on demand. Since this is a 5,000-unit
order the printer’s costs to prepare the run, called set-up costs, will be spread
over a much larger number of books. I talked with him, and he would be will-
ing to do this run for $30 per book. Likewise, UPS or FedEx will ship these
books all at once and not individually, so the $10 charge per book will be
avoided. A one-time fixed charge of $250 for shipment of the 5,000-book
order is closer to the correct number. Since this order was not sold through a
EXHIBIT 3.7 Relevant cost analysis of special order.
Accept the
Order, No Accept the
Adjustments Order, Reject the
to Costs Adjusted Costs Order Difference
Number of books sold 5,000 5,000 0 5,000
Revenue $250,000 $250,000 $ 0 $250,000
Relevant costs:
Printing $175,000 $150,000 $ 0 $150,000
Logistics 50,000 250 0 250
10% site referral 25,000 0 0 0
5% Web site expense 12,500 12,500 0 12,500
Total relevant costs $262,500 $162,750 $ 0 $162,750
Nonrelevant costs
Web site design $100,000 $100,000 $100,000 $ 0
Profit from order $ 87,250
Cost-Volume-Profit Analysis 111
site reference, the 10% com
mission can also be avoided. I looked into the
Web-site contract, and I do think we will have to pay this charge of $2.50 per
book (5% × $50). Summing up, the variable cost per book for this special
order will be only $32.50 ($30 printing charge plus $2.50 Web-site fee)—less
than the $50 PBS is willing to pay. The end result is a $17.50 contribution mar-
gin per book for this special order. There is an incremental fixed charge of
$250 but we still will make just over $87,000 (5,000 × [$50 − $32.50] − $250
= $87,250). So we should think about reconsidering the offer” (see Exhibit 3.7).
Though Abbey was beginning to appreciate the complexity of this type of
analysis, all the numbers did make sense. She had only one question: “What
happens if customers I would have sold to anyway get their books this way?
Don’t I lose money?”
Stephen had done that analysis. “In the business world, we call that can-
nibalization. On every book sold through this special offer, you could poten-
tially lose the $23 contribution margin per book sold through the regular Web
site if these people would have bought anyway. To solve for the potential num-
ber of regular customers that would have to be cannibalized in order for us to
lose money on this special order, follow this procedure:
Solving for x, we get
This means that if about 3,800 of the 5,000 books sold by PBS go to customers
that would have bought anyway, we are indifferent to accepting this order. If
more than 3,800 would have bought anyway, we lose on this special order. Do
you think 76% (3,800/ 5,000) of these people would buy from our Web site? I
don’t think it is anywhere near that. And, on the positive side, these 5,000 peo-
ple would now be advertising our Web site with your book on their coffee ta-
bles all over Florida.”
Abbey was searching for the PBS phone number before Stephen had fin-
ished the last sentence. She made a mental note to understand this “relevant
cost” analysis a bit more.
Price Discrimination
In the above special order situation, there was a legitimate reason to offer PBS
the lower price. As Exhibit 3.7 illustrates, the relevant cost analysis justified
the lower price. When offering different prices to different customers, one
must be aware of the laws regarding price discrimination. Under the federal
Robinson-Patman Act and many state laws, it is illegal to price discriminate
un
less there are mitigating circumstances. One must be very careful to do a
x =
=
$,
$
,
87 250
23
3 793 customers
$$,23 87 250x =
112 Understanding the Numbers
relevant cost analysis before granting any price concessions to customers on a
selective basis.
CVP in a Multiple Product Situation
The special order was a great opportunity, but both Abbey and Stephen knew
that the success of the Web site ultimately would depend on the regular, day-
to-day business activity. The two of them were still worried about the potential
Web discount resulting in a $70 price point. As an artist Abbey understood risk
and had learned long ago to accept risk and figure a way to minimize it. She de-
cided to talk with some of her artist friends.
In two weeks she and Stephen met again. Stephen was desperate to finish
his project since semester end was right around the corner. Abbey walked in
wearing a rather stylish straw hat.
“I think I have the solution, Stephen. I do not want to drop my price from
$80. My other books sold at this price, and to drop the price on this one might
send the wrong message to my loyal following. This book will not be in any
manner inferior to my past works. But I do have an idea. We are going to ex-
pand our product offerings. I have a dear friend who makes these hats, and I
think this would be a perfect complement to my bird book. After all, if you are
going out bird-watching in Florida you need both to look good and to have sun
protection. We are going to package the book with a hat and a Peterson’s
Florida Bird Guide at a very reasonable price for those that are more price
conscious.”
Stephen was stunned. “Whoa, do you want all this complexity in your
business, Abbey?”
She smiled. “I, too, can do some field research. My friend will package
the three items as orders come in. I don’t have to do any more work than be-
fore. She was happy to build demand for her hats.”
“So, how about the costs?”
“This is how I see it. We sell the hats for $50 by themselves; the books for
$80 by themselves; and then offer the package for $140. A Peterson’s Guide
typically sells for $20, so this package price is a deal—you could say I’m selling
my book for $70 as part of this package, although I would never admit to it. I
coerced my friend to give us her hats for $24 each, and the book costs when in-
cluded in this package will change a bit. I put your relevant cost technique to
work here. My friend and I think we can assemble the package for a variable
cost of about $100 (see Exhibit 3.8). Peterson will give us the guide for $10 to
get the exposure, and since we are still shipping only one item, I’m hoping that
the logistics charge will not change too much. I had some problems figuring out
what we have to sell since there were now multiple items—hats, books, and
packages. But I have faith in you.”
As his laptop was booting Stephen began. “CVP analysis for multiple
products is very common since few companies sell just one item. Instead of
Cost-Volume-Profit Analysis 113
fo
cusing on a contribution margin per unit, when we have multiple products
we must base our calculations on the percentage contribution margin for each
dollar of revenue.”
“Sounds complicated.”
“Not really, Abbey. It’s probably easier, though, for me to show you how it
works than to explain it. All I need is your estimate of the sales mix. For every
book you sell individually, how many hats will you sell and how many packages
will you sell? These estimates do not have to be exact—businesspeople typi-
cally talk about ballpark estimates.”
“My friend and I did discuss this. We were not sure, so we came up with a
range. We think that for every 100 books we sell individually, we will sell 50
packages. A surprisingly large number of people are active in this regard. They
actually do enjoy seeking these birds out in the wild. And, of course, everyone
knows you need a wide-brimmed hat in Florida. We guessed that we might also
sell 20 hats individually for every 100 books sold. If things go really well, we
might sell as many as 70 packages and 30 hats for every 100 books. On the pes-
simistic side, we could sell as few as 30 packages and 10 hats for the same 100
books. Is this okay?”
“Actually, that’s even better. If you’re sure of these ranges, then we can
do a sensitivity analysis to see how our profits will change as the mix changes.
We need to know how much our profit will vary with changes in the mix. Are
you comfortable with these ranges?”
“Yes.”
“To do this analysis we must first build a product mix analysis. Here, I’ll
show you.”
Abbey was very impressed as Stephan built the analysis on his laptop (see
Exhibit 3.9). “Just as we analyzed the unit costs before, we build a similar cost
analysis. The only difference is that this time we build it for a composite unit
defined by the mix. For your expected mix, 100 books plus 50 packages plus 20
hats, we see that for every $16,000 in sales you will have $11,180 in variable
costs. This means that on a percentage basis your variable costs are 69.9%
of
sales as long as you sell in that mix. Note that we now have a percentage def-
inition of contribution margin, not a unit definition—contribution margin
EXHIBIT 3.8 Variable package cost
estimates.
Hat $ 24
Book printing 35
10% site referral fee 14
5% Web site commission 7
Peterson Guide 10
Package logistics 10
$100
114 Understanding the Numbers
percent
age of 30.1%. Our fixed costs are still $100,000 per year, so we now ad-
just the general rule for CVP point as follows:
5
Solving for x,
To test this model, assume that we have $332,226 in sales revenue and we did
sell the planned mix. Our contribution margin will be 30.1%, which yields the
$100,000 necessary to cover the fixed costs. We do, in fact, break even. The
key, of course, is to be able to forecast the correct mix and then to attain it.”
Abbey was quick to correct Stephen. “Don’t forget, I still want to be at
least as well off as if I chose to stay with my publisher—say the 20,000 books at
my $12 royalty.”
“Easy enough. We just revise the equation by adding a necessary profit re-
quirement—this is why they call it cost-volume-profit analysis:
Sales Variable Costs Fixed Costs Profit−−=
−− =xx(.%)$, $,69 9 100 000 240 000
(.%) $ ,
$,
.%
$,
30 1 100 000
100 000
30 1
332 226
x
x
=
=
= in sales revenue
Sales Variable Costs Fixed Costs−−=
−− =
0
69 9 100 000 0xx(.%) $ ,
EXHIBIT 3.9 Mix contribution estimates.
Books Packages Hats Mix
Per Unit Total Per Unit Total Per Unit Total Total
Low Mix 100 30 10
Revenue $80 $8,000 $140 $4,200 $50 $ 500 $12,700
Variable Cost $57 $5,700 $100 $3,000 $24 $ 240 $ 8,940
Contribution 71.3% 71.4% 48.0% 70.4%
Expected Mix 100 50 20
Revenue $80 $8,000 $140 $7,000 $50 $1,000 $16,000
Variable Cost $57 $5,700 $100 $5,000 $24 $ 480 $11,180
Contribution 71.3% 71.4% 48.0% 69.9%
High Mix 100 70 30
Revenue $80 $8,000 $140 $9,800 $50 $1,500 $19,300
Variable Cost $57 $5,700 $100 $7,000 $24 $ 720 $13,420
Contribution 71.3% 71.4% 48.0% 69.5%
Cost-Volume-Profit Analysis 115
Solving for x,
We find that you must do about $1.130 million in sales to be as well-off.”
“Hmm. I’m not sure what this means. So how much of what do I have to
sell? That’s what I want to know.”
“What we do is take the total required sales of $1.130 million and split it
by your revenue mix percentages. Given your expected mix estimates, half of
your revenues will come from sales of books, or $564,315; seven-sixteenths
from packages, or $493,776; and the other one-sixteenth from sales of hats, or
$70,539. Dividing by the selling price of each item, we can also compute the
necessary unit sales levels—7,054 books, 3,527 packages, and 1,411 hats. With
our variable cost estimates, if you meet these targets we will indeed meet the
targeted profit level (see Exhibit 3.10). In summary, we were worried that our
9,100-book target was too optimistic because price cuts were possible. With
this mix we will have to sell 10,581 books—7,054 individually and 3,527 in
packages—but one-third of them will essentially sell for around $70. This
seems more realistic if the packages are marketed correctly.”
“What does the sensitivity analysis tell us?”
“Since the contribution percentage for the package is about equal to an
individual book, this solution is not very sensitive to variation in mix. If you
do meet your ‘optimistic’ mix projection, your contribution percentage in-
creases by less than 1%—30.1% to 30.5% (see Exhibit 3.11). As a result your
(.%) $ ,
$,
.%
$, ,
30 1 340 000
340 000
30 1
1 128 631
x
x
=
=
= (with no rounding)
EXHIBIT 3.10 Required unit revenues and sales volumes expected mix.
Books Packages Hats Mix
Per Unit Total Per Unit Total Per Unit Total Total
Expected mix 100 50 20
Revenue $80 $ 8,000 $140 $ 7,000 $50 $ 1,000 $ 16,000
Percentage of
total 50.00% 43.75% 6.25% 100.00%
CVP target $1,128,631
Mix % allocation $564,315 $493,776 $70,539 $1,128,631
Variable cost 71.3% 402,075 71.4% 352,697 48.0% 33,859
Contribution
margin $162,241 $141,079 $36,680 $ 340,000
Divide by unit
price to find
unit sales
needed Books 7,054 Packages 3,527 Hats 1,411
116 Understanding the Numbers
sales revenue target to meet your profitability goal will drop only a small
amount—from about $1.130 million ($340,000/30.1%) to $1.120 million
($340,000/30.5%). Basically, we would have to sell only 9,830 books with 41%
at discount. This would mean, though, that we would have to sell substantially
more packages. All in all, our answer is not that sensitive to the mix.”
Abbey now asked Stephen if he wanted to partner with her.
METHODS OF COST BEHAVIOR ESTIMATION
CVP analysis is a rough, first-pass analytic technique. Businesspeople use it to
make some initial profitability estimates of potential opportunities and to cull
those that show the most promise. More in-depth analysis would then follow.
6
The key to CVP analysis is correctly identifying the cost structure of the
business opportunity being analyzed. Without a proper knowledge of the cost
behaviors—identification of the fixed period costs and the variable costs per
unit or as a percentage of sales revenue—business planning cannot be done
properly. There are four methods used to analyze cost behavior. Three are ana-
lytic approaches that require historical data, and the other is more judgmental.
Abbey’s Web-site example discussed above is an example of the latter.
Since the business was not yet operating, there was no database to study.
Rather, the cost structure was estimated by analyzing the processes on which
Abbey’s business would be based. The data came from discussions with process
partners such as the Web-site designer and the logistics company and from
Abbey’s firsthand knowledge of the book business. This procedure depends on
correctly identifying all the necessary business processes and the experience
EXHIBIT 3.11 Mix sensitivity analysis optimistic mix.
Books Packages Hats Mix
Per Unit Total Per Unit Total Per Unit Total Total
Expected mix 100 70 30
Revenue $80 $ 8,000 $140 $ 9,800 $50 $ 1,500 $ 19,300
Percentage of
total 41.45% 50.78% 7.77% 100.00%
CVP target $1,115,986
Mix % allocation $462,585 $566,667 $86,735 $1,115,986
Variable cost 71.3% 329,592 71.4% 404,762 48.0% 41,633
Contribution
margin $132,993 $161,905 $45,102 $ 340,000
Divide by unit
price to find
unit sales
needed Books 5,782 Packages 4,048 Hats 1,735
Cost-Volume-Profit Analysis 117
and ability of those who provide accurate process cost estimates. Since
Abbey’s business model was relatively simple and many of the processes were
outsourced to experienced third-party providers, the resulting cost structure
estimates are probably relatively accurate. Given a more complex business op-
portunity that might require many internal process steps that are not yet well
understood, this methodology might not yield such accurate results.
The three analytic approaches are techniques used when historical data is
available. Unfortunately, many firms first develop this analysis after they have
begun operations—an inopportune time. For instance, now that the bloom is
off the Internet rose, there are many such firms scrambling to do this analysis
after the fact. Investors are withholding later-round financing until these firms
can develop the analysis we illustrated above.
Assume that Books “R” Us is one of those firms. Since it has not yet bro-
ken even, its investors want to better understand the cost structure and when,
if ever, they can expect a return. The company has been in business for two
years and over the past 12 months has shifted from building infrastructure to
its primary focus, selling books.
7
All agree that these past 12 months would be
a good basis on which to develop the analysis.
8
The relevant data are given in
Exhibit 3.12.
There are many ways to analyze this data. They all assume the following
first-order cost equation:
The first of the three databased techniques is simply to plot the data in an x-y
coordinate system with costs on the y-axis and sales revenues on the x-axis. It
Total Cost Variable Cost Fixed Cost
(Variable Cost Percentage Sales Revenue) Fixed Cost
=+
=×+
EXHIBIT 3.12 Books “R” Us data.
Revenue Total Costs Profit
$(000) $(000) $(000)
January $ 12,250 $ 13,500 $ (1,250)
February 14,500 16,000 (1,500)
March 15,000 16,500 (1,500)
April 16,250 17,250 (1,000)
May 15,250 16,500 (1,250)
June 13,750 15,500 (1,750)
July 11,500 13,000 (1,500)
August 17,500 18,250 (750)
September 23,750 25,000 (1,250)
October 15,500 16,500 (1,000)
November 16,000 17,250 (1,250)
December 22,500 22,000 500
Total $193,750 $207,250 $(13,500)