Research and application of molecule markers in breeding salt-tolerant Bacthom 7 rice variety
Bạn đang xem bản rút gọn của tài liệu. Xem và tải ngay bản đầy đủ của tài liệu tại đây (1.27 MB, 27 trang )
MINISTRY OF EDUCATION
AND TRAINING
MINISTRY OF AGRICULTURE
AND RURAL DEVELOPMENT
VIETNAM ACADEMY OF AGRICULTURAL SCIENCES
DONG THI KIM CUC
“Research and application of molecule
markers in breeding salt-tolerant Bacthom 7
rice variety”
Major: Genetics and Breeding
Code: 62.62.01.11
DOCTORAL THESIS SUMMARY OF
AGRICULTURE
HaNoi - 2014
The Doctoral thesis was completed in:
VIETNAM ACADEMY OF AGRICULTURAL SCIENCES
Supervisos:
1. Assoc.Prof. Le Huy ham
2. Dr. Le Hung Linh
Objection1:
Objection2:
Objection3:
The Doctoral thesis is defelded at Institute Committee of PhD
Dissertation Examination:
VIETNAM ACADEMY OF AGRICULTURAL SCIENCES
At……day…….month ………… 2014
PhD thesis can be found at:
- Nationa Library of VietNam.
- Library of VietNam Academy of Agricultural Sciences
1
INTRODUCTION
1. Imperativeness of the thesis
Rice production and yield are significantly losses due to diseases and pests infestation and the
environmental impacts. Of these, the noticeable factor is salt-influenced to rice. The cultivated lands
have been affected from the salinity by 380 million ha, accounted for 1/3 total worldwide cultivated
areas.
Salt – affected lands is the main factor which has curbed to develop productivity of rice, and also
caused influence to food security in general. Hence, to reduce the salinity affect to the rice plant has
paid much attention to research [124].
To meet this demand, to generate the salinity tolerance rice variety is necessary work. It is
needed to explore the natural plant resource against salinity tolerance by either directly selecting or
by genetic selection, or marker assisted selection. Application of molecular markers may help to
identify the present of salinity tolerance gene(s), which is very useful for the breeder to select the
effective crossed combination. Hence, It would be accelerated to breed rice salinity tolerance,
shortened the selection time, and expenses and labour. As aforementioned, the topic entitled
“Application the molecular markers to improve salinity tolerance of Bac Thom 7”
2. Objectives
2.1. General objectives
Study on evaluating and developing some salinity tolerance of rice which derived from the the
IRRI and India, and some grown rice varieties in Vietnam were used in this thesis.
Applying marker assisted backcrossing to improve salinity tolerance of rice which are adapted
for the Red River Delta.
2.2. Specific Objectives
Identifying the salinity tolerance and phenotype of the rice lines which carrying the Saltol
locus (donor plant), imported from International Rice Research Institute, as well as selecting the
polularly grown rice cultivar were used as the receipient plant
Applying marker assisted backcrossing (MABC) to pyramid salinity tolerance Saltol locus
into Bac Thom 7, in order to generate the high quality rice variety with salinity tolerance for growing
the coastal areas in Red River Delta
3. Scientific and Practical Significance
3.1. Scientific Significance
2
Based on the successful archivements of application of marker assisted backcrossing to transfer
salinity tolerance QTL into other rice varieties will be widely applied for rice breeding to cope with
climate change in the foreseeable future.
Application of molecular breeding to combine with the traditional breeding to accelerate and identify
the salinity tolerance rice materials, to pyramid it into Bac Thom 7 which could help to overcome the
constrains of traditional breeding, especially with the heterzygote salinity tolerance QTL, reducing
the cost of experiments, shortening the time and rapidly applying in practice.
3.2. Practical Significance
The success of Saltol transfering into Bac Thom 7 based on molecular breeding will be widely
applied for rice molecular breeding.
The improved Saltol salinity tolerance of Bac Thom 7 lines would be selected and grown in a
larger scale, especially for the coastal areas in the north of Viet Nam, where the most adversed
influence from the climate change are.
The most other significance of the current thesis was to simultaneously develop the salinity
tolerance line/variety with the highest genetic background of the Bac Thom 7 and carried the Saltol
QTL. The newly improved lines would grow well in the salt areas.
4. Plant materials and the Scope study of thesis
4.1. Plant materials to study
The inbred rice varieties carrying the salinity tolerance (Saltol) which were imported from the
IRRI, and the inbred rice varieties are popularly grown in Vietnam, as well as using the related
molecular markers in the current study.
4.2. Places and time to conduct experiments
The experiments were carried out at the Molecular Biology Division, Agricultural Genetics
Institute, (Tu Liem, Hanoi); and the Center of Technological Exchange and Extension (Thanh Tri,
Hanoi), and Giao Thuy, Nam Dinh Province.
Time period: From 2010 to 2013
5. Significant Contribution
Application of molecular assisted backcrossing (MABC) is one of the initial research to
improve Bac Thom 7 with salinity tolerance for growing in the coastal areas of Red River Delta.
Applying MABC method which can be transferred the target gen/QTL in the other variety via
2-3 generations, while, traditional backcrossing has needed about 8 breeding generations
3
Application of molecular assisted backcrossing could pyramid the saltol into Bac thom 7
which also has carried the enough desire traits of Bac Thom 7, but can be grown in the salinity
affected areas upto 6 ‰
6. Structure of the Thesis
The current thesis was presented by 159 pages, of which included 25 Tables and 31 Fingures,
and separated into 4 chapters: Chapter I: An overview (50 pages), Chapter II: Materials and Methods
(15 pages); Chapter III: Results and Discussion (88 pages); Chapter IV: Conclusion and Suggestions
(2 pages). One hundred and ten literature references were used to cite for this thesis, in which there
are 23 Vietnamese references and 89 English reference and 16 link webpage were also used.
4
CHAPTER I
OVERVIEW AND SCIENTIFIC BACKGROUND
1.1. The adversed impacts from climate change to worldwide agricultural production and
Vietnam
1.1.1. Adversed effects from climate change to worldwide agricultural production
According to the report of FAO (2010), over 800 million ha of cultivated areas have been
affected by salinity and 20%, approximately 45 million ha, have been also affected due to salinity
penetration at different levels [38]. In Asia, if sea level rise will be at 1m, approximately 10.000 km2
cultivated and fishery areas will be influenced and become the salinity swarmp.
1.1.2. The effects of climate change to agricultural production in Vietnam
Vietnam is among the most influenced by sea level rise. The scientists reported that when the
sea level rise, some cultivated areas in Cuulong delta and Red River delta and some other coastal
delta will be inundated by sea water, and the sea level rise will be more increase, the most effected
areas will be Red River delta and Cuulong delta.
1.2. Salt affected land and salt affected areas in Vietnam
1.2.1. Salt affected land
The land consists of 50-60% ratio of argillaceous. The land shows high tight level and poor
absorbent level, tought patter, and chapped and difficult to do tillage.
Because the salt land is composing of much Na+ under the NaCl dissovel, thus, the pressure of
Na
2
SO4 endosmosis is so high that can be influenced to water and nutrition absobtion of the plant.
Also, neutral and alkali in salt land are causing low activation of the microoganism
1.2.2. General introduction of the rice field affected salinity in Vietnam
Accoring to Hoang Kim and Bien and Howeler (2003), in Vietnam, there are two larger rice
field affected salt is: Red River Delta included some sub-area such as Thai Binh, Hai Phong, Nam
Dinh, Ninh Binh, while approximately 1.8 to 2.1 millio ha of land have been affected by salinity
where are located in Ca Mau, Bac Lieu, Ben Tre, Kien Gian, Tien Giang, Tra Vinh and Soc Trang
Provinces. Most of cultivated land areas have been affected salinity and alum and flooding [4].
1.3. Genetic reseaches on salinity tolerance of rice
1.3.1. Mechanism of salinity tolerance of rice
• Phenomenom of salt prevention • Phenomenom of leaf to leaf patition
• Phenomenom of re-absorbance • Tolerance ability by the tissues
5
• Moving from root to bud •Dillution influence
1.3.2. Genetics of Salinity tolerance
1.3.2.1. Reseach on genetics of quantitative traits of salinity tolerance
According to Mishra et al (1998), the trait of salinity tolerance in plant is polygenic trait,
negligible causing effect from the parental plant (recipient plant) because these genes are not located
in the cytoplasm [72]. During development stage of rice, the plant height, and rice production under
salt affection are controlled by the additative genes (Mishra et al 1990)[73].
1.3.2.2. Research on salinity tolerance at molecular level
Based on the QTL mapping, salinity tolerance is controlled by multi-genes. Some markers such
as AFLP and STS have been used, the major gene has been identified and located on the chromosome
1 and named as Saltol. The QTL (quantitative trait loci) mapping has been applied in case of the
target gen has been controlled by many genes (example as salinity tolerance trait)
1.3.3. Expression of salinity tolerance of gene
Based on the morphological, physiological and biochemical characteristics of the experiment, we
have observed the present of Saltol-rice varieties and the sensitive rice varieties (without Saltol)
1.4. Molecular markers and their application
1.4.1. Molecular marker
Molecular markers (or DNA markers) are polymorphic markers. They are included the
molecular flow of DNA or the sequence information which are available and transiting in the
database or internet (for example, sequence of primers SSR, STS, RAPD, AFLP ).
1.4.2. Some popular markers-use
RFLP marker ((Restriction Fragment Length Polymorphism)
RAPD, AFLP, STS marker
SSR (Simple sequenced repeat)
1.4.3. Some applications of molecular markers
1.4.3.1. Study on genetic diversity
Research on genetic diversity is very important to help to evaluate the plant germplasm, animals and
use them more efficiency. Especially, it is possible to estimate the hererosis between the parents (the
pairs of parents carrying higher the genetic distance which could obtain more the heterosis properly.
1.4.3.2. Studying on genetic mapping
Application of molecular markers in QTL linkage mapping, has been applied the statistical analysis which
could identify the linkage between the markers and gen loci (Quantitative trait loci). QTL mapping included
6
the architecture of genome mapping which could be useful to search for relationship between the traits and
the polymorphic markers, and provide the close distance between QTL and markers, respectively.
1.4.3.3. Studying on plant breeding
Along with the advanced development of molecular breeding technologies, the breeders have paid more
attention to the issue as Marker assisted selection (MAS), has implied to use the markers that have linkage
with the interested QTL/genes in plant breeding programe
1.4.4. Application of Marker assisted backcrossing (MABC)
MABCis an a practical and efficient technique in transferring the interested QTL/gene into the elite rice
variety to generate the improved rice variety in a short time carrying the desire QTL/gene and attain
approximately 100% genetic background of the elite rice variety: The breeding programe may only
implement at the BC3 or even thought in BC2 generation, respectively.
1.5. Some archievements in improving rice salinity tolerance
1.5.1. Some results and archivements in research on rice salinity tolerance in the world
During the year 1977 to 1980, International Rice Research Institute (IRRI), was successfully
selected the good rice salinity tolerance such as IR42, IR4432-28-5, IR4595-4-1, IR463-22-2, and
IR9884-54-3 with the yield at 3,6 tones/ha. Gregorio et al (2002)[45] developed TCCP226-2-49-B-B-
3 rice cultivar with high salinity tolerance ability.
Some local rice varieties which were derived in the East Asia have often been high salinity tolerance
such as Nona Bokra (India), Pokkali (Sri Lanka), Getu (India), SR26B, Damodar, Cheriviruppu, Pat
and Solla (India), Ketumbar (Indonesia), Khao Seetha (Thailand). Some rice varieties were in the
template (subtropical countries) such as Harra (Spanish), Agami (Egypt), and Daeyabyeo (Korea).
Several Japonica rice varieties such as Moroberekan have high salinity tolerance, which were
origined in the affected salt areas. This variety has been researched and used as the donor plant
(salinity tolerance) and population mapping (Kim et al, 2009)[55]. The rice varieties were Oryza
glaberrima, which are mostly grown in the West African show lower salinity tolerance ability to
compare with the rice varieties (Oryza sativa) (Awala và cs, 2010)[2].
Recently, in 2013, researchers in IRRI have successfully developed the high-super salt
tolerance that could be very useful for the farmers to grow this rice cultivar in the affected salt areas
such as the coastal areas.
1.5.2. Application of molecular markers in improving salinity tolerance of rice
The fine mapping of Saltol QTL was made on the chromosome 1 by the researcher groups
(Gregorio 1997; Bonille et al 2002; and Niones 2004) which explained about 40-65% salinity
7
tolerance in rice [44][28][85]. Mohammadi – Nejad et al (2010) used 33 SSR polymorphic markers
on the chromosome 1 “Saltol QTL” in order to identify the linkage and the utinity of the markers for
rice breeding [76].
1.5.3. Some results and archivements of research on salinity tolerance of rice in Vietnam
1.5.3.1. Use of the SSR markers which have tightly linked to Saltol QTL in rice breeding
Application of molecular markers and anther culture to improve salinity tolerance of rice were
conducted, total 72 rice lines were generated by anther culture (Lang et al, 2008). Also, Buu et al
(2000) used 30 SSR markers to map the salinity tolerance trait in the F3 generation that including 257
segregation population from the crossed between IR28/Đoc Phung.
1.5.3.2. Improving the rice salinity tolerance
Đo Huu At (2005) made mutation by Coban (Co
60
) to generate CM1, CM5, [1]. Also, Dang
Minh Tam et al (2003), reported that 10 rice line were developed from the local and high yield rice
cultivars, shown a medium salt tolerance (3-5 point). Moreover, they showed high regenerative
percentage in the NaCl culture at 1,0 and 1,5% [35]. Ngo Dinh Thuc (2006) applied the anther culture
technique to create 8 soma variation liné from the OM576, IR64, Basmati and VD20 which could
withstand salinity tolerace at 5 level at the test of rice seeding with EC = 12 dS/m [19].
1.5.3.3. Screening salinity tolerance of rice
From 1992 – 1995, Institute of Southeast Agriculture and Science reported that 14 potential
rice cultivars involving salinity tolerance were selected as the following: Nep ao Gia; Trang Diep;
Mong Chim; Mong Chim Roi; and Nep Bo Rieng [8]. Also, Cuulong Rice Research Institute has
reported to attain 30 rice lines with promising in salinity tolerance as from 2000 to present. The Field
Crops Research documented that M6 is a salinity tolerance which obtained from the crossed Bau Hai
Phong/1548 during the year of 2001-2005.
8
CHAPTER III
MATERIALS, CONTENTS AND METHODS
2.1. Materials
The rice materials included:
Total 14 rice lines/varieties carrying Saltol QTL salinity tolerance were imported from
IRRI and some popularly grown rice varieties in Red River Delta
Chemical argents and research facilities:
SSR markers used: 447 markers
Research instruments: Experimental tools of Agricultural Genetics Institute
2.2. Areas to conduct experiments
The Laboratory of Molecular Biology Division-Agricultural Genetics Insititute. Tuliem-Hanoi
The Net house and paddy fields conducted for experiment at the Center of Technology
Exchange and Extension, Vinh Quynh, Thanh Tri, Hanoi
Experiments for evaluation of growth and development of the imported rice lines/varieties
were conducted in two provinces: Nam Dinh and Hanoi
Perious to implement: From 2010 to 2013
2.3. Contents
2.3.1. Content 1: Research, evaluation of the salinity tolerance and agronomical traits, rice yield and
some sub-traits involving in rice yield of the Salton-lines/varieties imported from IRRI and some
popularly grown in the Red River Delta. It has been an important for further research on rice salinity
tolerance for the coastal areas in North Vietnam
2.3.2. Content 2: Application of marker assisted backcrossing to transfer the Saltol QTL into
Bacthom 7, an elite rice cultivar
2.3.3. Content 3: Evaluating some main agronomical traits and several components involving in rice
yield traits, salinity tolerance level, rice quality of the lines carrying Saltol QTL in the net house and
the paddy field test
2.4. Methods
* MABC (Marker Assisted Backcrossing) to improve salinity tolerance of rice
2.4.1. Methods to conduct field test
2.4.2. Methods for evaluation of salinity tolerance of rice: Screening in the artificial conditions.
2.4.3. Methods to implement experiments in the laboratory
9
2.5. Field test of the improved rice varieties
2.6. Statistical Analyses
Field experiements (observation and evaluation…) were analysised by IRRISTAT 5.0;
Cropstat7.2; Statistic 8.2, Excel 2007.
Technical of data analysis in laboratory was carried out following the Graphical genotypes 2
(GGT2.0) and the other stasistical programes.
Evaluating the parental materials was followed IRRI methods IRRI and Suprihatno, 1980. All
data were documented in Excel and analysised by Graphical Genotyper (Van Berloo, 2008). Each
SSR and alen relationship were recorded as homozygous to the recipient plant is “A” and homozyous
to donor plant is “B” and heterzyous is “H”, respectively.
CHAPTER III
RESULTS AND DISCUSSION
3.1. Evaluation of the initial rice plant materials for improving salinity tolerance in rice
3.1.1. Evaluating salinity tolerance level of the rice lines/varieties in the artificial condition
The results of screening the rice cultivars with salinity tolerance. 6g/l NaCl was added in the
Yoshida as shown in the Table 3.1.
Table 3.1. Artificial screening for salinity tolerance of rice varieties after 2 weeks with 6g/l
NaCl (EC=12dS/m)
No
Line/variety
Effect after 2 weeks treated NaCl 6‰
Effect after 3 weeks treated NaCl 6‰
Rep 1
Rep 2
Rep 3
Aver
Rep 1
Rep 2
Rep 3
Aver
1
IR72046-B-R-8-3-1-3
3
5
3
3.7
7
5
5
5.7
2
IR52713-2B-8-2B-1-2
3
3
3
3.0
7
5
7
6.3
3
IR77674-3B-8-2-2-AJY5
3
3
3
3.0
5
5
7
5.7
4
NSIC Rc 106
3
3
5
3.7
7
7
7
7.0
5
IR45427-2B-2-2B-1-1
3
5
3
3.7
7
7
5
6.3
6
IR55179-3B-11-3
3
3
3
3.0
7
5
7
6.3
7
IR65196-3B-5-2-2
5
5
3
4.3
7
7
7
7.0
8
IR74099-3R-3-3
3
3
3
3.0
7
5
5
5.7
9
IR 4630-22-2-5-1-3
3
5
3
3.7
5
7
7
6.3
10
FL478
1
1
3
1.7
3
3
3
3.0
11
Bac thom 7
5
7
7
6.3
9
7
9
8.3
12
Khang dan 18
7
7
7
7.0
9
9
9
9.0
13
Pokkali (salinity tolerance )
1
1
3
1.7
3
1
3
2.3
10
14
IR29 (Sensitive)
7
9
7
7.7
9
9
9
9.0
3.1.2. Evaluation of the growth and development of the imported rice varieties in the natural
condition
3.1.2.1. Results of evaluating the ability of growth and development of some imported rice varieties
at Thanh Tri, Hanoi, 2010
Table 3.3. Agronomical traits and morphological of the rice varieties used in the study at Thanh Tri, Hanoi -
2010
No
Line/variety
Days to heading (day)
Plant height (cm)
Panicle length (cm)
Spring
Summer
Spring
Summer
Spring
Summer
1
IR72046-B-R-8-3-1-3
139
115
96.0
e
96.3
h
24.2
ab
23.0
cd
2
IR52713-2B-8-2B-1-2
127
115
109.0
c
110.0
c
24.5
a
25.0
a
3
IR77674-3B-8-2-2-AJY5
155
130
109.0
c
110.0
c
24.0
ab
24.0
b
4
NSIC Rc 106
136
105
92.3
g
92.3
j
22.7
bc
23.0
d
5
IR45427-2B-2-2B-1-1
150
120
92.5
g
94.0
i
23.5
bc
22.3
e
6
IR55179-3B-11-3
145
120
113.0
b
115.3
b
23.7
c
24.0
b
7
IR65196-3B-5-2-2
145
130
115.3
a
115.7
b
22.7
d
24.0
b
8
IR74099-3R-3-3
135
120
94.3
f
98.0
g
24.3
ab
23.3
cd
9
IR 4630-22-2-5-1-3
142
115
113.0
b
106.3
e
21.3
d
20.3
f
10
FL478
135
120
103.3
d
102.3
f
20.3
e
20.7
f
11
Pokkali
-
135
-
182.7
a
-
23.7
bc
12
Bac thom 7(control)
135
125
112.0
b
107.3
d
22.0
d
21.7
e
CV (%)
0.47
0.46
2.04
1.63
LSD
0.05
0.84
0.87
0.8
0.63
3.1.2.2. Results of evaluation of the growth and development of some imported rice varieties grown
in Gia Thuy, Nam Dinh in 2010
Table 3.5. Several agronomical traits and morphology of the rice varities grown at Giao Thuy,
Nam Dinh Province in 2010
No
Line/variety
Days to heading (day)
Plant height (cm)
Panicle length (cm)
Spring
Summer
Spring
Summer
Spring
Summer
1
IR72046-B-R-8-3-1-3
135
120
98.3
ef
96.0
efg
24.3
ab
23.3
bc
2
IR52713-2B-8-2B-1-2
128
110
111.0
cd
110.7
bc
24.3
ab
25.7
a
3
IR77674-3B-8-2-2-AJY5
160
134
110.7
cd
105.0
cde
23.3
abc
23.0
bcd
4
NSIC Rc 106
140
110
95.0
f
87.7
g
22.3
bcd
22.7
cd
5
IR45427-2B-2-2B-1-1
152
125
94.0
f
92.0
fg
23.3
abc
22.3
cd
11
6
IR55179-3B-11-3
142
130
113.3
bc
113.7
bc
24.0
abc
24.3
ab
7
IR65196-3B-5-2-2
142
125
119.0
b
115.0
b
23.3
abc
23.0
bcd
8
IR74099-3R-3-3
140
115
98.7
ef
92.3
fg
25.3
a
22.7
cd
9
IR 4630-22-2-5-1-3
140
112
116.3
bc
108.0
bcd
21.7
cd
19.8
f
10
FL478
132
115
105.0
de
99.0
def
20.7
d
20.7
ef
11
Pokkali
-
140
-
188.7
a
-
25.3
a
12
Bac thom 7(control)
135
120
111.0
cd
115.0
b
21.7
cd
22.0
cde
CV (%)
4.17
5.14
6.08
3.67
LSD
0
,
05
7.88
9.54
2.38
1.41
3.2. Application of Marker assisted backcrossing to improve salinity tolerance of Bac Thom 7
3.2.1. Results of identification of parental plants to improve QTL Saltol rice line
In order to improve salinity tolerance of rice varieties grown in the Red River delta, we have
used Marker assisted backcrossing method to transfer QTL Saltol into the receipient plant, but
attaining its agronomical traits such as quality of rice. Based on the obtained results, the Bac Thom 7
is the variety that need to be improve salinity trait and used as the receipient Saltol material.
3.2.2. Resukts of applying Marker assisted backcrossing to pyramid QTL saltol into BT7
3.2.2.1. Identification of the markers linked with Saltol and polymorphic markers between BT7 and
FL478
In this study, total 30 markers at the target gene of Saltol were used to identify the linkage markers
between the donor and receipient plants. Fifteen polymorphic markers between the parental plants at the target
gen were AP3206, RM3412b, RM10748, RM493, RM140, RM10825. G1a, G6a, G11a, Salt 4a, SCK1b,
SCK1d, SCK2, SCK10, and SCK10a. The information of the polymorphic markers have shown in the Figure
3.2 and Figure 3.5
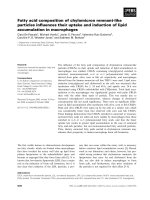
Figure 3.2. Polymophic markers between BT7 and FL478 with 3 markers as
RM493, RM3421b and RM140
Note:: P1: Bacthom 7; P2: FL478
12
Figure 3.4. Position of QTL/gen Saltol located on the chromosome 1
3.2.2.2. The results of identification of polymorphic markers that were out of QTL Saltol region
between BT7 and FL478 on the 12 chromosomes
To identify the polymorphic markers which were located out of region of Saltol on the 12
chromosomes for determining the genetic background of the selected individual plants from the
crossed population. Total 447 SSR markers were used to screen to find out the polymorphic markers,
102 polymophic markers were identified (accounted for 21,38%) between Bacthom 7 and FL478
Figure 3.7. Results of the polymorphic markers between BT7 and FL478
Note:: P1: Bac Thom 7; P2: FL478
13
Figure 3.8. The map of polymorphic markers between FL478 and BT 7 on the 12 chromosomes
Note: The order of markers presents on the left of the chromosomes, the position of polymorphic
markers were on the right of the chromoshomes. The black regions present the Saltol locus. The
order and position of the markers were established on the Nipponbare map (TIGR v. 3
pseudomolecules available at www.gramene.org and atsliver.plbr.cornell.edu/SSR).
3.2.3. Results of improving salinity tolerance of BT7 by marker assisted backcrossing
3.2.3.1. Developing F1 from the crossed combination FL478/BT7
In this experiment, the polymorphic marker RM7643 to screen the individual plant F1. The
result showed that 17/20 individual plants of F1 were heterozygote (H).
Figure 3.10. Result of electrophoresis of RM7643 marker
BT: Bac thom 7; FL: FL478; A: BT7; H: heterozygote, 1-20: the individual plants of F1
After selected 17 individual plants were heterozygote between FL478 and Bac thom 7, the
backcross was conducted with BT7 to develop BC1F1.
3.2.3.2. Results of selecting the individual plants in the population of BC1F1 by molecular markers
To identify the individual plants which were carrying the target gene Saltol in the crossed off-
spring, it was identified 15 markers AP3206, RM3412b, RM10748, RM493, RM140, RM10825, G1a,
G6a, G11a, Salt 4a, SCK1b, SCK1d, SCK2, SCK10, and SCK10a which were shown linked with Saltol
and polymorphism between BT7 and FL478. Also, in this experiment, our results were 2 flanked
markers RM493 and RM3412b which were closely linked with Saltol as the successful use of IRRI to
select the individual plants carrying Saltol.
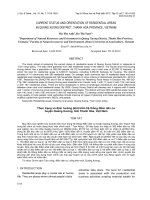
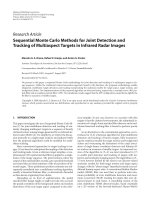
Figure 3.10. Results of electrophothesis on 94 individual plants of BC1F1( RM493 markers).
From 1-94 the individual plants BC1F1, BT7: Bac Thom 7, FL: FL478 A: Bac Thom 7, B:FL478,
H: Heterozygote
14
Figure 3.11. Results of electrophothesis on 94 individual plants of BC1F1 (RM3412b
markers).
From 1-94 the individual plants BC1F1, BT7: Bac thom 7,FL: FL478 A: BT7, B:FL478, H:
Heterozygote
Combination of 2 markers namely RM493 and RM3412b, 14 individual plants have been
screened to carry Saltol as the plant number: 5, 10, 11, 14, 19, 28, 29, 32, 36, 42, 45, 50, 71, 83.
3.2.3.3. Results of selecting the individual plants in the BC2F1 population by applying molecular
markers
-Results of selection of the individual plants carrying locus Saltol in the BC2F1 population
In this experiment, the successfully crossed 141 individual plants in BC2F1. To identify the individual
plants carrying Saltol in the population of BC2F1, two closely linked markers with Saltol as RM493
and RM3412b were consecutively used to select the individual plants that carrying the target gen. The
results of selection of the individual plants carrying Saltol were shown in the Figure 3.13 and 3.14.
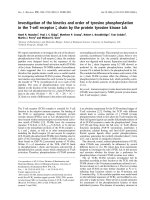
Figure 3.13. Results of electrophoresis of 141 individual plants from BC2F1 (RM3412b)
From 1-141, the individual plants BC2 F1- BT7:BT 7; FL: FL478; A: BT 7; B:FL478; H: Heterogyzote
Figure 3.14. Results of electrophoresis of 141 individual plants from BC2F1 (RM493)
From 1-141, the individual plants BC2 F1, BT7: BT 7,FL: FL478 A: BT 7, B:FL478, H:Heterogyzote
The results of selection of the individual plants which have been carrying the target gen by
applying markers RM3412 and RM493, we have selected 34 individual plants as the plant number: 1,
2, 7, 9, 11, 13, 15, 22, 23, 24, 30, 34, 36, 42, 45, 47, 51, 53, 57, 59, 60, 65, 74, 77, 81, 92, 93, 94, 96,
112, 114, 117, 136, 141.
- Evaluation of the background of the individual plants carrying Saltol in the BC2F1 population
Results of identifying the individual plants carrying Saltol and attained the maximum genetic
15
background of BT7 in the BC2F1, total 43 polymophic markers which have not linked in the regions
of Saltol on the chromosomes to select background of the receipient plant.
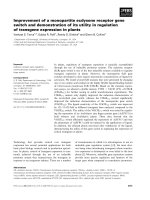
Figure 3.20. Statistical analysis of GGT2 for 10 individual plants carrying Saltol trong in the
population of BC2F1
Figure 3.21. Statistical analysis of GGT2 for 10 individual plants on the 12 chromosomes
As shown in Figure 3.20 and Figure 3.21, it was identified the plant number 8 (similar with
the plant number 57 in the population BC2F1) that has the highest genetic background upto 80.7%
Figure 3.22. Genetic map of the plant number 8 to analyse by GGT2 software
3.2.3.4. Results of selecting the individual plants in the population of BC3F1 by applying
molecular markers
To identify the individual plants carrying the targeted gene in the population of BC3F1, 2 previous
markers RM493 and RM3412b have been used to select the individual plants carrying Saltol.
16
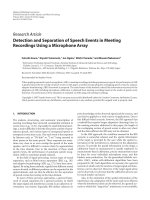
Figure 3.23. Results of electrophoresis for 369 individual plants of BC3F1(RM3412b)
From 1-369 the individual plants BC3 F1, BT7: BT 7,FL: FL478 A: BT 7, B:FL478, H: Heterogyzote.
Figure 3.24. Results of electrophoresis of 369 individual plants from BC3F1 (RM493)
To identify the individual plants carrying Saltol in the population of BC3F1 by using 2
markers RM493 and RM3412, total 115 individual plants have obtained: 6, 7, 8, 10, 14, 16,
18, 22, 28, 29, 30, 32, 35, 36, 38, 41, 42, 45, 50, 54, 63, 64, 65, 70, 72, 73, 74, 75, 80, 82,
83, 84, 94, 101, 102, 109, 111, 112, 116, 122, 123, 135, 148, 157, 158, 166, 169, 174, 176,
178, 184, 188, 190, 192, 194, 197, 198, 200, 211, 215, 217, 218, 221, 234, 233, 237, 238,
246, 248, 254, 257, 259, 260, 263, 270, 273, 274, 275, 276, 277, 284, 289, 290, 293, 300,
302, 304, 305, 306, 307, 308, 310, 311, 312, 313, 314, 315, 317, 320, 324, 331, 332, 333,
335, 336, 344, 345, 351, 353, 357, 358, 359, 361, 366, 367.
Among 115 individual plants carrying Saltol to identify by use of 2 markers RM493 and
RM3412, 88 individual plants were to backcrossed as accounted from the individual plants
number 8 (in the population of BC2F1).
* Evaluation of the genetic background of the individual plants carrying Satol in the population of
BC3F1
17
To identify the genetic background of the individual plants carrying Saltol in the
population BC3F1, only 88 individual plants which were developed from the plant number 8
(genetic background 80,7% of BC2F1).
Figure 3.29. Satistical analysis of genetic background of 88 individual plants from BC3F1 on 12
chromosomes by use of GGT1
As the result shown in Figures 3.30; 3.31, it was identified two individual plants number 30
and 32 which have had the highest genetic background 99,3% and 100% as the BT7.
Figure 3.30. Genetic map of individual plant number 30
Figure 3.31. Genetic map of the individual plant number 32
Note that figures 3.30 and 3.31: The numberal chromosomes were expressed the below
number, and the list of markers used to screen the genetic background was on the left side, equivalent
with position of marker that was on the right of chromosome. Red region was indicated genetic
18
background of BT7 and marker position was established-based on the statistical analysis of GGT2.0
3.3. Evaluation of some main agronomical traits, component of yield and salinity tolerance of
the improved rice lines carrying QTL/gen Saltol in the net house and paddy field
3.3.1. Results of evaluation of some agronomical traits and yield components of BT7-Saltol in
the net house
In the generation of BC3F1, 2 individual plants have been selected as the plant number IL-30 và
IL-32 from the crossed combination of BC3F1 which attained the highest genetic background of BT7
as 99,3% and 100%, respectively. IL-32 was grown in the net house condition to develop BC2F2 for
analysis and evaluation of its phenotype. Applying of MAS to select the individual plants to select 30
plants which have shown homogygote at locus markers RM1287, RM8094 which closely linked with
QTL/gen Saltol (as the numbered from 1-30), each individual plant has been selfing to develop 30
different lines, to observe the growth and development, yield components to compare with BT7 as the
control
Table 3.17. Growth indicator and morphological characteristics of BT7- Saltol lines (BC3F2) in
the Spring season crop 2012 at Thanh Tri, Hanoi
No
Name
DTH
(days)
Plant height
(cm)
Panicle
length (cm)
Panicle
exsertion
(cm)
Ear/panicle
(ear)
Color awn
1
IL32-1
135
112.9
jk
20.6
bcde
2.9
ef
10.7
hi
Light yellow
2
IL32-2
135
111.2
mn
20.7
de
2.9
bcdef
10.4
i
Light yellow
3
IL32-3
135
113.2
hijk
20.5
de
2.7
f
10.7
hi
Light yellow
4
IL32-4
135
111.5
lm
19.4
f
2.6
f
11.7
cdefg
Dark yellow
5
IL32-5
135
114.2
efgh
20.6
de
3.2
a
12.1
a
Light yellow
6
IL32-6
135
109.5
o
20.5
de
3.5
a
10.4
hi
Light yellow
7
IL32-7
135
117.9
a
21.5
bcd
2.8
f
10.4
hi
Light yellow
8
IL32-8
135
113.2
ghijk
20.4
de
2.9
cde
10.4
hi
Light yellow
9
IL32-9
135
116.9
b
20.4
de
3.3
ab
10.7
ghi
Light yellow
10
IL32-10
135
111.5
mn
29.7
a
3.0
abcde
11.7
efghi
Brown
11
IL32-11
135
113.2
ijk
21.2
ab
3.3
ab
12.1
ab
Dark yellow
12
IL32-12
135
114.5
ef
20.4
de
3.3
ab
11.1
defghi
Light yellow
13
IL32-13
135
115.2
cd
20.4
ef
3.0
ab
10.7
hi
Light yellow
14
IL32-14
135
114.2
ef
21.0
bcde
3.0
abc
11.1
fghi
Light yellow
15
IL32-15
135
113.5
fghi
21.4
bcde
3.3
ab
12.1
abc
Dark yellow
16
IL32-16
135
111.9
lm
21.1
bcde
2.8
cde
11.4
abcdef
Light yellow
17
IL32-17
135
108.9
o
20.5
de
2.6
ef
12.1
abc
Light yellow
19
18
IL32-18
135
113.9
hijk
20.5
de
3.2
abc
11.7
bcdefg
Light yellow
19
IL32-19
135
113.9
ijk
20.7
de
3.0
ab
11.7
abcde
Light yellow
20
IL32-20
135
113.9
hijk
21.9
bc
3.1
abcd
10.4
hi
Light yellow
21
IL32-21
135
113.2
hijk
20.9
cde
3.1
abc
10.1
hi
Dark yellow
22
IL32-22
135
111.2
n
21.9
bcd
3.1
ab
12.1
ab
Dark yellow
23
IL32-23
135
116.9
ab
20.7
de
3.4
a
12.1
abcd
Light yellow
24
IL32-24
135
114.5
de
20.9
de
2.7
f
11.1
bcdefg
Light yellow
25
IL32-25
135
117.2
a
21.7
bcd
3.4
a
11.7
defghi
Brown
26
IL32-26
135
114.2
efg
21.0
bcd
3.2
a
12.7
abcd
Brown
27
IL32-27
135
113.2
hijk
20.2
de
2.8
def
11.7
bcdefg
Light yellow
28
IL32-28
135
112.9
kl
21.5
bcde
3.4
a
12.1
abcd
Light yellow
29
IL32-29
135
116.2
bc
19.8
f
2.8
ef
12.1
abc
Light yellow
30
IL32-30
135
113.2
fghij
21.5
bcde
2.8
ef
10.4
hi
Brown
BT7
(control)
135
116.2
bc
21.2
bcde
3.1
abcde
11.6
abcdef
Light yellow
CV (%)
0.48
2.3
9.82
4.13
LSD5%
0.89
0.79
0.49
0.77
3.3.2. Evaluation of salinity tolerance of BT7-Saltol line (BC3F3) in the artificial conditionKết
Table 3.19. Evaluation of salinity tolerance (after 3 weeks) of some individual plants BT7 –
Saltol (BC3 F3)- Summer crop in 2012
No
Name
No of plant
survivor
(plant)
Percentage of
plant suvivor
sống (%)
Point
Evaluation
1
IL32-1
16.3
81.5
3-5
Tolerance
2
IL32-2
17.7
88.5
1-3
High tolerance
3
IL32-3
15.3
76.5
3-5
Tolerance
4
IL32-5
15.7
78.5
3-5
Tolerance
5
IL32-7
17.3
86.5
1-3
High tolerance
6
IL32-8
17.3
86.5
1-3
Tolerance
7
IL32-9
16.0
80.0
3-5
Tolerance
8
IL32-12
16.3
81.5
3
Tolerance
9
IL32-13
17.3
86.5
1-3
High tolerance
10
IL32-14
17.7
86.5
1-3
Tolerance
11
IL32-15
16.3
81.5
3
Tolerance
12
IL32-16
17.3
86.5
1-3
High tolerance
13
IL32-17
17.3
86.5
1-3
High tolerance
20
14
IL32-18
17.7
88.5
1-3
High tolerance
15
IL32-19
16.7
83.5
3
Tolerance
16
IL32-20
15.7
78.5
3-5
Tolerance
17
IL32-23
15.3
71.5
3-5
Tolerance
19
IL32-28
17.7
86.5
1-3
High tolerance
20
IL32-29
17.7
86.5
1-3
High tolerance
BT7(control)
3.0
1.5
7-9
Tolerance
FL478(cho gen)
17.0
85.0
1-3
High tolerance
Pokkali (chuẩn kháng)
17.3
88.5
1-3
High tolerance
Cv%
0.37
0.45
Thus, evaluation of the growth and development and salinity tolerance in the artificial condition of
the individual plants of BT7 - Saltol showed that most of the carried QTL/gen Saltol that shown in
the laboratory exhibited good growth and development to compare with the controlled variety.
3.3.3. Results of evaluation of some agronomical traits of the BT7- Saltol (BC3F3) under the
paddy field.
21
Tabe 3.20. Indicators of some growth and development of some BT7–Saltol lines (BC3F3) in the summer crop in 2012 tại
at Giao Thuy, Nam Dinh province
No
Name
DTH
(days)
Leaf green
level
(point)
Blade
pubescence
(điểm)
Plant
height
(cm)
Growth habit of plant
(điểm)
Panicle
length (cm)
Panicle
exsertion
(cm)
Chiều dài lá
đòng
(cm)
Awn color
1
IL32-1
112
5
5
109.2
3
22.5
5.4
33.5
Light yellow
2
IL32-2
112
5
3
111.8
3
21.0
7.7
29.1
Light yellow
3
IL32-3
112
3
3
107.9
3
20.8
5.3
27.8
Light yellow
4
IL32-5
112
5
3
106.7
5
22.1
5.3
32.0
Light yellow
5
IL32-7
112
5
5
105.3
3
20.9
6.8
28.6
Light yellow
6
IL32-8
112
3
5
106.0
5
22.3
9.3
33.6
Light yellow
7
IL32-9
112
3
1
110.4
3
21.3
14.0
27.8
Light yellow
8
IL32-12
112
7
3
104.3
3
21.0
6.0
28.0
Light yellow
9
IL32-13
112
5
3
110.3
5
22.0
6.3
28.0
Light yellow
10
IL32-14
112
5
5
104.4
1
22.1
7.6
30.0
Light yellow
11
IL32-15
112
5
5
98.7
3
21.2
6.0
30.1
Light yellow
12
IL32-16
112
7
3
107.9
3
22.8
6.8
31.4
Light yellow
13
IL32-17
112
5
3
105.6
1
22.1
8.0
33.8
Light yellow
14
IL32-18
112
3
3
101.0
1
21.0
4.8
25.8
Light yellow
15
IL32-19
112
7
1
101.9
3
23.0
5.4
31.4
Light yellow
16
IL32-20
112
5
5
104.2
3
23.2
6.0
28.6
Light yellow
17
IL32-23
112
5
3
100.1
1
23.5
4.4
26.4
Light yellow
19
IL32-28
112
3
3
97.2
3
19.8
5.2
23.5
Light yellow
20
IL32-29
112
5
5
99.9
3
20.6
5.0
25.9
Light yellow
BT7
112
5
3
104.2
3
21.5
6.7
25.3
Light yellow
Cv%
4.22
1.00
2.31
2.89
22
In terms of days to heading between the lines that shown the high similarity and were as the
BT7 as the control variety is 112 days. The plant heigh was arranged from 97,2 to 111,8. The line
number 2 showed the highest the height of plant, and the lowest was the line number 5 (97,2). The
lines number 1, 7 and 9 have plant height that were higher than the control by 5-6 cm, the rest of
those were similar with the BT7. However, if based on the variance with value of F-test > 0.05, it
showed that the improved lines indicated no least significance at 95% as shown in Table 3.20.
3.4. Evaluation of some agronomical traits, yield components of the BT7- Saltol (BC3F4) in the
field
Amongst 20 lines of BT7- Saltol (BC3F3), after evaluating and checked salinity tolerance in
the net house, and based on some agronomical traits, yield components, 8 promising lines were
selected such as 1-3-4-9-10-12-13-15 which disclosed higher yield than the controlled BT7 but have
similar agronomical traits of BT7
Table 3.22. Criteria of growth and morphological characteristics of BT7- Saltol (BC3F4) in
Spring crop 2013, Giao Thuy, Nam Dinh province
No
Name
DTH
(days)
Plant height
(cm)
Panicle
length (cm)
Panicle
exsertion (cm)
Flag leaf length
(cm)
BT7(control)
132
113.2
24.0
a
3.9
b
24.8
d
Line 1
IL32-1
132
112.8
22.3
bc
6.0
a
25.9
b
Line 3
IL32-3
132
113.0
21.9
bc
4.6
b
26.1
a
Line 4
IL32-4
132
113.5
21.5
c
4.7
b
23.9
e
Line 5
IL32-5
132
112.9
21.6
bc
4.6
b
25.4
c
Line 9
IL32-9
132
112.7
22.8
b
5.9
a
23.8
e
Line 10
IL32-10
132
114.2
21.7
bc
4.7
b
25.2
c
Line 12
IL32-12
132
114.5
24.1
a
5.6
a
22.4
f
Line 15
IL32-15
132
114.0
22.5
b
5.7
a
25.3
c
CV%
2.74
9.48
0.58
LSD
0.05
1.06
0.43
0.25
As the results shown in Table 3.22, the potential BT7- Saltol lines showed days
to heading that were similar with BT7 (132 days). The plant height of the lines were
ranged about 112,7 cm (line number 9) to 114,5 cm (line number 12). Hence, there is
no significant difference to compare with the BT7 as 113.2 cm.
23
3.5. Results of Rice quality of some BT7 – Saltol lines
Table 3.24. Rice quality of BT 7 – Saltol lines
Name
Miling
revovery
(%)
Head rice
recovery
(%)
Translucent
kernel (%)
amyloza
(%)
Geltinization
temperature
Length
grain
(mm)
Grain
width
(mm)
(D/R)
1 line
69,02
86,87
57,65
15,72
Medium
5,57
2,04
2,73
5 line
69,00
89,22
55,85
17,52
Medium
5,70
1,98
2,88
12 line
68,74
87,28
57,03
17,00
Medium
5,52
1,94
2,84
BT 7 -
(control)
68,96
87,54
56,22
16,02
Medium
5,61
1,97
2,85
Source: Department of Biochemical & Quality of agricultural farming –CLT&CTP, 2013.
As the results shown in Table 3.24: 7- Saltol and BT 7 (control) revealed the similar good
milling recovery (>65%), and head rice recovery >80%. Translucent kernel was measured by Kett
machine after milling and devided into the following group: Good (>50%); medium (35-40%); rather
good (40-50%). Therefore, both the above rice varieties showed good translucent kernel. Size and
type of grain were rather lengthy (length/width 3,0).