Unit:11:SOURCES OF ENERGY
Bạn đang xem bản rút gọn của tài liệu. Xem và tải ngay bản đầy đủ của tài liệu tại đây (153.19 KB, 5 trang )
School :CAO NGUYEN SCHOOL
Class :11E
Instructor :Nguyen Thi Hien Linh
Student Teacher:Nguyen Thi Moc Lan
Date of Teaching:
Unit:11:SOURCES OF ENERGY
SectionD:Writing
I. Objectives
By the end of the lesson students will be able to:
- Interpret and compare data described in chart/ graph/ table form and write
a report of data analysis.
- Understand a chart and know how to describe a chart.
II. Material
Textbook, handout, sub-board and pictures
III. Procedure
Time Teacher’s activities Student’s activities
3’ I.Warm-up:
-gives students some pictures about the
energy and ask them these questions:
+ What do these pictures talk about?
-explains more details if students can
not guess.
-corrects students ‘ answers
- Look at the pictures and give
comments
+ The first picture is about
wasting water power.
+ The second picture is about
exploiting the water power to
make the electricity.
+ The third picture is
10’
III.Prepare students to write
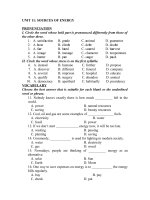
Vocabulary:
_gives some new words to students
_explains by pictures or others
way(nomally directly because
newwords are quite difficult to explain
by synonym)
Task 1:
-asks students to remind how to
interpret data in a table/ graph/ chart.
-gets students to work in pairs to study
the 2000 charts on page 130 by asking
questions like:
+ What is the topic of the chart?
Does it describe the past, the
present, or the future?
+ Which made up the largest
amount of consumption :
petroleum, coal, or nuclear and
hydroelectricity?
+ Which consumption ranked the
second?
+ Which made up the smallest
amount of consumption?
-gets students to do task1:
-gives notes:( delivers handouts)
1. To describe the graph/ chart /a
about how to save the water
power
Vocabulary:
- consumption (n) sự tiêu thụ
- hydroelectricity (n) thủy điện
Task1:
- To understand a chart, it is
important to understand its
topic firstly.
- Pay attention to the time
reported in it. Is it the past,
the present, or the future?
- Work in pairs and discuss:
+ Its topic is about the energy
consumption in Highland in
2000.
+ Petroleum made up the largest
amount of this figure.
+ The second is the consumption
of coal.
+ The smallest amount of energy
consumption is nuclear and
hydroelectricity.
- Do task1:
1. The total energy
consumption was 117 million
tons.( sum up coal, nuclear &
hydroelectricity and
30’
(10’)
table we often have two parts:
+ Introduction:
- answer for the question “ What is
graph about? The date, location.
We have some phrase such as: the
chart shows/ describes/presents….
Ex: The chart shows the energy
consumption in Highland in 2005.
-answer for the question “What is
being described in the graph?”. Some
structures such as: As can be seen from
the chart…or it can be seen in the
chart…
Ex: As can be seen in the chart that
the total energy consumption was
170 million tons.
+ Describing the chart in detail:
decide on the most clear and
logical order to present the
material( from the largest to the
smallest ). We have some
expression like: make up the
largest/ smallest percentage/
proportion ; this is followed
by…,or this ranks first/ second…
Ex: Nuclear and hydroelectricity
made up the largest amount of this
figure( 75 million tons). This was
followed by the consumption of
petroleum ( 50 million tons). Coal
made up a slightly smaller
proportion with 45 million tons.
2. Verb tenses: When the chart
shows the present situation, use the
present simple tense. When it
shows the past events, use the past
simple tense.
III.Writing
Task 2:
Before writing ,teacher asks students
some questions:to help students write
easily:
-What is the topic of the chart?
- Which the consumption ranked the
petroleum).
2. Coal ( look at the chart).
3. Smallest ( 20 million tons).
- Notes(write on the
notebook)
Task 2:
Answer questions in short:
- The energy consumption, in
2005.
- Petroleum
20’
second?
- Which made up the smallest amount
of consumption?
-Uses sub-board
-Asks students to fill in the blank
Task 3:
To describe the chart teacher asks
students to compare the
consumption in 2000 with that in
2005.(difference about the amount
as well as trend of consuming
different sources of energy between
the two years.)
- tell students to use the information
from tasks 1 and 2 and asks students to
wrire a report.
-corrects students’ reports and shows a
model
-uses sub-board as an example so that
students can do the task easily
-Sub-board :
The charts show the energy
consumption in Highland in 2000
and 2005. In general, there was a
difference in the amount as well as
trend of consuming different source
of energy between the two years.
As can be seen, in 2002 the total
energy consumption was 117
million tons. Petroleum made up
- Coal.
- Sub-board:
The chart shows …….in……in
2005. As can be seen in the chart
that the total energy consumption
was….million tons. Nuclear and
hydroelectricity made up
… amount of this figure( 75
million tons). This was followed
by the consumption of petroleum
( 50 million tons). …made up a
slightly smaller proportion with
45 million tons.
Task 3:
- We use the expression indicating
the difference.
Ex: there was a difference in the
amount as well as trend of
consuming different sources of
energy between the two years.
- Do task 3 by taking the
contain of tasks 1 and 2 :
-write the model on the notebook
2’
the largest amount of this figure
(57 million tons). This was
followed by the consumption of
coal (40 million tons). Nuclear and
hydroelectricity made up a slightly
smaller proportion (20 million
tons).
In 2005 more energy was
consumed (170 million tons).Also,
though consumed the least in 2000,
now nuclear and hydroelectricity
made up the largest amount of
consumption (75 million tons).This
was followed by the consumption
of petroleum (50 million tons).Coal
made up a slightly smaller
proportion with 45 million tons.
II. Summarize
The main point of the lesson is the
ways how to describe a chart and
how to arrange a chart in the
logical order.
Homework
Rewrite the chart use the
expression as their handout
Listen
Homework:
Do homework
GIÁO VIÊN HƯỚNG DẪN GIÁO SINH THỰC HIỆN
( Duyệt và ký tên)
Nguyễn Thị Hiền Linh Nguyễn Thị Mộc Lan