Chemistry part 20, Julia Burdge,2e (2009) pot
Bạn đang xem bản rút gọn của tài liệu. Xem và tải ngay bản đầy đủ của tài liệu tại đây (16.48 MB, 26 trang )
474
CHAPTER
12
Intermolecular
Forces
and
the
Physical Properties
of
Liquids
and
Solids
(a) (b)
Figure 12.15 Arrangement
of
identical spheres in a simple cubic cell. (a) Top view
of
one layer
of
spheres. (b) Definition
of
a simple cubic cell.
Primitive cubic Body-centered cubic
Face-centered cubic
Figure 12.16 Three types
of
cubic cells. The top view makes it easier
to
see the locations
of
the lattice
points, but the bottom view is more realistic, with the spheres touching one another.
Figure 12.17 In the body-centered cubic arrangement, the spheres in each layer rest in the depressions
between spheres in the previous layer.
The other types
of
cubic cells, shown in Figure 12.16, are the body-centered cubic cell (bcc)
and the
face-centered cubic cell (fcc). Unlike the simple cube, the second layer
of
atoms in the
body-centered cubic arrangement fits into the depressions
of
the first layer and the third layer fits
into the depressions
of
the second layer (Figure 12.17).
The coordination number
of
each atom in the bcc structure
is
8 (each sphere is in contact
with four others in the layer above and four others in the layer below). In the face-centered cubic
cell, there are atoms at the center
of
each
of
the six faces
of
the cube, in addition to the eight
corner atoms. The coordination number in the face-centered cubic cell is 12 (each sphere is in
contact with four others in its own layer, four others in the layer above, and four others in the layer
below).
Because every unit cell in a crystalline solid is adjacent
to
other unit cells, most
of
a
cell's atoms are shared by neighboring cells. (The atom at the center
of
the body-centered
SECTION 12.3 Crystal
Structure
475
(a) (b)
(c)
Figure 12.18 (a) A comer atom
in
any cell
is
shared by eight unit cells. (b) An edge atom
is
shared
by
four unit cells. (c) A face-centered atom in a cubic cell
is
shared by two unit cells.
cubic cell is an exception.) In all types
of
cubic cells, for example, each corner atom belongs to
eight unit cells whose corners all touch [Figure 12.18(a)].
An
atom that lies on an edge, on the
other hand, is shared by four unit cells [Figure 12.18(b)], and a face-centered atom is shared
by two unit cells [Figure 12.18(c)]. Because a simple cubic cell has lattice points only at each
of
the eight corners, and because each corner atom
is
shared by eight unit cells, there will
be
the equivalent
of
only
one
complete atom contained within a simple cubic unit cell (Figure
12.19]. A body-centered cubic cell contains the equivalent
of
two complete atoms, one in the
center and eight shared corner atoms. A face-centered cubic cell contains the equivalent
of
four
complete
atoms-three
from the six face-centered atoms and one from the eight shared corner
atoms.
Closest
Packing
There is more empty space in the simple cubic and body-centered cubic cells than in the face-
centered cubic cell. Closest packing, the most efficient arrangement
of
atoms, starts with the
structure shown in Figure 12.20(a), which we call layer A. Focusing on the only atom that
is surrounded completely by other atoms, we see that it has six immediate neighbors in its
own layer. In the second layer, which we call layer B, atoms are packed into the depressions
between the atoms in the first layer so that all the atoms are as close together
as
possible [Fig-
ure 12.20(b)].
There are two ways that a third layer
of
atoms can be arranged. They may sit in the depres-
sions between second-layer atoms such that the third-layer atoms lie directly over atoms in the first
layer [Figure 12.20(c)]. In this case, the third layer is also labeled
A.
Alternatively, atoms in the
third layer may sit in a
different set
of
depressions such that they do not lie directly over atoms in
the first layer [Figure 12.20(d)]. In this case, we label the third layer
C.
A
(a)
B
A
(b)
A
B
A
(c)
C
B
A v
"
,
,
(d)
Figure 12.20 (a) In a close-packed layer, each sphere
is
in contact with six others. (b) Spheres in the
second layer
fit
into the depressions between the first-layer spheres. (c) In the hexagonal close-packed
structure, each third-layer sphere
is
directly over a first-layer sphere. (d) In the cubic close-packed structure,
each third-layer sphere fits into a depression that is directly over a depression in the first layer.
Figure 12.19 Because each sphere
is shared by eight unit cells and there
are eight comers in a cube, there
is
the equivalent
of
one complete sphere
inside a simple cubic unit cell.
•
How
Do
We
Know
the
Structures
of
Crystals?
Figure 12.21 An arrangement for
obtaining the X-ray diffraction pattern
of
a crystal. The shield prevents the
intense beam
of
undiffracted X-rays
from damaging the photographic plate.
476
Virtually all we know about crystal structure has been learned from X-ray diffraction studies.
X-ray diffraction is the scattering
of
X rays by the units
of
a crystalline solid. The scattering,
or
diffraction patterns, produced are used to deduce the arrangement
of
particles in the solid
lattice.
In Section 6.1 we discussed the interference phenomenon associated with waves (see
Figure 6.4). Because X rays are a form
of
electromagnetic radiation (i.e., they are waves), they
exhibit interference phenomena under suitable conditions. In 1912
Max
von Laue
4
correctly
suggested that, because the wavelength
of
X rays is comparable in magnitude to the distances
between lattice points in a crystal, the lattice should be able to diffract X rays. An X-ray dif-
fraction pattern is the result
of
interference in the waves associated with X rays.
Figure 12.21 shows a typical X-ray diffraction setup. A beam
of
X rays is directed at
a mounted crystal. When X-ray photons encounter the electrons in the atoms
of
a crystalline
solid, some
of
the incoming radiation is reflected, much as visible light is reflected by a mirror;
the process is called the scattering
of
X rays.
To
understand how a diffraction pattern arises, consider the scattering
of
X rays by the
atoms in two parallel planes (Figure 12.22). Initially, the two incident rays are in phase with
each other (their maxima and minima occur at the same positions).
The
upper wave is scat-
tered, or reflected, by an atom in the first layer, while the lower wave is scattered by an atom in
the second layer. For these two scattered waves to be in phase again, the extra distance traveled
by the lower wave (the sum
of
the distance between points
Band
C and the distance between
points C and D) must be an integral multiple
of
the wavelength
("-)
of
the X ray; that is,
Equation 12.5
BC
+ CD =
2d
sin 8 =
n"-
n =
1,
2,
3,
where 8 is the angle between the X rays and the plane
of
the crystal and d is the distance
between adjacent planes. Equation 12.5 is known as the
Bragg equation, after William
H.
Bragg and
Sir
William L. Bragg.
s
The
reinforced waves produce a dark spot on a photographic
film for each value
of
that satisfies the Bragg equation.
x
tube
X-ray
beam
Shield
Crystal
Photographic
plate
4. Max Theodor Felix von Laue (1879- 1960). German physicist.
Von
Laue received the Nobel Prize in Physics in
1914 for his discovery
of
X-ray diffraction.
5.
William Henry Bragg (1862-1942) and Sir William Lawrence Bragg (1890-1972). English physicists, father and
son. Both worked on
X-ray crystallography.
The
younger Bragg formulated the fundamental equation for X-ray dif-
fraction.
The
two shared the Nobel Prize in Physics in 1915.
Incident rays
Reflected rays
• •
•
•
•
c
d sin e
• • • • •
•
Figure 12.22 Reflection
of
X rays from two layers
of
atom
s.
The
lower wave travels a distance
2d
sin 0 longer than the upper wave does. For the two waves
to
be in phase again after reflection, it must be
true that
2d
sin 0 =
11"-,
where
"-
is the wavelength
of
the X ray and
11
=
1,
2, 3,
The
sharply defined
spots in Figure 12.21 are observed only
if
the crystal is large enough to consist
of
hundreds
of
parallel
layers.
X rays
of
wavelength 0.154
nm
strike an aluminum crystal; the rays are reflected at an angle
of
19.3°. Assuming that
11
=
1,
calculate the spacing between the planes of aluminum atoms (in pm)
that is responsible for this angle
of
reflection. . . .
. . .
.
.
Strategy Use Equation 12.5 to solve for
d.
Setup 0 = 19.3
°,11
=
1,
and
"-
= 154 pm.
Solution
d = 11"-
2 sin 0
154pm
, '-:: ::-:- = ? 3
~
pm
:2
sin 19.30 - J
Practice Problem A X rays
of
wavelength 0.154
nm
are diffracted from a crystal at an angle
of
14.17°. Assuming that
11
=
1,
calculate the
di
stance (in pm) between layers in the crysta
l.
Practice Problem B At what angle will X rays
of
wavelength 0.154 nm be diffracted from a
crystal
if
the distance (in pm) between layers in the crystal is 188 pm? (Assume
11
=
1.
)
The X-ray diffraction technique offers the most accurate method for determining bond
lengths and bond angles in molecules in solids. Because X rays are scattered by electrons,
chemists can construct an electron-density contour map from the diffraction patterns by using
a complex mathematical procedure. Basically, an electron-density contour map tells us the
relative electron densities at various locations in a molecule. The densities reach a maximum
near the center
of
each atom. In this manner, we can determine the positions of the nuclei and
hence the geometric parameters
of
the molecule.
•
1 nm = 1000
pm
.
Think
About
It
The distance
between layers
of
atoms in a crystal
should be similar in magnitude
to the wavelength
of
the X rays
diffracted
by
the crystal (compare
0.154 nm with 0.233 nm).
477
478
CHAPTER
12
Intermolecular
Forces
and
the
Physical Properties
of
Liquids
and
Solids
The
noble
gases,
which
are
monatomic,
crystallize
in
the
ccp
structure,
with the
exception
of
he
l
ium,
which
crystallizes
in
the
hcp
structure.
(a)
(
•
(b)
Figure 12.23
Exploded
views
of
(a) a hexagonal close-packed structure and (b) a cubic
close-packed structure. This view is tilted to show the face-centered cubic unit cell
more
clearly.
Note that this arrangement is the s
ame
as
the
face-centered unit cell.
Figure 12.23 shows the exploded views and the structures resulting from these two arrange-
ments. The ABA arrangement [Figure 12.23(a)] is known
as
the hexagonal close-packed (hcp)
structure, and the ABC arrangement [Figure 12.23(b)] is the cubic close-packed (ccp) structure,
which corresponds to the face-centered cube already described. In the hcp structure, the spheres in
every other layer occupy the same vertical position (ABABAB
),
while
in
the ccp structure, the
spheres in every fourth layer occupy the same vertical position (ABCABCA
).
In both struc-
tures, each sphere has a coordination number
of
12 (each sphere is in contact with six spheres in
its own layer, three spheres in the layer above, and three spheres in the layer below). Both the hcp
and ccp structures represent the most efficient way
of
packing identical spheres in a unit cell, and
the coordination number cannot exceed 12.
Many metals form crystals with hcp or ccp structures. For example, magnesium, titanium,
and zinc crystallize with their atoms in
an
hcp array, while aluminum, nickel, and silver crystal-
lize in the ccp arrangement. A substance will crystallize with the arrangement that maximizes the
" ,
stability
of
the solid.
Figure 12.24 summarizes the relationship between the atomic radius r and the edge
length a
of
a simple cubic cell, a body-centered cubic cell, and a face-centered cubic cell. This
relationship can be used to determine the atomic radius
of
a sphere in which the density
of
the
crystal is known.
see
a =
21'
(a)
bee
b
2
= a
2
+ a
2
c
2
=a
2
+b
2
= 3a
2
c =
f3a
= 4,.
41'
a
=-::-
f3
(b)
fee
b =
41'
b
2
= a
2
+ a
2
16,.2
= 2a
2
a =
hr
(c)
Figure 12.24
The
relationship
between
the
edge
length (a) and radius
(r)
of
atoms in the (a) simple
cubic cell, (b) body-centered cubic cell, and (c) face-centered cubic cell.
SECTION 12.3 Crystal Structure 479
Sample Problem 12.4 illustrates the relationships between the unit cell type, cell dimen-
sions, and density
of
a metal.
Go
ld crystallizes in a
cubic
close-packed structure (face-centered cubic unit cell) and has a density
of
19.3
g/cm
3
.
Calculate the atomic radius
of
an Au
atom
in
angstroms (A).
Strategy
Using
the
given density and
the
mass
of
gold contained within a face-centered
cubic
unit
cell, determine the vo
lu
me
of
the unit
ce
l
l.
Then, use
the
volume to determine the value
of
a,
and use
the
eq
uation supplied in Figure 12.24(c) to find
r.
Be
sure to
use
consistent units for mass, length, and
volume.
Setup
The
face-centered cubic unit cell contains a total
of
four
atom
s
of
gold [six faces, each shared
by two unit cells, and
eight
corners,
each
shared by eight unit cells- Figure 12.24(c)
].
D = m/
Vand
V = a
3
.
Solution First, we determine the mass
of
gold (in grams) contained within a unit cell:
4
~
1
J1Wi
197.0 g Au
21
m = X X
- = 1.31 X
10
- g/unit cell
unit cell
6.022 X
10
23
~
1
.J].1GJ-krf
Then
we calculate the volume
of
the
unit cell in
cm
3
:
m
1.31
X
10
-
21
is
V = - = = 6.78 X
10
-
23
cm
3
d 19.3 g/
cm
3
Using the calculated
volume
and
the
relationship V = a
3
(rearranged to solve for a), we determine
the l
ength
of
a side
of
a unit cell:
a = 3
.yv
=
3~6.78
X
10-
23
cm
3
= 4.08 X
10
-
8
cm
Using the relationship provided in Figure 12.22(c) (rearranged to solve for r),
we
determine the
rad
ius
of
a gold
atom
in
centimeters:
r = a = 4.08 X
10
-
8
em
= 1.44 X
10
-
8
cm
-V8 -V8
Finally,
we
convert centimeters to angstroms:
1.44
X
10
-
8
cm
X 1 X
10
-
2
m
X 1 A = 1.44 A
1
em
1 X
10
-
10
m
Practice Problem A
When
silver crystallizes, it forms face-centered cubic cells.
The
unit cell
edge
length is 4.087
A.
Calculate the density
of
silver.
Practice Problem B
The
density
of
sodium metal is 0.971
g/
cm
3, and the unit cell
edge
length is
o
4.285 A.
Determine
the
unit cell (simple, body-centered, or face-centered
cubic
)
of
sodium metal.
Checkpoint
12.3
Crystal Structure
12.3.1
Nickel has a face-centered
cubic
unit
cell with an
edge
length
of
352.4 pm.
Calculate the density
of
nickel.
a) 2.227 g/
cm
3
b) 4.455
g/
cm
3
c) 38.99 g/
cm
3
d)
8.908
g/
cm
3
e) 11.14 g/
cm
3
12.3.2
At
what angle would you
expect
X rays
of
wa
velength
0.154
nm to
be
reflected
from a crystal
in
which the distance
between layers is
312
pm?
(Assume
n
=1.
)
a) 1.6°
b) 29.6°
c) 0.25°
d) 6.8°
e) 14.3°
Think
About
It
Atomic radii t
end
o •
to
be
on
the
order
of
1 A, so
thIS
answer is reasonable.
480
CHAPTER
12
Intermolecular
Forces and
the
Ph
ysical Properties
of
Liquids and Solids
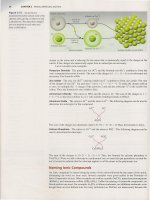
It
is important to
realize
that the lattice
points
u
sed
to define a unit
cell
must
all
be
identicaL
We
can
d
efine
the unit
cell
of
Na(
1
based
on
the
pos
iti
ons
of the
Na
+
ions
or
the
positions
of
t
he
(1
- i
ons.
It
is
a common
mistak
e to identify the (5(1
struc
ture as b
od
y-c
entered
cubic.
Remember
th
at
the lattice
po
i
nts
used
to define a unit
ce
ll
m
ust
a
ll
be
id
enticaL
In
this
case,
they
are
all
(l
-
i
ons
. ( 5( 1
has
a
simp
le
cubic
unit
cell
.
Figure 12.25
The
unit cell
of
an
ionic
compound
can be defined eit
her
by
(a)
the
positions
of
anions
or
(b) the
positi
on
s
of
cations.
Figure 12.26
Cr
ystal s
tructur
es
of
(a)
CsCl
, (b) ZnS,
and
(c)
CaF
2
.
In ea
ch
ca
se, the s
maller
sphere
repre
se
nt
s the
cation.
.'
.'.
12.4
-
~
. _ . . - -
Types
of
Crystals
The
s
tructure
s
and
properties
of
cr
ys
talline s
olids
, s
uch
as
melting
point
, density,
and
hardness,
are
determined
by the
kind
s
of
force
s
that
hold
the
particles
together.
We
can
cla
ssify
any
crystal
as
one
of
four
ty
pe
s:
ionic
,
co
v
alent
,
molecular
,
or
metallic.
Ionic Crystals
Ionic
cry
stals are
compo
s
ed
of
charged spheres (cations
and
anions) that are
held
together
by
Coulom-
bic
attraction.
Anion
s typically are
con
siderably bigger than cations [I
••
Section
7.6]
,
and
the relative
sizes
and
relative
number
s
of
the ions in a c
ompound
determine
how
the ions are arranged
in
the solid
lattice. NaCl adopts a face-centered cubic arrangement as s
hown
in Figure 12.25. Note the positions
of
ions within the unit cell,
and
within the lattice overall.
Both
the Na + ions
and
the
Cl-
ions adopt face-
centered cubic arrangements, and the unit cell defined by the arrangeme
nt
of
cations overlaps with the
. . . . . . . . .
,
. . . . . . .
.
unit cell defined by the arrangement
of
anions.
Look
closely
at
the unit cell s
hown
in Figure 12.25(a).
It
is defined as fcc by the
po
sitions
of
the
Cl-
ions. Recall that there is the equivalent
of
four spheres con-
tained
in
the fcc unit cell (
half
a sphere at each
of
six faces
and
one-eighth
of
a sphere
at
each
of
eight
comer
s).
In
this
ca
se the spheres are
Cl-
ion
s,
so the unit
ceU
of
N
aC1
contains four Cl- ions.
Now
look
at the positions
of
the Na + ions.
Ther
e are
Na
+ ions centered
on
each edge
of
the cube,
in
addition to
one Na
+
at
the cente
r.
Each
sphere
on
the cube's
edge
is shared by four unit cells, and there are 12 such
ed
ges.
Thu
s, the unit cell
in
Figure 12.25(a) also contains four Na + ions (one-quarter sphere at each
of
12 edges, giving three spheres,
and
one
sphere at the center).
The
unit cell
of
an ionic
compound
always
contains the same ratio
of
cations to anions as the empirical formula
of
the compound.
Figure
12.26
s
ho
ws
the
cry
s
tal
s
tructure
s
of
three
ionic
compound
s: CsCl,
ZnS,
and
CaF
2
.
."
. . . . .
."
. . . .
-
."
.'
. . .
Ce
s
ium
chloride
[Figur
e
12.26
(a)]
ha
s
the
s
imple
cubic
lattice.
Despite
the
apparent
similarity
of
(a)
(b)
(a) (b) (c)
SECTION
12.4
Types
of
Crystals 481
the fonnulas
of
CsCl and NaCl, CsCl adopts a different arrangement because the Cs + ion is much
larger than the Na+ ion. Zinc sulfide [Figure l2.26(b)] has the
zincblende structure, which is based
on the face-centered cubic lattice.
If
the So- ions occupy the lattice points, the smaller Zn
2
+ ions are
arranged tetrahedrally about each
So- ion. Other ionic compounds that have the zincblende structure
include CuCl, BeS, CdS, and HgS. Calcium fluoride [Figure 12.26(c)] has the
fluorite structure. The
unit cell in Figure 12.26(c) is defined based on the positions
of
the cations, rather than the positions
of
the anions. The
Ca2+
ions occupy the lattice point
s,
and each F- ion is surrounded tetrahedrally by
four
Ca2+
ion
s.
The compounds SrF
2
,
BaF
z,
BaClz, and PbF
2
also have the fluorite structure.
Sample
Problems 12.5 and 12.6 show how to determine the number
of
ions in a unit cell and
the density
of
an ionic crystal, respectively.
How many
of
each ion are contained within a unit cell
of
ZnS?
Strategy Determine the contribution
of
each ion
in
the unit cell based on its position.
Setup Referring to Figure 12.26, the unit cell has four
Zn2+
ions completely contained within the
unit cell, and
S2
- ions at each
of
the eight corners and at each
of
the six faces. Interior ions (those
completely contained within the unit cell) contribute one, tho
se
at the corners each contribute one-
eighth, and those on the faces each contribute one-half.
Solution
The
ZnS unit cell contains four Zn
2+
ions (interior) and four S2- ions
[8
X J (corners) and
6 X
~
(faces)].
Practice Problem A Referring to Figure 12.26, determine how many
of
each ion are contained
within a unit
cell
of
CaF
2
.
Practice Problem B Referring to Figure 12.26, determine how many
of
each ion are contained
within a unit cell
of
CsC!.
Sample Problem 12.6
The edge length
of
the NaCl unjt cell is
564
pm. Determine the density
of
NaCl in g/cm
3
.
Strategy Use the number
of
Na + and
CC
ions in a unit cell (four
of
each) to determine the mass
of
a unit cel!. Calculate volume using the
edge
length given
in
the problem statement. Density is mass
divided by volume
(d
= m/V).
Be
careful to u
se
units consistently.
+
.
.
Setup
The
ma
sses
of
Na
and
CI
- ions are 22.99 amu and 35.45 amu, respectively.
The
conversion
factor from amu to grams is
1 g
6.022 X 10
23
amu
so the
ma
sses
of
the Na + and
CI
- ions are 3.818 X 10-
23
g and 5.887 X
10-
23
g, respectively.
The
unit cell length is
564ym
X 1 X
1O
-
12
fi{
x ' 1
cm
= 5.64 X
10-
8
cm
lym
1 X 1O-
2
m
Solution
The
mass
of
a unit cell is 3.882 X 10-
22
g (4 X 3.818 X 10-
23
g + 4 X 5.887 X 10-
23
g).
The volume
of
a unit cell is
1.
794 X 10-
22
cm
3
[(5.64 X
10-
8
cm
)3
].
Therefore, the density is given by
3.882 X 10-
22
g
d = = 2.16 a/cm
3
-?O
3
<>
1.794 X 10
cm
Practice Problem A
LiF
has the same unit cell as NaCl (fcc).
The
edge
length
of
the LiF unit cell is
402 pm. Determine the density
of
LiF
in g/cm3
Practice Problem B NiO also adopts the face-centered-cubic arrangement. Given that the density
of
NiO is 6.67
g/
cm
3, calculate the length
of
the
edge
of
its unit cell (in
pm
).
~I
__
~
_________________________________________________
"
·
•
•
•
•
•
Think
About
It
Make sure that
the ratio
of
cations to anions
that you determine for a unit cell
matches the ratio expressed in the
compound's empirical formula.
Note
tha
t the
mass
of
an
atomic
ion
is
treated
the
same
as
the
mass
of
th
e parent atom. In
the
se
cases,
the
mass
of
an
electron
is
not
significant
[
~
Section
2.2, Table 2.1].
·
Think
About
It
If
you were to
hold a cubic centimeter
(1
cm
3
)
of
salt in your hand, how heavy would
you expect it to be? Common
errors
in
this type
of
problem
include errors
of
unit
conversion-
especially with regard to length
and volume.
Such
errors can lead
to results that are
off
by many
orders
of
magnitude. Often you
can use common sense to gauge
whether
or
not a calculated answer
is reasonable. For instance, simply
getting the
cen
timeter-meter
conversion upside down would
result
in
a calculated density
of
2.16 X 10
12
g/
cm
3
!
You
know
that a cubic centimeter
of
salt
doesn't have a mass that large.
(T
hat
's billions
of
kilograms!)
If
the magnitude
of
a result
is
not
rea
sonable, go back and
check
your
work.
482 CHAPTER
12
Intermolecular
Forces and
the
Physical Properties
of
Liquids and Solids
Most
ionic crystals have high melting points, an indication
of
the strong cohesive forces
holding the ions together. A
measure
of
the stability
of
ionic crystals is the lattice energy
[
~~
Sectio
n
8.2];
the higher the lattice energy, the more stable the compound. Ionic solids do
not
conduct electricity because the ions are fixed
in
position.
In
the molten (melted) state
or
when
dis-
solved in water, however, the
compound's
ions are free to
move
and the resulting liquid conducts
electricity.
Covalent Crystals
In covalent crystals, atoms are
held
together in an extensive three-dimensional network entirely
by covalent bonds. Well-known examples are two
of
carbon's
allotropes: diamond and graphite.
In diamond, each carbon atom is
Sp3
-hybridized and
bonded
to four
other
carbon atoms [Figure
12.27(a)].
The
strong covalent bonds in three dimensions contribute to
diamond's
unusual hard-
ness (it is the hardest material known) and very high melting point
(3550°C). In graphite, carbon
atoms are arranged in six-membered rings [Figure 12.27(b)].
The
atoms are all sp2-hybridized, and
each
atom
is bonded to three other atoms.
The
remaining unhybridized 2p orbital
on
each
carbon
atom is used in pi bonding.
In
fact, each
layer
of
graphite has the kind
of
delocalized molecular
orbital that is present
in benzene
[
~~
Sect
ion
9.7]
. Because electrons are free to
move
around in
this extensively delocalized molecular orbital, graphite is a good conductor
of
electricity in direc-
tions along the planes
of
the carbon atoms.
The
layers are
held
together
by
weak van der Waals
forces.
The
covalent bonds in graphite account for its hardness; however, because the layers can
slide past
one
another, graphite is slippery to the touch and is effective as a lubricant.
It
is also used
as the
"lead"
in pencils.
Another covalent crystal is quartz
(Si0
2
).
The arrangement
of
silicon atoms
in
quartz is
similar to that
of
carbon
in
diamond,
but
in
quartz there is an oxygen atom between
each
pair
of
Si
atoms. Because Si and
0 have different electronegativities, the Si
-0
bond
is polar. Nevertheless,
Si0
2
is similar to
diamond
in
many
respects, such as being very hard and having a high melting
point (161O°C).
335
pm
(a)
(b)
Figure 12.27 Structures of
(a)
diamond
and
(b)
graphite. Note that
in
diamond, each carbon atom
is
bonded
in
a tetrahedral arrangement
to
four other carbon atoms.
In
graphite, each carbon atom
is
bonded
in
a
trigonal planar arrangement
to
three other carbon atoms. The distance between layers
in
graphite
is
335
pm.
SECTION 12.4 Types
of
Crystals 483
.'
Molecular Crystals
o·
.'
.'
••
. '
.'
.
,
/.
In
a molecular crystal,
the
lattice points are occupied
by
molecules, so the attractive forces between
them are van
der
Waals forces and/or hydrogen bonding. An example
of
a molecular crystal is
solid sulfur dioxide
(S02), in
which
the
predominant
attractive force is a dipole-dipole interaction.
Intermolecular
hyqrogen bonding is mainly responsible for maintaining
the
three-dimensionallat-
tice
of
ice
(Figure 12.28).
Other
examples
of
molecular crystals are 1
2
, P4,
and Ss.
Except
in ice, molecules in molecular crystals are generally packed together as closely as
their size and shape allow. Because van der Waals forces and hydrogen bonding are usually quite
weak
compared
with covalent and ionic bonds, molecular crystals are more easily broken apart than
ionic and covalent crystals. Indeed,
mo
st molecular crystals
melt
at temperatures below 100°C.
Metallic Crystals
Every lattice point in a metallic crystal is occupied
by
an
atom
of
the
same
metal. Metallic crystals
are generally body-centered cubic, face-centered cubic,
or
hexagonal clo
se
-packed. Consequently,
metallic elements are usually very den
se
.
The
bonding
in
metals is quite different
from
that in other types
of
crystals.
In
a metal,
the
bonding electrons are delocalized over the entire crystal. In fact, metal
atom
s
in
a crystal can
be
imagined as an array
of
po
sitive ions immersed in a sea
of
delocalized valence electrons
(F
igure
12.29).
The
great cohesive force
re
sulting
from
delocalization is
re
sponsible for a
metal's
strength,
whereas the mobility
of
the delocalized electrons makes metals good conductors
of
heat
and elec-
tricity. Table
12.4 summarizes the properties
of
the four different types
of
crystals discussed. Note
that
the
data in Table 12.4 refer to the solid
pha
se
of
each s
ub
sta
nce listed.
Type
of
Crystal
Ionic
Covalent
Molecular
t
Metallic
Cohesive
Forces
Coulombic attraction and
dispersion forces
Covalent bonds
Dispersion and dipole-dipole
forces, hydrogen
bond
s
Metallic bonds
*Diamond
is
a
good
conductor
of
heat.
tlncluded in this category are crystals made
up
of
individual atoms.
General
Properties
Hard, brittle,
high
melting
point
,
poor
conductor
of
heat and electricity
Hard, brittle, high melting point,
poor
conductor
of
heat
and electricity
Soft, low melting point,
poor
conductor
of
heat
and electricity
Variable hardness and melting point, good
conductor
of
heat
and electricity
Figure 12.28 The three-
dimensional structure of ice. The
covalent bonds are shown
by
short solid
lines
and
the weaker hydrogen bonds
by
long dotted lines between 0 and
H.
The empty space
in
the structure
accounts for the
low
density of ice,
relati
ve
to
liquid
water.
Figure 12.29 A cross section of a
metallic crystal. Each circled
po
sitive
charge represents
the
nucleus and inner
electrons of a metal atom. The grey
area surrounding
the
positive metal ions
indicates the mobile
"sea" of electrons.
Examples
NaCl, LiF,
MgO,
CaC0
3
C (
diamond
),*
Si0
2
(quartz)
All metallic elements, such
as Na,
Mg,
Fe,
Cu
484
CHAPTER
12
Intermolecular
Forces
and
the
Physical
Properties
of
Liquids
and
Solids
Think
About
It Metals typically
have high densities, so
common
sense can help you decide whether
or not
your
calculated
answer
is
reasonable.
The
metal iridium (
Ir
) crystallizes with a face-centered cubic unit cell. Given that the length
of
the
edge
of
a unit cell is 383 pm, determine the density
of
iridium in
g/cm
3
.
Strategy
A face-centered metallic crystal contains four atoms
per
unit cell
[8
X
~
(corners)
and
6 X
Hface
s)]. Use the number
of
atoms
per
cell and the atomic
ma
ss to determine the mass
of
a unit cell.
Calculate volume us
ing
the edge length given in the problem statement. Density is then mass divided
by v
olume
(d = m/V).
Be
sure to make all necessary unit conversions.
Setup
The
ma
ss of an
Ir
atom is 192.2 amu.
The
conversion factor from
amu
to grams is
1 g
6.022 X 10
23
amu
so the
ma
ss
of
an
Ir
atom
is 3.192 X
10-
22
g.
The
unit cell length is
383
pm
X 1 X 10-
12
m X 1
cm
= 3.83 X 10-
8
cm
1
pm
1 X 10-
2
m
Solution
The
ma
ss
of
a unit cell is
l.2
77 X
10-
21
g (4 X
3.192
X 10-
22
g).
The
volume
of
a unit
cell is 5.618
X
10-
23
cm
3
[(3.83
X 10-
8
cm
)3
]. Therefore, the density
is
given by
l.277
X
10-
21
g
d = = 22.7 g/
cm
3
5.62
X
10-
23
cm
3
Practice
Problem
A
Aluminum
metal crystallizes in a face-centered cubic
unit
cell.
If
the length
of
the cell edge is
404
pm
, what is the density
of
aluminum in
g/cm
3
?
Practice
Problem
B
Copper
cr
ystallizes in a face-centered cubic lattice.
If
the density
of
the
metal
is
8.96 g/
cm
3
, what is the length
of
the unit cell edge in picometers? .
Amorphous Solids
Solids are most stable in crystalline form. However,
if
a solid is formed rapidly (e.g., when a liquid
is cooled quickly), its atoms or molecules do not have time to align themselves and may become
locked in positions other than those
of
a regular crystal.
The
resulting solid is said to
be
amor-
phous.
Amorphous
solids, such as glass, lack a regular three-dimensional arrangement
of
atoms.
In this section, we will briefly discuss the properties
of
glass.
Glass is one
of
civilization's most valuable and versatile materials.
It
is
also one
of
the
oldest glass articles date back as far as
1000 B.C. Glass commonly refers to an optically trans-
parent fusion product
of
inorganic materials that has cooled to a rigid state without crystallizing.
By fusion product we mean that the glass is formed by mixing molten silicon dioxide
(Si0
2
),
its
chief component, with compounds such
as
sodium oxide (NazO), boron oxide
(B
2
0
3
),
and certain
transition metal oxides for color and other properties. In some respects, glass behaves more like a
liquid than a solid.
There are about
800 different types
of
glass in common use today. Figure 12.30 shows two-
dimensional schematic representations
of
crystalline quartz and amorphous quartz glass. Table
12.5 lists the composition and properties
of
quartz, Pyrex, and soda-lime glass. The color
of
glass
is due largely to the presence
of
oxides
of
metal ions mostly transition metal ions. For exam-
ple, green glass contains iron(III) oxide (Fe20 3) or copper(II) oxide (CuO), yellow glass contains
uranium(IV) oxide
(UO
z
), blue glass contains cobalt(Il) and copper(II) oxides (CoO and CuO),
and red glass contains small particles
of
gold and copper.
Phase Changes
A phase is a homogeneous part
of
a system that is separated from the rest
of
the system by a well-
defined boundary. When an ice cube floats in a glass
of
water, for example, the liquid water is one
phase and the solid water (the ice cube)
is
another. Although the chemical properties
of
water are
the same in both phases, the physical properties
of
a solid are different from those
of
a liquid.
SECTION
12.6 Phase Changes 485
•
•
Pure quartz glass
Pyrex glass
Soda-lime glass
I
(a)
100%
Si0
2
60
%-
80%
Si0
2
,
10%
-25
% B
2
0
3
,
some
Al
2
0
3
75%
Si0
2
,
15% Na
2
0,
10%
CaO
, 0
(b)
Low thel llIal expansion, transparent to a wide
range
of
wavelengths. Us
ed
in optical research.
Low
thermal expansion; transparent to visible
and infrared, but not to ultraviolet light.
Used
in cookware and laboratory glassware.
Easily attacked by chemicals and sensitive to
thermal shocks. Trans
mit
s visible light
but
absorbs ultraviolet light.
Used
in windows and
bottles.
When
a substance goes from one phase to another
pha
se, we say that it
ha
s undergone a
phase change.
phas
e 'changes in a"system are'generaliy caused by the addition 'or 'removal '
of
energy, usually in the form
of
heat. Familiar examples
of
pha
se changes include the following:
Example
Freezing
of
water
Evaporation (or vaporization)
of
water
Melting (fusion)
of
ice
Condensation
of
water vapor
Sublimation
of
dry ice
Phase Change
lI
2
0 (!) •
lI
2
0(
s)
lI
2
0(l
) •
lI
2
0(g)
lI
2
0 (s) •
lI
2
°(l
)
lI
2
0 (g) •
lI
?O(
!)
CO
is)
•
cO
?(g)
The
establishment
of
an _equilibrium vapor pressure, as
de
scribed in Section 12.2, involv
ed
two of
these phase changes: vaporization and condensation. Figure 12.31 summarizes the various types
of
phase changes.
Liquid-Vapor Phase Transition
In Section 12.2 we learned that the vapor pressure
of
a liquid increases with increasing tempera-
ture.
When
the vapor pressure reaches the external pressure, the liquid boils. In fact, the boiling
point
of
a substance is defined as the temperature at which its vapor
pre
ssure equals the external,
. . . . . . . .
. . . . . . .
atmospheric pressure. As a result, the boiling point
of
a substance varies with the external pres-
sure.
At
the top
of
a mountain, for example, where the atmospheric pressure is lower than that at
sea level, the vapor pressure
of
water (
or
any liquid) reaches the external pressure at a lower tem-
perature. Thus, the boiling point is lower than
it
would
be
at s
ea
leve
l.
Because
the boiling point is defined in terms
of
the vapor pressure
of
the liquid, the boiling
point is related to the
molar heat o/vaporization (t:lll
vap
),
the amount
of
heat required to vaporize
a mole
of
substance at its boiling point. Indeed, the data in Table 12.6 show that the boiling point
generally increases as
!1H
va
p increases. Ultimately, both the boiling point and !1Hvap are detennined
by the strength
of
intermolecular forces. For example, argon
(Ar
) and methane
(ClI
4
) ,
which have
only relatively weak dispersion force
s,
have low boiling
point
s and small molar heats
of
vaporiza-
tion. Diethyl ether
(C2
lIsOC
2
lI
S)
ha
s a dipole
moment
, and the dipole-dipole forces account for its
moderately high boiling point and
!1Hv
ap
. Both ethanol (C
2
lI
s
OlI
) and water
ha
ve strong hydrogen
Figure 12.30 Two-dimensional
representation of
(a)
crystalline quartz
and
(b) noncrystalline (amorphous)
quartz glass. The small spheres
represent silicon.
In
reality, the
structure of quartz
is
three dimensional.
Each
Si
atom
is
bonded
in
a tetrahedral
arrangement
to
four 0 atoms.
P
hase
chan
ge
s are p
hysic
al
cha
ng
es
[
~~
Section
1.4]
.
T
he
t
em
pe
ra
tu
re
at
which the vapor
pr
essu
re
of a
liquid
is
equal to 1 atm is
calle
d the
normal
boiling point.
486 CHAPTER
12
Intermolecular
Forces
and
the
Physical Properties
of
Liquids and Solids
Figure 12.31 The six possible
phase changes: melting (fusion
),
vaporization, sublimation, deposition,
condensation, and freezing.
To
is
the
highest
temperature at which a
substance
c
an
exi
st
as
a
liquid.
•
Vaporization
liquid_gas
Melting
(Fusion)
solid
-liquid
Substance
Argon
(Ar)
Benzene
(C6
H
6)
Ethanol
(C
2
H
s
OH)
Diethyl ether (C2HsOC2HS)
Mercury (Hg)
Methane
(CH
4
)
Water (H?O)
Sublimation
solid- gas
Gas
Liquid
Solid
Deposition
gas - solid
Boiling
Point
(0C)
-186
80.1
78.3
34.6
357
-164
100
Condensation
gas_liquid
Freezing
liquid
• solid
IlHvap
(kJ/mol)
6.3
31.0
39.3
26.0
59.0
9.2
40.79
bonding, which accounts for th
eir
high boiling points and large
!1H
v
ap
values. Strong metallic
bonding causes mercury to have the highest boiling point and
!1Hv
ap
of
the liquids
in
Table 12.6.
Interestingly,
benzene
(C
6
H
6
),
although nonpolar, has a high polarizability
due
to the distribution
of
its electrons in delocalized
'IT
molecular orbitals.
The
dispersion forces that result
can
be as
strong as (or even stronger than) dipole-dipole forces and/or hydrogen bonds.
The
opposite
of
vaporization is condensation.
In
principle, a gas
can
be
liquefied (made to
condense) either
by
cooling
or
by applying pressure. Cooling a
sa
mple
of
gas decreases the kinetic
energy
of
its molecules,
so
eventually the
molecule
s aggregate to
form
small drops
of
liquid.
Applying pressure to
the
gas (compression
),
on
the other
hand
, reduces the distance between mol-
ecules, so they can
be
pulled
toget
her
by
intermolecular attractions.
Many
liquefication processes
use a combination
of
reduced temperature and increased pressure.
. .
.
Every substance
ha
s a critical temperature (Tc) above
which
its gas
phase
cannot
be
lique-
fied, no matter
how
great
the applied pressure. Critical pressure (Pc) is
the
minimum
pressure
that must be applied to liquefy a substance
at
its critical temperature.
At
temperatures above the
critical temperature, there is no fundamental distinction between a liquid and a gas
we
simply
have a fluid. A fluid at a temperature and pressure that exceed
Tc and P
c>
respectively, is called a
supercriticalfluid. Supercritical fluids have
some
remarkable properties and are used as solvents
in a wide variety
of
industrial applications.
The
first such large-
sca
le industrial use was the decaf-
feination
of
coffee with supercritical
CO
?
Table 12.7 lists the critical temperatures and critical press
ur
es
of
a
number
of
common
sub-
stances.
The
critical temperature
of
a substance reflects the strength
of
its intermolecular forces.
Benzene, ethanol, mercury, and water, which have strong intermolecular forces, also have high
critical temperatures
compared
with the other substances listed in the table.
Solid-Liquid
Phase
Transition
The
transformation
of
liquid to solid is called freezing, and the reverse process is called melting,
or
fusion.
The
melting
point
of
a solid
or
the freezing
point
of
a liquid is
the
temperature at
which
SECTION 12.6 Phase Changes 487
Substance
Tc
(0C)
Pc
(atm)
Ammonia (NH3) 132.4
111.5
Argon (Ar) - 122.2
6.3
Benzene (C
6
H
6
)
288.9
47.9
Carbon dioxide
(CO
2
) .
31.0
73.0
Ethanol
(C
2
H
s
OH)
243
63.0
Diethyl ether
(C
2
H
s
OC
2
H
s
)
192.6
35.6
Mercury (Hg)
1462
1036
Methane (CH
4
)
-83.0
45.6
Molecular hydrogen (H
2
)
-239
.9
12.8
Molecular nitrogen
(N
2
)
-1
47.1
33.5
Molecular oxygen
(0
2
)
-118.8
49.7
Sulfur hexafluoride (SF
6
)
45.5
37.6
Water
(H
2
O)
374.4
219.5
solid and liquid phases coexist in equilibrium.
The
normal melting
(o
r freezing) point
of
a sub-
stance is the temperature at which it melts
(o
r freezes) at 1 atm.
,
The
most familiar liquid-solid equilibrium is probably that
of
water and ice.
At
O°C and I
atm, the dynamic equilibrium is represented by
ice.
· water
or
A glass
of
ice water at O
DC
provides a practical illustration
of
this dynamic equilibrium. As the ice
cubes melt to form water, some
of
the water between ice cubes
ma
y freeze, thus joining the cubes
. . .
.'
.
. . . . . . . . . . . .
. . . . . .
together. Remember that in a dynamic equilibrium, forward and reverse processes are occurring at
the same rate
[~~
Section
4.1].
Because molecules are more strongly held in the solid phase than in the liquid phase, heat is
required to melt a solid into a liquid.
The
heating curve in Figure 12.32 shows that when a solid is
heated, its temperature increases gradually until point A is reached. At this point, the solid begins
to melt. During the melting period
(A
• B), the first flat portion
of
the curve in Figure 12.32,
Boiling
point
Liquid and vapor
D
C in equilibrium
~
~
~ ~
~
S
~
Melting point
Solid and liquid
in
equilibrium
A B
Time
Vapor
In
most
cases
a
glass
of
ice
water would not
be
a
true
examp
le
of a
dynamic
equilibrium
because
it would not
be
kept
at
ooe
At
room
temperature,
all
the
ice
eventually
melts.
Figure 12.32 A typical heating
curve, from the solid
pha
se
through
the
liquid
pha
se
to the
gas
phase
of
a
sub
sta
nce.
Because
tJ.H
fu s
is s
maller
than
tJ.H
va
p
,
a substance melts in
less time than
it
takes to boil.
This
explains
why
AB
is shorter than CD.
The
s
te
ep
ness
of
the
solid, liquid, and
vapor heating lines is
determined
by
the
specific
heat
of
the substance
in
each
state.
488 CHAPTER
12
Intermolecular
Forces and
the
Physical Properties
of
Liquids
and
Solids
•
,.
.
~
. , . .
.
",.:~~.'~,~
.
,
.
"
, " 'tv!
;
'"
, .
~
-
•
Solid iodine in equ
il
ibrium with its
vapor.
Equation
12
.6
is
generally
used
to approximate
tJ.H
9.Jb.
It only
holds
st
ri
ctly
when
all
the
phase
changes
occur
at
the
same
temperature.
•
Substance
Melting
Point (0C)
aH
fus
(kJ/mol)
Argon (Ar)
-190
1.3
Benzene (C
6
H
6
)
5.5
10.9
Ethanol
(C
2
H
s
OH)
- 117.3 7.61
Diethyl ether
(C
?HS
OC2HS)
- 116.2
•
6.90
Mercury (Hg)
-39
23.4
Methane (CH
4
)
-183
0.84
Water (H
2
O) 0
6.0]
heat is being absorbed by the system, yet its temperature remains constant.
The
heat helps the mol-
ecules overcome the attractive forces in the solid.
Once the sample has melted completely (point
B), the heat absorbed increases the average kinetic energy
of
the liquid molecules and the liquid
temperature rises
(B
• C). The vaporization process (C • D) can be explained similarly.
The temperature remains constant during the period when the increased kinetic energy is used to
overcome the cohesive forces in the liquid. When all molecules are in the gas phase, the tempera-
ture rises again.
The
molar heat
of
fusion
(t:JI
jllS
) is the energy, usually expressed in kJ/mol, required to
melt
1 mole
of
a solid. Table 12.8 lists the molar heats
of
fusion for the substances in Table
12
.
6.
A
comparison
of
the data in the two tables shows that
D H
fu
s
is smaller than
D Hvap
for each substance.
This is consistent with the fact that molecules in a liquid are still fairly closely packed together, so
some energy (but not a l
ot
of
energy, relatively speaking) is needed to bring about the rearrange-
ment from solid to liquid. When a liquid is vaporized, on the other hand, its molecules become
completely separated from one another, so considerably more energy is required to overcome the
intermolecular attractive forces.
Cooling a substance has the opposite effect
of
heating it.
If
we remove heat from a gas
sample at a steady rate, its temperature decreases. As the liquid is being formed, heat is given off
by the system, because its potential energy is decreasing. For this reason, the temperature
of
the
sys
tem
remains constant over the condensation period (D • C). After all the vapor has con-
densed, the temperature
of
the liquid begins to drop again. Continued cooling
of
the liquid finally
leads to freezing
(B
• A).
Supercooling is a phenomenon in which a liquid can be temporarily cooled to below its
freezing point. Supercooling occurs when heat is removed from a liquid so rapidly that the mol-
ecules literally have no time to assume the ordered structure
of
a solid. A supercooled liquid is
unstable. Gentle stirring or the addition to it
of
a small "seed" crystal
of
the same substance will
cause it to solidify quickly.
Solid-Vapor Phase Transition
Solids
can
be
vaporized, so solids, too, have a vapor pressure. Sublimation is the process by
which molecules go directly from the solid phase to the vapor phase.
The
reverse process,
in
which molecules go directly from the vapor phase to the solid phase, is called deposition. Naph-
thalene, which is the substance used to make mothballs, has a fairly high vapor pressure for a
solid (1
mmHg
at 53°C); thus, its pungent vapor quickly permeates an enclosed space. Iodine
also sublime
s.
At
room
temperature, the violet color
of
iodine vapor is easily visible
in
a closed
container.
Because molecules are more tightly held in a solid, the vapor pressure
of
a solid is gener-
ally much less than that
of
the corresponding liquid.
The
molar heat
of
sublimation
(t:JI
sub
)
of
a
substance is the energy, usually expressed in kilojoule
s,
required to sublime 1 mole
of
a solid. It is
equal to the sum
of
the molar h
ea
ts
of
fusion and vaporization:
Equation
12.6
Equation 12.6 is an illustration
of
Hess's law
[
~~
Section
5.5] . The enthalpy, or heat change, for
the overall process is the same whether the substance changes directly from the solid to the vapor
phase
or
if
it
changes from the solid to the liquid and then to the vapor phase.
SECTION 12.6 Phase Changes 489
Bringing Chemistry
to
Life
The
Dangers
of
Phase
Changes
If
you
have
ever
s
uffered
a
stea
m
burn
,
you
know
that
it
can
be
far
more
se
riou
s
than
a
burn
caused
simply
by
boiling
water
even
though
s
team
and
boiling
water
are
both
at
the
sa
me
temperature.
A
heating
curve
helps
explain
why
this is
so
(see
Figure
12.33).
When
boiling
water
touches
your
s
kin
,
it
is
cooled
to
body
temp
e
rature
because
it
deposits
the
h
eat
it
conta
in
s
on
your
skin
.
The
heat
deposited
on
your
s
kin
by
a
sa
mple
of
boiling
water
at
100°C
can
be
represented
by
the
ora
nge
line
under
the
curve.
When
an
equivalent
ma
ss
of
ste
am
contacts
your
skin,
it
first
deposits
heat
as
it
conden
ses
and
then
cools
to
body
temperature.
The
heat
deposited
on
yo
ur
skin
by a
samp
le
of
steam
is
represented
by
the
red
line
under
the
curve.
Notice
how
much
more
h
eat
is
deposited
by
steam
than
by
liquid
water
at
the
same
temperature.
The
stea
m
contains
more
heat
becau
se
it
ha
s
been
heated
and vaporized.
The
additional
heat
that
was
absorbed
by
the
water
to
vaporize
it
is
what
makes
a
steam
burn
worse
than
a burn
from
boiling
water.
A
heating
curve
can
al
so
be
u
se
d to
explain
why
hiker
s
stranded
by
blizzards
are
warned
not
to
consume
s
now
in
an effort to stay hydrated.
When
you
drink
cold
water,
yo
ur
body
expe
nd
s
energy
to
warm
the
water
you
consume
to
bod
y
temperature.
If
you
consume
snow,
yo
ur
body
must
first
expend
the
energy
nece
ssa
ry to
melt
the
s
now
,
and
then
to
warm
it.
Because
a
phase
change
is involved,
the
amount
of
energy
required
to
assimilate
s
now
is
much
greater
than
the
amount
necessary
to
assimilate
an
equal
mas
s
of
water
even
if
the
water
is ice-cold.
This
can
contribute
to hypothermia, a potentially
dangerous
drop
in
body
temperature.
I
Sample Problem 12.8
~
.
.
.
. . .
(a)
Calculate the amount of heat deposited on the skin of a person burned
by
1.00 g
of
liquid water
at
100.0°C and (b) the amount
ofheat
deposited
by
1.00 g
of
steam at 100.0°
C.
(c)
Calculate the
amount
of
energy necessary
to
warm 100.0 g
of
water from
O.O
°C
to
body temperature and (d) the
amount
of
heat required
to
melt 100.0 g
of
ice
at
O.O
°C
and
then warm it
to
body temperature.
(Assume that body temperature is
37.0°C.)
Strategy For the purpose of following the sign conventions, we can designate the water
as
the
system and the body as the surroundings. (a) Heat is transferred from hot water
to
the skin in a
single step: a temperature change. (b) The transfer
of
heat from steam
to
the skin takes place
in
two
steps: a phase change and a temperature change.
(c
) Cold water is warnled
to
body temperature
in
a single step: a temperature change. (d) The melting
of
ice and the subsequent warming
of
the
Boiling point
Vapor
°
~
100
~
;
~
B
t
E
~
Melting point
o - - - -
:;;or-
-(
I
I
Solid I
Heat required
to
melt and warm
ice from
DoC
I
I
I
Heat required
to
warm water
from
DoC
I
I
I
I
I
I
I
I
I
f
Heat
Heat deposited
by
boiling
water
Heat
deposited
by steam
( Continued)
You
may
want
to
review
the
calculation
of
the
heat
exchanged
between
the
system
and
surroundings
for
temperature
changes
and
phase
change
s
[
H~
Sections 5.3 and 5.4].
Figure 12.33 Heating curve of
water.
490
CHAPTER 12
Intermolecular
Forces and
the
Physical Properties
of
Liquids and Solids
Think
About
It
In problems
that include phase changes, the
q values corresponding to the
phase-change steps will
be
the
largest contributions to the tota!.
If
you find that this is
not
the case in
your solution, check to see
if
you
have
made
the common error
of
neglecting to convert the q values
corresponding to temperature
changes from J to kJ.
re
sulting liquid water takes place in two steps: a phase change and a temperature change.
In
each
case, the heat transferred during a temperature change depends on the mass
of
the water, the specific
heat
of
water, and the change in temperature.
For
the phase changes, the
heat
transferred depends on
the amount
of
water (in moles)
and
the molar
heat
of
vaporization
(D.Hvap)
or
molar heat
of
fus
ion
(
D.H
fus
)'
In
each
case
, the total energy transferred
or
required is the s
um
of
the energy changes for
the individual steps.
Setup
The
required specific heats
(s)
are 4.184 Jig 0 °C for water and 1.99 Jig 0 °C for steam.
(Ass
ume
that the specific heat values do not change over the range
of
temperatures in the problem.)
From
Table 12.6, the molar heat
of
vaporization
(D.H
v
ap)
of
water is 40.79 kJ/mol, and
from
Table 12.8, the molar heat
of
fusion
(D.Hfu
s)
of
water
is
6.01 kJ/mo!. The
molar
mass
of
water is
18.02 g/mo!. Note:
The
D.H
vap
of
water is the amount
of
heat required to vaporize a
mole
of
water. In
this problem, however,
we
want to know how
much
heat is deposited when water vapor condenses, so
we
must use the negative,
-40.79
kJ/mo!.
Solution
(a)
D.T
= 37.0°C - 100.0°C = - 63.0°C
From
Equation 5.13,
we
write
4.184 J
2
q =
msD.T
= 1.00 g X 0C X
-63.
0°C =
-2.64
X 10 J = - 0.264
kJ
cr
0
<0
Thu
s, 1.00 g
of
water at 100.0°C deposits 0.264 kJ
of
heat on the ski
n.
(
The
negative sign indicates
that heat is given
off
by the system and absorbed
by
the surroundings.)
1.00 g
(b)
18.02 glmol = 0.0555 mol water
-40
.79 kJ
q[ = nD.H
va
p = 0.0555 mol X =
-2.
26
kJ
mol
4.184 J
2
q2 =
msD.T
= 1.00 g X 0C X - 63.0°C = - 2.64 X 10 J =
-0.264
kJ
cr
0
<0
The
overall energy deposited on the
ski
n by 1.00 g
of
steam is the sum
of
q]
and
q2:
-2.26
kJ +
(-0.264
kJ) =
-2.
53 kJ
The
negative sign indicates that the system (steam) gives off the energy.
(c)
D.T
= 37.0°C -
O.O
°C = 37.0°C
4.184J
4
q =
msD.T
= 100.0 g X X 37.0°C = 1.55 X 10 J = 15.5
kJ
cro oC
<0
The
energy required to warm 100.0 g
of
water from
O.O
°C to 37.0°C is 15.5 kJ.
100.0 g
(d)
18.02 gl
mol
= 5.55 mol
6.01 kJ
q[ =
nD.H
fu
s
= 5.55
mol
X = 33.4 kJ
mol
4.184J
4
q2
=
msD.T
= 100.0 g X 0C X 37.0°C = 1.55 X 10 J = 15.5 kJ
go
The
energy required to melt 100.0 g
of
ice at
O.O
°C and warm it to 37.0°C is the
sum
of
q] and
q2:
33.4 kJ + 15.5 kJ = 48.9
kJ
Practice Problem A Calculate the amount
of
energy (in kJ) necessary to convert 346 g
of
liquid
water
from
O°C to water vapor at 182°C.
Practice Problem B Determine the final state and temperature
of
100 g
of
water originally at 25.0°C
after 50.0 kJ
of
heat have been added to it.
SECTION
12.7
Phase
Diagrams
491
Checkpoint 12.6 Phase Changes
12
.6.1 How much energy (in kJ) is required to
12
.6.2 How much energy (in kJ) is given off
convert
25.0 g
of
liquid water at room
when
l.0
g
of
steam at 1000e cools to
temperature
(25°C) to steam at
l10
0
e?
room temperature (25°C)?
a)
64.9 kJ
a)
0.326 kJ
b)
562kJ
b) 316 kJ
c)
1339 kJ
c)
2.58 kJ
d)
1.34 kJ
d)
48.9 kJ
e) 26.9
kJ
e) 22.1 kJ
Phase Diagrams
The
relationships between the phases
of
a substance can be represented in a single graph known
as a phase diagram. A
phase
diagram summarizes the conditions (temperature and pressure) at
which a substance exists as a solid, liquid, or gas. Figure 12.34(a) shows the phase diagram
of
CO
2
,
which is typical
of
many substances. The graph is divided into three regions, each
of
which
represents a pure phase.
The
line separating any two regions, called a phase boundary line, indi-
cates conditions under which these two phases can exist in equilibrium.
The
point at which all
three phase boundary lines meet is called the
triple point.
The
triple point is the only combination
of
temperature and pressure at which all three phases
of
a substance can be in equilibrium with
One
another.
In order to understand the infOImation in a phase diagram, consider the dashed lines between
numbered points in Figure 12.34(b).
If
we
start with a sample
of
CO
2
at 1 atm and - 100°C, the
sample is initially a solid (point 1).
If
we then add heat to the sample at 1 atm, its temperature
increases until
it
reaches - 78°C, the sublimation point
of
CO
2
at 1 atm (point 2). When the entire
sample has sublimed at
-78
°
C,
the temperature
of
the resulting vapor will begin to increase. We
continue adding heat until the temperature
of
the vapor is - 25°C (point 3).
At
this point,
we
main-
tain the temperature at
-25
°C and begin increasing the pressure until the vapor condenses, which
would occur at a pressure
of
73 atm (point 4). With a phase diagram, we can tell in what phase a
substance will exist at any given temperature and pressure. Furthermore,
we
can tell what phase
changes will occur as the result
of
increases
or
decreases in temperature, pressure, or both.
One
of
the interesting things about the phase diagram
of
CO
2
is that its triple point occurs
above atmospheric pressure
-57
°C, 5.2 atm. This means that there is no liquid phase at atmo-
spheric pressure, the condition that makes dry ice
"dry." At elevated pressure, solid CO
2
does melt.
In fact, liquid
CO
2
is used as the solvent in many dry-cleaning operations.
The phase diagram
of
water (Figure 12.35) is unusual because the solid-liquid phase-
boundary line has a negative slope. (Compare this with the solid-liquid phase-boundary line
of
CO
2
in Figure 12.34.) As a result, ice can be liquefied within a narrow temperature range by apply-
•
mg pressure.
Sample
Problem 12.9 lets you practice interpreting the information in a phase diagram.
73
4
Solid
Solid
1:
~
5.2
'"
J:
Va
por
2
1
1
-78 -57
-78
-
25
Temperature C°C)
Temperature
C°C)
(
a)
(b)
Figure 12.34 (a)
The
phase
diagram
of
carbon dioxide. Note that
the solid-liquid boundary line has a
positive slope. There is no liquid phase
below 5.2
atm
, so only the solid and
vapor phases can exist under ordinary
atmospheric conditions. (b) Heating
solid
e0
2
initially at -lOOoe and
1 atm (point 1) causes it to sublime
when it reaches
-
78
°e (point 2). At
-
25
°e , increasing the pressure from
1 atm (point 3) to 73 atm (point 4) will
cause
e0
2
to condense to a liquid.
492 CHAPTER 12
Intermo
lecular Forces
and
the
Physical P
roperties
of
Liqui
ds
and Soli
ds
Figure 12.35
The
phase
diagram
of
water.
Each
solid
line
betwe
en two
phases specifies the conditions
of
pressure and temperature under which
the two phases
can
exist
in
equilibrium.
The
point at which all three phases can
exist in equilibrium
(0.006
atm
and
0.01°C) is called the triple point.
2.0
~
§ 1.5
'"
~
~
0.5
0.0
+ , L r +
o
50
100 150
200
Temperature C°
C)
(a)
1
~
§
'"
~
~
"
'"
'"
~
0.006 0
Sample Problem 12.9
- -
-
- -
I
Solid I Liquid
I
I
I
I
I
,
Vapor
o 0.01
Temperature C°
C)
100
Using
the following
pha
se diagram, (a) determine the normal boiling
point
and the normal melting
point
of
the substance, (b) determine the physical state
of
the substance
at
2
atm
and 110°C, and
(c) determine
the
pre
ssure and temperature
that
conespond
to the triple
point
of
the substance.
2.0
0.5
0.0
+ , , '
o
50
100
150
200
Temperature C°
C)
Strategy
Each
point on the phase diagram corresponds to a pressure-temperature combination.
The
norma
l boiling and melting points are the temperatures
at
which the substance undergoes phase
change
s.
These
point
s fall on the
phase
boundary lines.
The
triple point is
where
the three
phase
boundaries meet.
Setup
By
drawing lines
cOITe
sponding to a given
pre
ssure and/
or
temperature, we
can
determine the
temperature at which a phase change occurs, or the physical state
of
the substance under specified
conditions.
2.0
~
§ 1.5
co
0.5
I
I
I
-
~
-
I
I
I
I
I
I
I
I
0.0
+ ,,
-'-
-, ,-
-
:
o 50
100
150
200
Temperature C°
C)
(b)
2.0
~
§ 1.5
co
0.5
I
I
I
I
I
I
I
I
I
I
I
I
-
1
0.0
+ ,
,-J-
, ,
o
50
100
150
200
Temperature C°
C)
(c)
Solution
(a)
The
normal boiling and melting points are - 140
o
e and -
205
°
e,
respectively.
(b)
At
2 atm and
1l0
oe the substance is a solid.
(c) The triple point occurs at
- 0.8
atm
and -
115
°
e.
Practice Problem A Use the following
pha
se diagram to (a) determine the normal boiling point and
melting point
ofthe
substance, and (b) the physical state
of
the substance at 1.2 atm and 100°
e.
2.0
0.5
0.0
+ , ,
-
100
-50
o
50
100
Temperature (D
C)
Practice Problem B Sketch the phase diagram
of
a substance using the following data:
Pressure
(atm)
0.5
1.0
1.5
2.0
2.5
Melting Point (D
C)
60
75
105
125
The triple point is at 0.75 atm and
45
°
e.
Boiling Point (0
C)
110
200
250
275
Sublimation Point (0
C)
o
Checkpoint
12.7
Phase Diagrams
Refer to the following phase diagrams to answer questions
12.
7
.1
and
12
.7.2.
1
atm
12.7.1
1
2
1
atm
T
T
Wh
ich phase diagram corresponds to a
substance that will subli
me
rather than
melt as it
is
heated at 1 atm?
a)
1
b)
1 and 2
c)
1,2,
and 4
d)
3
e)
none
1 atm
12.7.2
3
4
1 atm
T T
Which phase diagram corresponds
to a substan
ce
that will liquefy when
pressure is increased at a temperature
below its freezing point?
a)
1
b) 1 and 2
c) 1, 2, and 4
d)
3
e) none
SECTION 12.7 P
ha
se
Di
a
gr
a
ms
493
Thi
nk
About
It
The
triple point
of
this substance occurs at a pressure
below atmospheric pressure.
Theref
ore, it will melt rather than
sublime when it is heated under
ordinary conditions.