21-10-2008_12-36-16_38_Sveinsdottir et al_ 2002_ atlantic salmon
Bạn đang xem bản rút gọn của tài liệu. Xem và tải ngay bản đầy đủ của tài liệu tại đây (210.81 KB, 10 trang )
1570
JOURNAL OF FOOD SCIENCE
—Vol. 67, Nr. 4, 2002 © 2002 Institute of Food Technologists
Sensory and Nutritive Qualities of Food
Application of Quality Index Method (QIM)
Scheme in Shelf-life Study of Farmed
Atlantic Salmon (Salmo salar)
K. S
VEINSDOTTIR
, E. M
ARTINSDOTTIR
, G. H
YLDIG
, B. J
ØRGENSEN
,
AND
K. K
RISTBERGSSON
ABSTRACT: Salmon (Salmo salar) was stored in ice up to 24 d, and changes during storage were observed with
sensory evaluation using the Quality Index Method (QIM), and Quantitative Descriptive Analysis (QDA), total
viable counts (TVC), hydrogen sulfide (H
2
S)-producing bacteria, and instrumental texture measurements (com-
pression test). Maximum storage time in ice was determined with QDA and fat content by Soxhlet extraction. A
high correlation between QIM and storage time in ice was found. Storage time could be predicted with ± 2 d. TVC
increased exponentially with storage and was dominated by H
2
S-producing bacteria after 20 d in ice, which was
the maximum storage time. Texture measurements indicated softening of salmon flesh with storage.
Keywords: sensory evaluation, quality of salmon, fish freshness, shelf life
Introduction
F
RESHNESS
IS
ONE
OF
THE
MOST
IMPORTANT
ASPECTS
OF
FISH
,
AND
because of consumer preferences, there is a strong tendency
to select very fresh fish (Luten and Martinsdottir 1997). Sensory
evaluation is the most important method for freshness and qual-
ity assessment in the fish sector (Hootman 1992). The world’s
production of farmed salmon increased between 1990 and 1997,
from 540,000 tons to almost 1,400,000 tons per year (FAO 2000).
In 1997, 38% of the salmon produced in the world was Atlantic
salmon (Salmo salar). Because of the increased trade between
countries, purchases are often performed on unseen lots, and
there is a need for a good freshness grading system for salmon,
such as the Quality Index Method (QIM). This method is a sea-
food freshness quality grading system, which is used to assess
fish freshness in a rapid and reliable way. QIM is based upon a
scheme originally developed by the Tasmanian Food Research
Unit (Bremner 1985). The method has to be adapted to each fish
species. To date, the system incorporates fresh herring (Clupea
harengus) and cod (Gadus morhua) (Jonsdottir 1992; Larsen and
others 1992), red fish (Sebastes mentella/marinus) (Martinsdottir
and Arnason 1992), Atlantic mackerel (Scomber scombrus), horse
mackerel (Trachurus trachurus) and European sardine (Sardina
pilchardus) (Andrade and others 1997), brill (Rhombus laevis),
dab (Limanda limanda), haddock (Melanogrammus aeglefinus),
pollock (Pollachius virens), sole (Solea vulgaris), turbot (Scophtal-
mus maximus) and shrimp (Pandalus borealis) (Luten 2000), gilt-
head seabream (Sparus aurata) (Huidobro and others 2001), and
farmed salmon (Salmo salar) (Sveinsdottir and others 2001). QIM
has several unique advantages, including estimation of past and
remaining storage time in ice (Botta 1995; Hyldig and Nielsen
1997; Luten and Martinsdottir 1997).
The maximum storage time of fish can be determined by sen-
sory evaluation of cooked samples. The Quantitative Descriptive
Analysis (QDA) (Stone and Sidel 1985) is a sensory method,
which may be used for the determination of maximum shelf life
in addition to a detailed description of the sensory profile for a
product. With the QDA, all detectable aspects of a product are
described and listed by a trained panel. The list is then used to
evaluate the product, and the panelists quantify the sensory as-
pects of the product using an unstructured scale. The end of
shelf life is the result of unpleasant sensory characteristics most-
ly due to bacterial growth. The amount of bacteria on newly
caught fish can vary greatly, normally ranging from 10
2
to 10
7
cfu/
cm
2
(Liston 1980). The most important seafood spoilage bacteria
are characterized by their ability to produce H
2
S and reduce trim-
ethylamine oxide (TMAO), which has been used for their specific
determination. Capell and others (1997) found counts of H
2
S-
producing bacteria closely associated with the rejection of sever-
al fish species, irrespective of the temperature and atmosphere.
Microbial metabolites have low odor thresholds, and during fish
spoilage, the concentrations of sulfur compounds, short-chain
acids, alcohols, sulfur compounds, and amines increase (Olafs-
dottir and Fleurence 1997).
In raw fish, the texture softens during chilled storage (Anders-
en and others 1995; Einen and Thomassen 1998) because pro-
teolytic enzymes break down the muscle structure (Andersen
1995). The fat content of fish flesh appears to influence the tex-
ture. When the fat content is high, the flesh is softer (Andersen
and others 1994), and juiciness increases (Einen and Thomassen
1998). The total lipid content of farmed salmon is often up to
double the content found in wild salmon (Moe 1990) and has
been reported varying from 12% to 19% (Hafsteinsson and oth-
ers 1998; Refsgaard and others 1998).
The aim of this work was to perform a shelf-life study with
farmed Atlantic salmon (Salmo salar) and characterize the chang-
es in freshness with the Quality Index Method (QIM) scheme for
raw salmon and the Quantitative Descriptive Analysis (QDA) for
cooked salmon. Furthermore, the goal was to compare the senso-
ry analysis to microbial counts (total viable counts and H
2
S-pro-
ducing bacteria) and instrumental texture measurements (com-
pression test).
Materials and Methods
Salmon
The salmon was obtained from the fish farm Silungur ehf
JFS:
Sensory and Nutritive Qualities of Food
jfsv67n4p1570-1579ms20010283-SR.p65 5/31/2002, 11:14 AM1570
Vol. 67, Nr. 4, 2002
—
JOURNAL OF FOOD SCIENCE 1571
Sensory and Nutritive Qualities of Food
Shelf life of salmon with QIM . . .
(Vogar, Iceland). The salmon had been fed various types of the
feed blend “Gull” (Gull 3, 4, 6, 8, 10, 12, depending on the age of
the salmon) from Fodurblandan hf (Reykjavik, Iceland). The
blend contained 40% protein, 16% carbohydrates, and 25% to
30% fat. The salmon were starved for 2 wk and then slaughtered
with carbonic acid. After slaughtering, the salmon were gutted,
bled, gills cut through, and the salmon were then rinsed in run-
ning water for 30 min, followed by chilling to 0 °C in slush ice (0 to
–1 °C) before icing in boxes. The salmon weighed 3 to 4 kg. The
fish were slaughtered before sexual maturity in 8 batches (Octo-
ber/November 1999) and stored up to 24 d at 0 to 2 °C in iced
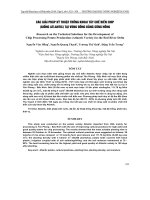
boxes until analyzed. A total of 50 salmon were used in the exper-
iment. Eleven were used for training the sensory panel. Salmon
stored 1, 2, 4, 8, 11, 13, 15, 17, 19, 20, 21, 22, and 24 d in ice were
analyzed during the shelf-life study. Three salmon from each
storage day were analyzed with QIM; thereof 2 were used for
QDA, microbial counts, texture measurement, and fat analysis
(Figure 1).
Sensory evaluation
Quality Index Method
The QIM scheme for salmon lists quality attributes for ap-
pearance/texture, eyes, gills, and abdomen and descriptions of
how they change with storage time. Scores were given for each
quality attribute according to the descriptions, ranging from 0 to
3. Very fresh fish normally received the score 0, with scores in-
creasing with storage time. The scores given for all the quality at-
tributes are summarized by the Quality Index, which increases
linearly with storage time in ice. The sensory evaluation of each
attribute was conducted according to Martinsdottir and others
(2001).
Prior to the shelf-life study, the QIM scheme for farmed salm-
on (Sveinsdottir and others 2001) was revised, as it did not in-
clude a parameter for the textural state of rigor mortis. Addition-
ally, 1 score was added for color/appearance of the skin. Changes
were made in the setup of the scheme and selection of words to
describe the parameters in the scheme, mainly to make each de-
scription more precise and to facilitate the QIM assessment.
Twelve trained panelists of the Icelandic Fisheries Laborato-
ries sensory panel participated in the sensory evaluation with
QIM. Members had several years of experience in evaluating fish
freshness. Prior to the shelf-life study, the panel was trained in
applying the QIM scheme in 2 sessions. The scheme was ex-
plained to the panel while observing salmon of different fresh-
ness categories. The panel used the scheme to assess 6 to 9 salm-
on from 2 to 3 different storage days per session during the
shelf-life study. The salmon was placed on a clean table 30 min
before the evaluation. The side where the gills had been cut
through was facing down. Each salmon was coded with 3 random
digit numbers. All observations of the salmon were conducted
under standardized conditions, with as little interruption as pos-
sible, at room temperature, and under white fluorescent light.
Quantitative Descriptive Analysis
The QDA, introduced by Stone and Sidel (1985), was used to
assess cooked samples of salmon. An unstructured scale (0 to
100%) was used on a list of words describing odor, flavor, appear-
ance, and texture.
Twelve panelists of the Icelandic Fisheries Laboratories´ sen-
sory panel participated in the QDA of the cooked salmon. They
were all trained according to international standards (ISO 1993),
including detection and recognition of tastes and odors, training
in the use of scales, and in the development and use of descrip-
tors. The members of the panel were familiar with the QDA
method and experienced in sensory analysis of salmon. Two ses-
sions were used for training of the panel using salmon of differ-
ent freshness categories. Sensory evaluation of the cooked salm-
on was performed parallel to the QIM assessment. Each panelist
evaluated duplicates of samples from 2 to 3 different storage
days. The fish was served in a random order during 2 sessions for
each day of the sensory evaluation.
All sample observations were conducted according to interna-
tional standards (ISO 1988). Twelve samples collected from each
salmon with skin came from the loin part, ranging from the spine
to 2 cm below the lateral line. The samples were coded with 3 ran-
dom digit numbers and cooked at 95 to 100 °C for 7 min in a pre-
warmed oven (Convotherm Elektrogeräte GmbH, Eglfing, Ger-
many) with air circulation and steam and then served to the
panel.
Microbial counts
Skin samples were collected before all other analysis by cut-
ting 2 x 7.5 cm
2
skin strips from 1 side of the fish and placed in a
Stomacher containing 50 mL Butterfield´s Buffer solution (APHA
1992). Blending was done in a Stomacher 400 for 1 min. Flesh
samples were collected after QIM evaluation from the other side
of the salmon. The skin was washed with alcohol and removed
with a sterilized scalpel. The flesh under the skin was collected,
and after mincing, 25 g were weighed into a stomacher bag con-
taining 225 g Butterfield´s Buffer solution to obtain a 10-fold di-
lution. Blending was done in a Stomacher for 1 min. Further 10-
fold dilutions were made as needed. Total viable counts (TVC)
and selective counts of H
2
S-producing bacteria were done on
iron agar (IA) by the pour plate technique with an overlay as de-
scribed by Gram and others (1987). The plates were incubated at
22 °C for 3 d. Bacteria forming black colonies on this agar produce
H
2
S from sodium thiosulfate and/or cysteine.
Instrumental texture measurements
One sample from each fish was measured in a Texture Analyz-
er (TA.XT2; Stable Micro System, Surrey, England) using a com-
pression test. The salmon was filleted, skin removed, and sam-
ples collected transversely behind the dorsal fin. Samples were
cut right above the lateral line, 2.5 cm in length and width, and
2.2 ± 1.4 cm in height. The samples were then covered with plas-
tic and stored in a refrigerator at 4 to 5 °C until measured (within
3 to 5 h) using an aluminum compression plate (SMSP/100).
Samples were compressed to 80% of the sample height at a con-
stant speed (0,8 mm/s) with a 100 g constant force. The trigger
force was set at 5 g and the registration rate to 200 PPS (registra-
tions per s).
Fat content
Samples were collected according to a method recommended
by the Norwegian General Standardizing Body or (1994), the
Norwegian Quality Cut (NQC). The samples were vacuum
packed and stored at –20 °C until analyzed (within 10 d). The fat
content was determined with the Soxhlet method (AOAC 1990)
with modification described in the IFL´s method manual for
chemical analysis (IFL 1999) using the solvent petroleum ether.
Data analysis
The QI was treated with analysis of variance (ANOVA, 2-factor
without replication) to analyze if a difference existed within a
group (QI given for each salmon within a storage day and QI giv-
jfsv67n4p1570-1579ms20010283-SR.p65 5/31/2002, 11:14 AM1571
Sensory and Nutritive Qualities of Food
1572
JOURNAL OF FOOD SCIENCE
—Vol. 67, Nr. 4, 2002
Shelf life of salmon with QIM . . .
en by each judge assessing salmon within a storage day). The
equation of best fit and the correlation coefficients (r) of QI, total
viable count, H
2
S-producing microbes on salmon skin and flesh,
and instrumental texture parameters against storage time in ice
were calculated using Microsoft
®
Excel 2000 (Microsoft Corpora-
tion, Redmond, Wash., U.S.A.).
Data from QDA was treated in HyperSense
©
(Version 1.6;
1996 Icelandic Fisheries Laboratories, Reykjavik, Iceland). Inter-
action of panelists and samples was assumed, and statistical
analysis was performed using 2-factor design with interaction in
the analysis of variance (ANOVA). The program calculates multi-
ple comparison using Tukey´s test. Multivariate comparison of
different attributes in QIM and QDA was conducted in the statis-
tical program Unscrambler
®
(Version 6.1; CAMO, Trondheim,
Norway) with principal component analysis (PCA). Predictability
of QI was analyzed using partial least square regression (PLS)
with full cross validation. The average QI for each storage day, in-
cluding assessment of 3 salmon, was used for this analysis. The
root mean square error of prediction (RMSEP) was calculated for
the model (the prediction error in original units). Bias is the aver-
aged difference between predicted and measured Y-values for all
samples in the validation set. The standard error of performance
(SEP) is the precision of results corrected for the bias. From a
PLS2 model, the initial variance (signal) at zero PCs and the re-
siduals variance (noise) after optimal PCs were plotted as a sig-
nal to noise (S/N) ratio for each panelist and for each word (Mar-
tens and Martens 2000). The significance level was set at 5%, if
Table 1—The QIM scheme for farmed salmon. Revised from Sveinsdottir and others (2001)
Quality parameters Description Points
Skin: Color/appearance Pearl-shiny all over the skin 0
The skin is less pearl-shiny 1
The fish is yellowish, mainly near the abdomen 2
Mucus Clear , not clotted 0
Milky, clotted 1
Yellow and clotted 2
Odor Fresh seaweed, neutral 0
Cucumber, metal, hay 1
Sour, dish cloth 2
Rotten 3
Texture In Rigor 0
Finger mark disappears rapidly 1
Finger leaves mark over 3 s 2
Eyes: Pupils Clear and black, metal shiny 0
Dark gray 1
Mat, gray 2
Form Convex 0
Flat 1
Sunken 2
Gills*: Color/appearance Red/dark brown 0
Pale red, pink/light brown 1
Grey-brown, brown, gray, green 2
Mucus Transparent 0
Milky, clotted 1
Brown, clotted 2
Odor Fresh, seaweed 0
Metal, cucumber 1
Sour, moldy 2
Rotten 3
Abdomen: Blood in abdomen Blood red/not present 0
Blood more brown, yellowish 1
Odor Neutral 0
Cucumber, melon 1
Sour, fermenting 2
Rotten/rotten cabbage 3
Maximum sum (Quality Index): 24
*
Examine the side where the gills have not been cut through
Figure 1—Sampling plan for measurements in the shelf-
life study of salmon at the Icelandic Fisheries Laborato-
ries in November 1999
jfsv67n4p1570-1579ms20010283-SR.p65 5/31/2002, 11:14 AM1572
Vol. 67, Nr. 4, 2002
—
JOURNAL OF FOOD SCIENCE 1573
Sensory and Nutritive Qualities of Food
Shelf life of salmon with QIM . . .
not stated otherwise.
Results and Discussion
Sensory analysis
Quality Index Method
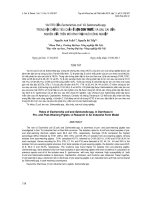
The sum of scores evaluated according to the QIM scheme
(Table 1) was presented as the Quality Index (QI). The QI was cal-
culated for each storage day of sampling and formed a linear re-
lationship with time (Figure 2).
High correlation between the average QI and days in ice was
obtained with a slope of 0.692. The slope was different from the
slope observed by Sveinsdottir and others (2001) using the QIM
scheme for salmon, presumably because of the revision of the
scheme prior to this shelf-life study, including the addition of 2
score attributes. The aim when developing QIM scheme for fish
is to have the regression line begin at the origin (0,0), which was
not reached here, since the intercept was at 1.568. If the line was
forced through the origin, the correlation between the average QI
and days in ice became lower (R
2
= 0.933). The QIM scheme gave
the assessors the opportunity to choose between scores ranging
from 0 to 3 but never a negative number, therefore, allowing for
residuals above zero but not below.
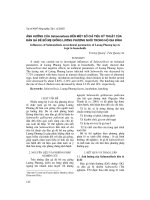
The difference between salmon of the same storage time in
ice was in some cases significant. The results were analyzed with
partial least square regression (PLS) to examine how well the QI
could predict the storage time in ice (Figure 3).
The standard error of performance (SEP) value for the QI was
2.0 (Figure 3). The SEP may be used to evaluate the precision of
the predictability of the QI. Since the QI was the sum of 11 at-
tributes evaluated in the QIM scheme, a normal distribution
could be assumed (O´Mahony 1986). Esbensen and others
(1998) stated that 2*SEP could be regarded as a 95% confidence
interval assuming normal distribution. Therefore, it can be as-
sumed that the QI of a batch (if 3 salmon were assessed) could be
used to predict the storage time with ± 2.0 d. It could be assumed
that including more salmon in the assessment of each batch
might reduce this interval, as observed by Sveinsdottir and oth-
ers (2001), where including 5 salmon per storage day gave a SEP
value of 1.4.
There was a variation in the QI obtained by different panel-
ists (Figure 4). The variation increased with storage time, indicat-
ing that the panelists were in better agreement when analyzing
very fresh salmon with the QIM scheme at the beginning of stor-
age compared to the not-so-fresh salmon at later stages. There
was a tendency for some of the panelists to score either higher or
lower than the average score obtained throughout the storage
time. The variation between the panelists in this study, which
were trained during 2 1-h sessions, was comparable to the varia-
tion between panelists trained during 6 1-h sessions (Sveinsdot-
tir and others 2001) in a similar study. This indicated that the 2
Figure 2—Quality Index of salmon. Averages over each day
of storage analyzed against days in ice.
Figure 3—PLS1 modeling of QIM data from salmon stored
in ice using full cross validation: Measured against pre-
dicted Y values. Average QI for each storage day based
on assessment of 3 salmon used to predict storage time
in d.
Figure 4—Average QI of salmon with storage in ice, as
given by each panelist (1 through 12)
jfsv67n4p1570-1579ms20010283-SR.p65 5/31/2002, 11:14 AM1573
Sensory and Nutritive Qualities of Food
1574
JOURNAL OF FOOD SCIENCE
—Vol. 67, Nr. 4, 2002
Shelf life of salmon with QIM . . .
sessions were sufficient training for the panel.
QIM assumes the scores for all quality attributes increase with
storage time in ice (Figure 5).
The average texture score was determined by pressing a fin-
ger on the spine muscle and observing how the flesh recovered
according to Martinsdottir and others (2001). The scores were
around 0 at storage day 1, as the salmon was in rigor. Propagation
of rigor caused the muscle to relax again, and through storage in
ice, the flesh became soft due to autolysis influenced by both
fish muscle enzymes and microbial enzymes (Gill 1995; Nielsen
1995). The skin became softer or less springy after 17 to 20 d,
where the average score increased from 1 to 1.5. The average
score of skin odor reached only 2 at the end of the storage time.
The score 3 (rotten) was used rarely by panelists. At the begin-
Figure 5—Average scores of each quality attribute assessed with QIM scheme for salmon stored in ice against days
in ice
jfsv67n4p1570-1579ms20010283-SR.p65 5/31/2002, 11:14 AM1574