Applied Wetlands Science - Chapter 12 ppt
Bạn đang xem bản rút gọn của tài liệu. Xem và tải ngay bản đầy đủ của tài liệu tại đây (2.78 MB, 26 trang )
Kent, Donald M. “Watershed Management”
Applied Wetlands Science and Technology
Editor Donald M. Kent
Boca Raton: CRC Press LLC,2001
©2001 CRC Press LLC
CHAPTER
12
Watershed Management
Donald M. Kent
CONTENTS
Managing Watersheds
Elements of Management
Definition and Delineation
Watershed Characterization
Prioritization
Developing and Implementing a Watershed Program
Monitor and Adjust
Source Control
Municipal Wastewater
Best Management Practices (BMPs)
Agricultural BMPs
Urban Stormwater Runoff BMPs
Innovative Solutions
Watershed-Based Trading
Case Study—the Chesapeake Bay Watershed
Anacostia Watershed Restoration
References
Wetlands tend to occupy topographic low points in the landscape and are thus
recipient of water and eroded materials from higher in the landscape. The influx of
water and other materials gives each wetland its character, supports its internal
processes, and in part determines wetland function and value. In meager or excess
amounts, water and other materials may alter or hinder wetland processes and
©2001 CRC Press LLC
diminish functions and values. Therefore, effective wetland management requires
management of parts of the landscape contributing water and other materials to
wetlands. The contributing areas of the landscape constitute the watershed.
The concept of managing at the scale of watersheds has been evolving in the
United States for about 100 years. In the 1890s, the U.S. Inland Waterways Com-
mission recommended to Congress that each river system be treated as an integrated
system. Throughout the first half of the 20
th
century, the focus of watershed man-
agement was on the use of water resources for energy, navigation, flood control,
irrigation, and drinking water (U.S. Environmental Protection Agency, 1995b). In
1944, the Pick-Sloan Plan proposed to reduce flood damage by constructing large
dams. The plan was opposed by some that believed that more effective flood control
could be accomplished by managing rural, upstream watersheds than by constructing
large dams (Peterson, 1998).
During the 1950s and 1960s the management emphasis shifted to protecting
drinking water (U.S. Environmental Protection Agency, 1995b). The Federal Water
Pollution Control Act of 1956 funded publicly owned treatment works, and the Water
Quality Act of 1965 required states to develop standards for interstate waters.
The Clean Water Act and Safe Drinking Water Act of the 1970s and 1980s further
emphasized large-scale protection of water resources. The Clean Water Act estab-
lished a permitting program for point source polluters, provided additional funding
for wastewater treatment and state water quality programs, and authorized programs
to reduce, prevent, and eliminate pollution to surface and ground waters. The Safe
Drinking Water Act established the basis for protecting surface and ground water
supplies with an emphasis on preventing contamination.
In recent years, the focus of water quality management has shifted to include
nonpoint sources of pollution. Watershed management provides a necessary frame-
work for managing nonpoint pollution. As a result, the U.S. Environmental Protec-
tion Agency developed the Watershed Protection Approach (1995a). Through focus
on hydrologically defined resource areas, rather than jurisdictional boundaries, the
Watershed Protection Approach is designed to more effectively protect and restore
aquatic resources and protect human health than the historical approaches. The
Approach targets priority problems, involves stakeholders, seeks integrated solu-
tions, and measures success.
MANAGING WATERSHEDS
A watershed is technically a divide separating one drainage area from another
(Chow, 1964). More commonly, and as applied to watershed management, water-
sheds are areas that drain to surface water bodies. Watersheds come in all shapes,
and range in size from a few to several million km
2
. Depending upon the type and
extent of water quality problems, administrative boundaries, and technical con-
straints, watershed management may be applied to local watersheds, major water-
sheds, river basins, aquifers, or composites of surface watersheds and aquifers.
From a water quality standpoint, watersheds have two elements. Terrestrial
habitats, including urban, suburban, and rural areas, are the sources of particulate
©2001 CRC Press LLC
and dissolved materials. Particulate and dissolved materials derive from wastewater
discharges, stormwater runoff, and erosion. The other element, surface water bodies
including streams, rivers, ponds, lakes, estuaries, and coastal habitats, are the recep-
tacles for particulate and dissolved materials. Materials may become trapped in the
receiving water body or be transported downstream.
Watershed management attempts to sustain and improve water quality by focus-
ing on hydrologically defined resource areas. This is in contrast to historical efforts
to regulate individual point sources of pollution. Watershed management also inte-
grates various efforts to manage nonpoint sources of pollution. A fundamental
premise of watershed management is that water quality and ecosystem issues can
be more effectively addressed at the watershed level than at the level of the individual
waterbody or polluter (U.S. Environmental Protection Agency, 1995a). Because
watershed management addresses both point and nonpoint sources of pollution, it
is an effective mechanism for protecting water and habitat quality.
Several benefits, all of which save time and money, derive from watershed
management’s holistic approach (U.S. Environmental Protection Agency, 1995a, b,
1996a). Regulatory efficiency is enhanced by coordinated monitoring, shared respon-
sibility for assessment, and consolidated permitting. Decision making is improved
by consideration of all stressors affecting water quality, systematic review of water-
shed basins, an increase in the availability and level of detail of watershed informa-
tion, and a pooling of resources. An enlarged information base, systematic review,
and enhanced coordination improve targeting of resources; and resources are focused
on environmental results rather than programmatic activities such as permitting and
reporting. Finally, innovative solutions are encouraged by watershed management,
including ecological restoration, protection of critical areas, wetland mitigation
banking, and watershed-based trading.
Inherent to a successful watershed management program is stakeholder involve-
ment. Stakeholders are individuals and organizations that are affected by water
quality management decisions. This includes state and federal agencies charged with
protecting water quality, businesses that rely on water or discharge waste, and
citizens that use waterbodies and waterways for drinking water or recreation. Stake-
holders share responsibility for monitoring, setting priorities, and developing and
implementing management strategies.
Elements of Management
Watershed management has five elements (see Figure 1):
1. Definition and delineation
2. Characterization
3. Prioritization
4. Program development and implementation
5. Monitoring and adjustment
Each of these elements will now be discussed briefly.
©2001 CRC Press LLC
In addition, watershed management requires development of a project team and
public support. The former may include local, state, regional, and federal regulating
agencies, research scientists, policymakers, trade associations representative of
pollution sources, and nongovernmental organizations. The composition of the
project team will vary with geographic scope and institutional infrastructure. Public
support is important for developing applicable management goals, encouraging
Figure 1
Elements of a watershed management program.
©2001 CRC Press LLC
cooperation among disparate project team members, implementing management
actions, and monitoring success.
Definition and Delineation
Definition and delineation are the selection of management boundaries. Man-
agement boundaries may encompass local watersheds, groups of local watersheds,
river basins, aquifers, or some combination of watersheds, basins, and aquifers.
Ideally, management boundaries should be large enough to benefit from an economy
of scale, take advantage of government and technical expertise, and yet be manage-
able for the long term (U.S. Environmental Protection Agency, 1995a). As mentioned
above, the boundary will in practice reflect the type and extent of the water quality
issues and administrative boundaries. Nested watersheds, where small watersheds
are subsets of larger watersheds, facilitate management at multiple scales (U.S.
Environmental Protection Agency, 1995b). For example, local stakeholders can
manage local watersheds, while state or regional entities can manage river basins.
Watershed Characterization
The watershed should be characterized after the management boundary has been
defined and delineated. The purpose of characterization is to describe the physical
characteristics of the watershed, to determine the water quality status and trends of
watershed waters, and to identify potential water quality stressors and their sources.
The physical description of the watershed should include geology, topography,
soils, land use, hydrology, and significant biological resources. The latter may
include threatened and endangered species and critical habitat. Surface water bodies
should be described with respect to their designated uses and physicochemical and
biological water quality. A baseline water quality monitoring program will need to
be established if existing information is inadequate. Ideally, the baseline program
will include physical, chemical, and biological indicators of water condition (see
Chapter 8).
Potential point (e.g., wastewater treatment facilities, industrial discharges) and
nonpoint (e.g., urban stormwater, agricultural runoff) sources of pollution should be
described by location, type, and absolute and relative loadings to the receiving body
(Table 1). Rarely does one source or one type of pollution cause a problem. Existing
control measures should also be described. Projecting expected watershed demo-
graphics and land use as they relate to potential sources of pollutants is also helpful
at this stage.
Prioritization
Watershed characterization may identify few issues, and available resources
may be sufficient to effect comprehensive management. More likely, the extent and
degree of watershed issues will exceed the resources expected to be available for
management. In such instances, watershed goals, targets, and action items must be
prioritized. Prioritization may be logically directed at individual waterbodies or
©2001 CRC Press LLC
waterways within the watershed (Table 2). Alternatively, specific pollutants or pol-
lutant sources could be prioritized.
Water quality impairments that pose a risk to public health should receive top
priority and be addressed as quickly as possible. Other policy-related criteria include
water quality goals, designated water uses, and waterbody or waterway value. These
criteria are related when the waterbody or waterway is used for drinking water,
commercial fishing, or recreation. Waters with more stringent water quality goals,
greater designated uses, and higher value might reasonably receive high priority.
Table 1 Water Quality Stressors Typically Associated with Land
Uses and Land Use Activities
Land Use or Activity Stressor
Agriculture Sediment
Nutrients
Bacteria
Pesticides
Construction Sediment
Forestry Sediment
Golf courses Nutrients
Pesticides
Impoundments Altered hydrology
Industrial discharge Inorganic and organic chemicals
Metals
Mining Sediments
Metals
Septic systems Nutrients
Bacteria
Urban runoff Sediment
Nutrients
Bacteria
Pesticides
Altered hydrology
Metals
Wastewater treatment facility Nutrients
Bacteria
Table 2 Criteria for Prioritizing Watershed
Management Efforts Directed at Improving
Waterbody and Waterway Water Quality
Degree of waterbody/waterway impairment
Designated use of the waterbody/waterway
Knowledge about water quality, stressors, and sources
Probability of success
Resources available for management
Risk to ecosystem health
Risk to public health
Stakeholder support
Type of waterbody/waterway impairment
Value of the waterbody/waterway
Water quality goals for the waterbody/waterway
©2001 CRC Press LLC
Programmatic criteria, including knowledge about watershed waters, resources
available for management, stakeholder support, and probability of success, also
impact the implementation of management actions. Insufficient knowledge about
the watershed will require a return to the characterization stage. Alternatively,
insufficient knowledge about individual waters may eliminate their consideration
from the management process. In the absence of sufficient resources, some goals,
targets, and action items may have to be eliminated. Lack of stakeholder support
may necessitate initiation of an education program and postponement of actions.
Conversely, projects with stakeholder support will be easier to implement. Goals,
targets, and action items with a high probability of success are important at the
beginning of a watershed management program to demonstrate program effective-
ness to stakeholders.
The type and degree of water quality impairment and ecosystem health relate
directly to the physical, chemical, and biological character of the waterbody or
waterway. Waterbody and waterway water quality can be compared against regula-
tory or designated use standards or against the minimum requirements of aquatic
organisms such as fish. Reviewing plant and animal richness and diversity can assess
ecosystem health. Systems with impaired water quality or poor ecosystem health
may be priorities.
As noted above, the threat to public health will be the superceding criteria for
prioritization. In the absence of a public health risk, other criteria may become
superceding based upon local or regional policy concerns, programmatic constraints,
or stakeholder interest. Nevertheless, particularly in the early stages of a watershed
management program, formalized evaluation of assorted criteria facilitates consid-
eration of multiple perspectives, flexible problem solving, and stakeholder support.
This approach also provides a basis for reevaluating a goal, target, or action item if
circumstances change. A matrix analogous to the site selection criteria matrix illus-
trated in Chapter 5 could be used to ensure careful consideration of all issues.
Developing and Implementing a Watershed Program
Developing and implementing a watershed management program requires
knowledge of the type and degree of water quality problems, the source of the
problems, and the available and achievable solutions. This was achieved in the
characterization stage. The prioritization stage helped determine the sequence of
management actions. This stage has two components: program development and
program implementation.
Program development focuses on defining a strategy for improving watershed
water quality. This is accomplished by setting management goals, targets, and action
items. Goals are long-term visions of the watershed and may be programmatic,
activity-based, centered on best management practices (BMPs) installation, water
quality-oriented, or biological. An example goal might be stating that all surface
waters will support commercial and recreational fisheries by the year 2010. Setting
of additional near-term or interim goals may facilitate continued stakeholder support
and a sense that progress is being made toward long-term goals. Goals are supported
by targets, which are specific, quantifiable objectives. For example, reducing nutrient
©2001 CRC Press LLC
loads by 50 percent and restoring historical riparian vegetation will restore commer-
cial and recreational fisheries. Finally, action items ensure that goals and targets will
be achieved. Action items are specific projects with assigned roles and responsibil-
ities and a scheduled completion date. For example, the local chapter of the ecolog-
ical restoration society will restore bank vegetation along a 1 km stretch of the
headwater stream extending from point A to point B, beginning May 1, 2000 and
completing the restoration by June 30, 2000.
Together, the goals, targets, and action items will be a mix of local and watershed-
wide regulations, management practices, economic incentives, and education and
training programs. Again, one of the benefits of watershed management is the
opportunity for innovative solutions, such as pollution trading (discussed later in
this chapter), ecological restoration (see Chapter 6), and mitigation banking (see
Chapter 7). Installation of controls should be site specific and tailored to hydrology,
topography, geology, the resource to be protected, and politics.
Documentation in the form of a watershed management plan is fundamental to
program development. The plan should describe the watershed, characterize water
quality and pollutant sources, list priorities, and describe the process leading to
setting of goals, targets, and action items. In addition, the plan should define roles
and responsibilities, identify funding sources and mechanisms, establish a schedule,
and describe how program effectiveness will be assessed. Documenting development
of the watershed management program facilitates reevaluation, clarifies intent and
the decision-making process, and serves as a reference for future management. The
plan should be periodically updated.
Program implementation requires reaching consensus on goals, targets, and
action items, developing an organizational infrastructure for effecting controls, and
establishing procedures. Consensus is facilitated by stakeholder involvement in
watershed definition and delineation, characterization, prioritization, and program
development. An organizational infrastructure must carry out management actions,
account for funds, maintain the schedule, and communicate to stakeholders. Controls
must be properly installed and subject to periodic inspection and maintenance.
Effective actions should be documented as procedures and become part of the
watershed plan.
Successful watershed management programs will secure commitments for fund-
ing and installation and management of controls. Commitments should come from
both those implementing and administering actions and from those installing con-
trols. Commitments may be formal or rely on public accountability (U.S. Environ-
mental Protection Agency, 1995a). The former are written and detail expectations
for all parties. The latter provide for public review through meetings or publications.
Funding may derive from the operating budgets of participating organizations,
businesses, municipal bonds, taxes, grants from nonparticipating organizations, dona-
tions, or fees. Additional support may come from in-kind contributions. Large or
complex watershed management programs may benefit from a funding schedule. The
schedule would reflect potential funding sources, application dates, dates funding is
required, and tasks to obtain funding (U.S. Environmental Protection Agency, 1995a).
Ultimately, successful programs have multiple incentives for stakeholder partic-
ipation (Table 3, U.S. Environmental Protection Agency, 1995a). Stakeholders
©2001 CRC Press LLC
should be thoroughly educated about the reasons, goals, and progress of the water-
shed management program. Individuals responsible for implementing, installing,
and maintaining pollution controls should receive adequate training and technical
assistance. Individuals and businesses should be compensated for control costs that
benefit society as a whole.
Monitor and Adjust
Ideally, monitoring will have been effected prior to the implementation of any
management actions to characterize the watershed and provide a baseline for com-
parison, and after the implementation of management actions, monitoring documents
the effectiveness, or ineffectiveness, of the watershed management program. Docu-
mented monitoring results also provide the basis for communicating with stakehold-
ers and facilitate long-term maintenance of pollutant controls.
Perhaps most importantly, monitoring provides a basis for making adjustments
to the watershed management program. Adjustments will be necessary if manage-
ment actions are partly or wholly ineffective at achieving program goals or targets.
Program adjustments will also be necessary if management actions are effective;
goals and targets must be reprioritized. Finally, monitoring provides a basis for
making program adjustments in response to significant land-use changes.
Monitoring plans should derive directly from program goals, targets, and action
items. Continuing with the earlier example, monitoring of native fisheries might
include direct counts of fish, preferably by age class. Depending upon program
goals, monitoring may encompass biological, chemical, physical, and program-
matic parameters (see Chapter 8). Table 4 lists parameters commonly monitored
as part of a watershed management program. Chemical and physical parameters
should be monitored routinely, as well as during storm events, to characterize the
initial flush of pollutants. Biological parameters effectively may be monitored
seasonally or annually.
Voluntary citizen monitoring programs have become increasingly common in
the United States. The success of these programs is dependent upon effective training
and a good quality assurance/quality control program.
Table 3 Incentives for Participating in a Watershed Management Program
(U.S. Environmental Protection Agency, 1995a)
Incentive Description
Cost–Share Payment to polluters for the installation of controls
Education Including function and value of waterbodies and waterways; goals,
targets, and action items; benefits of controls; and progress
Purchase Purchase of critical areas including source water protection areas,
riparian areas, critical habitat, lands from owners unwilling to
institute controls
Regulation Environmental laws and regulations, zoning ordinances, use
restrictions, performance standards
Tax advantage Conservation easements, credits for installation of controls
Technical assistance Installation of controls, training of on-site managers, provision of
procedural documents
©2001 CRC Press LLC
SOURCE CONTROL
Municipal Wastewater
Municipal wastewater contains suspended solids, biodegradable organics (e.g.,
proteins, carbohydrates, fats), pathogens, and nutrients such as nitrogen and phos-
phorus. Depending upon the service area, wastewater may also contain organic and
inorganic carcinogens, mutagens, teratogens, acutely toxic compounds, pesticides,
heavy metals, and dissolved organics. In the absence of high concentrations of the
latter constituents, nutrients are the primary constituents of concern. Excessive
nutrients discharged to aquatic environments increase the growth of undesirable
plants and algae, decrease dissolved oxygen levels, and in some instances promote
ammonia toxicity.
In the early 20th century in the United States, wastewater was discharged directly
to streams and rivers via storm sewers. The accumulation of sludge, odors, and other
unsightly conditions led to the separation of storm drains and sewers, and the
construction of wastewater treatment facilities. Initially, most treatment facilities
provided only primary treatment, which consisted of screening and sedimentation
to remove floating and settleable solids. Later, the U.S. Environmental Protection
Agency mandated secondary treatment as the minimum standard for facilities. Sec-
ondary treatment involves biological and chemical processes to remove most of the
organic matter.
Treated wastewater was historically disposed of by the easiest method possible.
For coastal communities, this may have included ocean discharge, a practice that is
Table 4 Parameters Likely To Be Monitored in a
Watershed Management Program
Type Parameter
Biological Benthic macroinvertebrate richness
Biotic index
Fish and wildlife abundance
Fish and wildlife richness
Vegetation cover or density
Vegetation richness
Chemical Biological oxygen demand
Dissolved oxygen
Nutrient concentration
pH
Toxicants
Physical Suspended solids
Temperature
Turbidity
Programmatic Enforcement actions
Funds received and disbursed
Meetings
Permit issuance
Reports
©2001 CRC Press LLC
increasingly discouraged (Metcalf and Eddy, 1991). Away from the coast, discharge
to inland surface waters is the most common method for disposing of treated
wastewater. Surface discharge relies on the assimilative capacity of the receiving
water, a capacity that has been increasingly exceeded for many waterways in the
latter part of the 20th century. In response, many wastewater facilities are being
required to provide advanced treatment.
Advanced wastewater treatment removes additional suspended and dissolved
substances, especially nitrogen and phosphorus. At conventional treatment facilities,
advanced processes remove nitrogen by biological nitrification and denitrification,
separate stage biological denitrification, airstripping, breakpoint chlorination, and
ion exchange (Metcalf and Eddy, 1991). Phosphorus is removed by chemical pre-
cipitation with metal salts or lime, and filtration. Microorganisms can also be stressed
to force additional phosphorus uptake.
Large wastewater facilities exceed the treatment needs and financial resources
of small communities. Clustered homes may use a package treatment facility. More
typically, rural homes will use on-site treatment consisting of a septic tank and
disposal field. BOD, SS, N, P, bacteria, and viruses are the primary constituents of
concern with on-site disposal. Onsite systems should be set back from surface and
ground waters, the distance of the setback contingent upon system capacity and soil
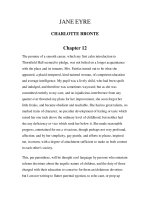
permeability (Metcalf and Eddy, 1991). Schueler (1995) has noted that more than
one on-site septic system per 2.8 ha can result in shellfish bed closures (Figure 2).
Figure 2
On-site septic systems located too close to coastal waters can result in shellfish
bed closures.
©2001 CRC Press LLC
Natural treatment systems have many of the same treatment processes as con-
ventional facilities (e.g., sedimentation, filtration) and have additional, unique treat-
ment processes (e.g., photosynthesis, plant uptake). Land-based and wetland systems
effect treatment of municipal wastewater. Both types of systems are preceded by
mechanical pretreatment including fine screening and primary sedimentation.
The three fundamental types of land treatment are slow rate, rapid infiltration,
and overland flow (Metcalf and Eddy, 1991). Slow rate systems are potentially the
most effective land treatment and entail the application of wastewater to vegetated
land to provide treatment and irrigation. Wastewater is consumed by plants and is
evapotranspirated. Treatment is effected in large part by wastewater percolation
through the soil. Rapid infiltration systems entail the intermittent application of
wastewater to shallow, unvegetated infiltration or spreading basins. As with slow
rate systems, treatment occurs as wastewater percolates through the soil. Overland
flow systems are relatively less effective than slow rate and rapid infiltration systems
and are used in areas with relatively impermeable soils. Wastewater is distributed
across the upper part of a graded, vegetated slope, and runoff is collected in ditches
at the toe of the slope. Treatment is effected primarily by evapotranspiration.
Wetland systems are inundated areas supporting aquatic vegetation (Kadlec and
Knight, 1996). Filtration, sedimentation, precipitation, plant uptake, and other pro-
cesses effect significant reduction and removal of wastewater constituents. Chapter 9
discusses wetland treatment systems at length.
Best Management Practices (BMPs)
Best management practices (BMPs) are operational procedures designed to
reduce pollutant discharge to surface water or groundwater and to minimize changes
to hydrology and hydraulics. BMPs reduce the pollutant load by reducing the volume
of discharge water, reducing the concentration of pollutants in discharged water, or
both. A watershed management program may include agricultural and urban BMPs
(Tables 5 and 6).
Agricultural BMPs
Modern agricultural practices rely on fertilizers and pesticides to increase crop
yield. Excess or misapplied fertilizer can cause algal blooms, stimulate growth of
noxious plants, and decrease available oxygen for fish and other aquatic organisms.
High concentrations of nitrogen may cause methemoglobinemia (see Chapter 5).
Pesticides can be chronically or acutely toxic to humans and aquatic organisms.
Agricultural practices may also be accompanied by excessive erosion. Sediment
erosion increases surface water turbidity and may smother benthic organisms. Nutri-
ents, pesticides, and heavy metals occur in particulate form or can be attached to
dirt, sediment, and detritus. Sediment accumulation may also alter waterway hydrol-
ogy and hydraulics by increasing flow velocity and decreasing flow capacity.
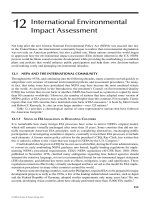
Fertilizer BMPs operate by reducing the amount of fertilizer used and retaining
unused fertilizer on-site (Bottcher et al., 1995; South Florida Water Management
District, 1999). BMPs include soil chemistry management and calibrated soil
©2001 CRC Press LLC
testing, banding and split application, on-site retention of drainage water, and
buffer zones (Table 5, Figure 3). Soil chemistry management maintains the soil
pH to maximize the availability of nutrients to plants, minimize nutrient leaching,
and immobilize metals. Calibrated soil testing bases fertilizer recommendations
on yield–response curves developed by correlating soil nutrient levels with crop
yields. Banding places fertilizer in strips adjacent to plant roots and is most
effective for crops without a continuous root mat. Split application is the practice
of applying half the total amount of fertilizer semi-annually rather than all at one
time. Buffer zones between crops and surface waters help prevent the misappli-
cation of fertilizer to adjacent surface waters.
Pesticide BMPs rely heavily on educating and training applicators (Florida
Department of Agriculture and Consumer Services and the Florida Department of
Environmental Protection, 1998). Mixing, loading, and equipment washdown loca-
tions should be permanent, consisting of an impermeable surface located close to
the storage building. Impermanent mixing, loading, and washdown locations should
be relocated frequently to prevent the accumulation of pesticides to toxic levels.
Both permanent and impermanent facilities should be located away from surface
Table 5 Best Management Practices
(BMPs) for Agriculture
Fertilizer control
Banding fertilizer
Calibrated soil testing
Cover crop
On-farm retention of drainage water
Soil chemistry management
Split application
Pesticide control
Buffer zone
Spill management
Integrated pest management
Mixing, loading, and washdown location
Precise application
Sediment control
Bank contouring
Bank stabilization
Sediment traps and settling basins
Table 6 Best Management
Practices (BMPs) for
Urban Stormwater Runoff
Buffer zones
Fertilizer management
Green parking lots
Land-use restrictions
Limit soil disturbance
Minimize impervious surface
Stormwater retention and treatment
©2001 CRC Press LLC
waters. As with fertilizers, establishment of buffer zones between crops and surface
water will minimize the inadvertent application of pesticides to water resources.
Establishing formal practices and procedures effects spill management. For example,
containers are stored upright with tight, closed covers in sealed bottom, covered
facilities. Any spills are contained with barriers and absorbent material. Precise
application reduces the quantity of pesticide used on the crop. Techniques include
controlled droplet technology, canopy-dimension spray machine discharge towers,
drift control agents, spray calibration and maintenance, and minimized bandwidth.
Pesticide quantities can be further reduced through integrated pest management
(IPM). IPM encompasses a broad spectrum of practices that cumulatively minimize
pests (Leslie, 1994; Florida Department of Agriculture and Consumer Services and
the Florida Department of Environmental Protection, 1998). Key pests and beneficial
organisms are identified, and cultural practices are implemented to minimize pests
and enhance biological controls. Practices include soil preparation, crop rotation,
use of resistant crop varieties, variable planting dates, modified irrigation, and cover
crops. Beneficial organisms may also be augmented. Chemicals are applied only
when pests are present.
Sediment erosion can be minimized by increasing ditch sideslopes to reduce
erosion potential, contouring the top of the bank away from surface waters, and
stabilizing the bank (Bottcher et al., 1995; South Florida Water Management District,
1999). The latter can be achieved by using rock gabions at the water line, rip-rap,
or establishing rooted plants. Sediment that escapes the site can be captured in
settling traps and basins. Sediment traps are barriers placed in widened sections of
Figure 3
Buffer zones between fields and surface waters minimize misapplication and filter
runoff.
©2001 CRC Press LLC
ditches or canals. The traps slow water velocity, inducing the settling of particles.
Settling basins are sumps in the bottom of ditches or canals that collect suspended
particles. Accumulated sediments must routinely be removed from sediment traps
and settling basins.
Urban Stormwater Runoff BMPs
In urban and suburban areas, runoff from impervious substrates is an important
contributor to watershed degradation. Impervious cover increases stream peak dis-
charge, velocity, and volume. The increase in flows widens streambanks and down-
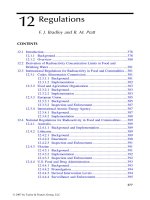
cuts the streambed. In addition, impervious surfaces collect pollutants from the
atmosphere, vehicles, and other sources which are, in turn, transferred to surface
waters during storm events (Figure 4). Stormwater runoff constituents include nutri-
ents, metals, hydrocarbons, bacteria, and viruses (Bingham, 1994). Stream degrada-
tion, including disruption of benthic communities and fisheries, occurs at 10 to 25
percent impervious cover (Hollis, 1975; Garie and McIntosh, 1986; Luchetti and
Fuersteburg, 1993; Schueler, 1995). Minimizing lot setbacks, decreasing road
widths, and narrowing or eliminating sidewalks can reduce the amount of impervious
cover. Clustering development can reduce the amount of impervious surface by 10
to 50 percent, primarily by reducing roadways (Schueler, 1995).
Figure 4
Pollutants from the air, vehicles, and other sources are transferred from parking
lots to surface waters during storm events.
©2001 CRC Press LLC
Runoff from impervious surfaces can be retained and treated using stormwater
BMPs. Stormwater BMPs include in-line treatment methods like inlets, catchbasins,
sump pits, and oil and grit separators (Schueler, 1987; England, 1997). However,
in-line BMPs have limited storage capacity, and large storm events tend to resuspend
trapped particles. Frequent maintenance is required. End of pipe BMPs include
detention basins and retention ponds, vegetated filters, and filtration and infiltration
devices. These BMPs are discussed at length in Chapter 5.
The principles of impervious surface reduction and stormwater retention and
treatment can also be extended to parking lots (Schueler, 1995). To reduce surface
area, spaces can be allotted for compact cars. The use of porous pavement and
interlocking pavers instead of asphalt and concrete increases infiltration and
decreases runoff. Stormwater retention and treatment can be effected by directing
surface runoff to specially designed areas within or adjacent to the parking lot (Bitter
and Bowers, 1994). These areas filter or infiltrate runoff.
Other methods for reducing watershed degradation from urban runoff include
land use restrictions, buffer zones, limiting soil disturbance, and fertilizer manage-
ment. Land use restrictions can prevent development in, or in close proximity to,
critical areas such as streams, floodplains, riparian zones, shorelines, wetlands, and
steep slopes. Buffer zones between critical areas and development offer additional
protection by preventing inadvertent or indirect impacts. Buffer zones also provide
filtering and infiltration of runoff and reduce disturbance to wildlife. Limiting soil
disturbance on construction sites to the immediate work area, and implementing
sedimentation and erosion controls, will minimize transport of soil and other particles
to aquatic resources (see Chapter 5). Lawn and garden fertilizers can be managed
in much the same way as described for agricultural areas to prevent eutrophication
and methemoglobinemia.
INNOVATIVE SOLUTIONS
Watershed management provides opportunities for innovative problem solving.
Chief among these are habitat restoration, mitigation banking, and watershed-based
trading. Wetland enhancement, restoration, and creation are the subject of Chapter 6,
and mitigation banking is the subject of Chapter 7. Watershed-based trading is
discussed next.
Watershed-Based Trading
Watershed-based trading is an exchange of effluent control responsibility
between pollutant dischargers to achieve water quality objectives (U.S. Environmen-
tal Protection Agency, 1996b; Commonwealth of Virginia, 1996). A market-based
approach, watershed-based trading enables a pollutant source with a high cost of
control to purchase allowances from dischargers elsewhere in the watershed with a
lower cost of control. Allowances are a quantity of effluent the discharger is allowed
to release. The exchange of allowances does not increase overall effluent discharge
in the watershed.
©2001 CRC Press LLC
Several potential benefits accrue from watershed-based trading to regulators,
trading partners, and the community at large (U.S. Environmental Protection Agency,
1996b). Economically, the cost of pollutant control is reduced for individual dis-
chargers by purchasing the least expensive option and taking advantage of economies
of scale. As a direct corollary, the overall cost of managing water quality in the
watershed is reduced. Dischargers that sell allowances reap direct financial benefits.
Environmentally, watershed-based trading may achieve equal or greater water quality
for the same or less cost, provide an incentive to polluters to go beyond the minimum
pollutant reduction required, and encourage innovation. Innovation may address
broader goals like conservation and preservation, ecological restoration, and endan-
gered species protection. Socially, watershed-based trading encourages dialogue
among stakeholders. Programmatically, watershed-based trading provides managers
with a flexible approach for accelerating watershed-wide water quality improvement
programs for point and nonpoint sources of pollution.
Participants in a watershed-based trading program could include point source
dischargers, indirect dischargers (i.e., industrial or commercial operations that dis-
charge to a treatment facility), and nonpoint sources. Trading might occur intra-
facility, between point source dischargers, between indirect dischargers, between
nonpoint sources, or between point and nonpoint sources (Table 7). Fundamentally,
a trading program requires a buyer to compensate the seller to reduce pollutant loads
sufficiently to bring both facilities or land uses into compliance with discharge or
water quality standards. The basis for the trade may be total maximum daily load
or another expression of total effluent per unit of time that establishes a loading
capacity for the defined area. Alternatively, the basis for the trade may be a point
source permit. Public or private banks that buy and sell pollutant allowances may
also effect trading.
Trading systems may take one of three forms (Commonwealth of Virginia, 1996).
Open trading systems represent a slight departure from the typical permit process
by allowing regulated sources to modify permits to reflect an exchange of pollution
control requirements. Allowances are only created when a source discharges less
than the amount allowed under the permit. A closed trading system establishes an
effluent discharge limit for a specified group of dischargers within a geographical
Table 7 Types of Watershed-Based Trading (U.S. Environmental Protection Agency,
1996b)
Intra-facility trading A facility cost-effectively allocates pollutant discharges among
outfalls
Point source to point
source trading
A point source purchases an allowance from a second point source
rather than reduce its own pollutant discharge
Pretreatment trading An indirect discharger purchases an allowance from a second
indirect discharger rather than increase its own pretreatment
Nonpoint to nonpoint
source trading
A nonpoint source polluter purchases an allowance from a second
nonpoint source polluter rather than enhance its own control
practices
Point to nonpoint
source trading
A point source purchases an allowance from a nonpoint source
rather than reduce its own pollutant discharge
©2001 CRC Press LLC
area. Responsibility for effluent control is delegated to individual group members,
and trading can only occur if total effluent discharge does not exceed the prescribed
limit. A full closed system extends the closed system concept to all effluent discharge
sources within the watershed. All point and nonpoint sources are assigned an initial
allocation of allowances. As with closed systems, new pollutant sources are only
permitted by acquiring existing allowances.
Development of an effective watershed-based trading program requires consid-
eration of several issues. Trading demand is created when discharge limits are
constrained. When trading demand is created, there should be a clear transfer of
financial and legal obligations. Trading is most effective when partners are close, as
effluent distribution will shift with increasing distance. Nonpoint sources and best
management practices are more difficult to quantify than point sources. Trades
between point sources and nonpoint sources should include a trading ratio that favors
the point source to compensate for this uncertainty. Monitoring of receiving waters,
best management practices, and finances is essential.
CASE STUDY—THE CHESAPEAKE BAY WATERSHED
Management of the Chesapeake Bay watershed illustrates many of the principles
and practices discussed throughout this chapter. Chesapeake Bay is the largest
estuary in the United States (Figure 5). The Bay is home to more than 2700 species
of fish and wildlife, and is surrounded by 15 million people. A total of 48 major
tributaries drain over 25,910 ha in Maryland, New York, Pennsylvania, Virginia, and
West Virginia. The Bay is shallow, averaging only 8 m, and has a ratio of land area
to water volume of 10 to 1.
Exacerbated by shallow water and the large land-to-water ratio, the Chesapeake
Bay’s decline was evident in the 1950s, but it was not until the 1970s that scientists
attributed the decline in Bay water quality to three factors: excess nutrients, sedi-
ment, and toxic chemicals. Nutrients originated from domestic wastewater dis-
charges and agricultural and stormwater runoff. Agricultural areas, construction
sites, and erosion were the source of sediments. Toxic chemicals originated with
businesses within the watershed.
Initial efforts to reverse the decline in Chesapeake Bay water quality focused on
upgrading wastewater treatment facilities. However, these efforts were insufficient
to accomplish Bay restoration, leading to comprehensive efforts to control nonpoint
sources of pollution. In 1983, the governors of Virginia, Maryland, Pennsylvania,
the mayor of the District of Columbia, and the U.S. Environmental Protection
Agency agreed to cooperate toward solving Chesapeake Bay water quality problems.
In 1987, the Chesapeake Bay Executive Council, as it became known, established
a goal of reducing nutrient input to the Bay by 40 percent from 1985 levels by the
year 2000. Several interrelated programs, including the Chesapeake Bay Preservation
Act and the Anacostia Restoration Agreement, have been developed to accomplish
this goal.
The Virginia General Assembly enacted the Chesapeake Bay Preservation Act
in 1988 to establish a cooperative program between state and local governments to
©2001 CRC Press LLC
reduce nonpoint source pollution. Inherent to the Act is an effort to balance economic
interests and water quality concerns by requiring the use of resource management
practices for environmentally sensitive lands. The Act establishes a relationship
between local land use decisions and water quality protection by granting local
governments the authority to manage water quality. With the exception of towns that
drain directly to the Atlantic Ocean, all cities and counties bordering on tidal waters
(i.e., Tidewater, VA) are required to comply with the Act.
Figure 5
The Chesapeake Bay and Anacostia River (shaded area) watersheds.
West Virginia
Pennsylvania
New York
Virginia
©2001 CRC Press LLC
The Act established the Chesapeake Bay Local Assistance Board. The Board is
comprised of nine individuals representing various locales and interests such as
agriculture, environmental management, nonagricultural businesses, and govern-
ment. According to the Act, the Board is charged with promulgating and maintaining
regulations, providing technical and financial assistance to Tidewater governments,
providing technical assistance and advice to regional and state agencies, and ensuring
that local government plans and ordinances are in compliance with Act regulations.
The Board is assisted by the Chesapeake Bay Local Assistance Department
(1995), a state agency in the Secretariat of Natural Resources. The Department
provides technical assistance and advice to local governments. Assistance includes
administering a grants program, interpreting Act regulations, compliance reviews of
comprehensive plans and ordinances, and review of private development plans. The
Department also provides training for local planners and engineers.
The Board promulgated Chesapeake Bay Preservation Area Designation and
Management Regulations in 1989. The Regulations establish a framework for com-
pliance and require local Tidewater governments to adopt a water quality program.
Listed in the Regulations are 11 performance criteria (Table 8). Local programs,
which tend to differ among localities, adopt or amend local land use plans and
ordinances to incorporate water quality protection measures consistent with the Act.
Program compliance has three phases.
Phase I objectives include determining the geographic and ecological extent of
environmentally sensitive lands, mapping said lands, designating Chesapeake Bay
Preservation Areas, and implementing water quality performance criteria. Chesa-
peake Bay Preservation Areas are those lands that have the potential to most directly
impact water quality. These are lands that protect water quality, Resource Protection
Areas (RPAs), and lands that could potentially damage water quality, Resource
Management Areas (RMAs).
RPAs are presumed to filter pollutants from runoff and include a 30 m landward
buffer. Development within RPAs is restricted to water dependent projects, redevel-
opment, water wells, passive recreation, and historic and archeological activities.
Table 8 Chesapeake Bay Preservation Area Designation and Management
Regulations Performance Criteria (Chesapeake Bay Local Assistance
Department, 1995)
Minimize impervious cover
Minimize disturbed land
Preserve existing vegetation
Pump out septic tanks every 5 years and require 100 percent reserve drainfields for new
development
Erosion and sediment control for disturbances greater than 2500 ft
2
No net increase in stormwater pollutant loadings for new development and 10 percent reduction
in loadings for redevelopment
Plan review for developmemt exceeding 2500 ft
2
Agricultural conservation plans
Forestry best management practices
Evidence of wetland permits prior to clearing or grading
Regular and periodic best management practice maintenance
©2001 CRC Press LLC
RMAs are contiguous with the inland boundary of RPAs. If improperly used or
developed, RMAs have the potential to degrade water quality or otherwise damage
RPAs. RMAs include lands with highly erodible soils or steep slopes, highly per-
meable soils, 100-year floodplains, and nontidal wetlands not included in RPAs.
Development is permitted in RMAs in accordance with performance standards.
Local governments can designate parts of RPAs and RMAs as Intensely Devel-
oped Areas under certain conditions. More than 50 percent of the land area must be
covered by impervious surface, the land area must have public water and sewer, or
the existing housing density must be 10 or more units per ha. The designation is
intended to encourage redevelopment and infill activity rather than new development.
Phase II objectives require local governments to adopt a Comprehensive Plan or
Plan Amendment that incorporates water quality protection measures consistent with
the Act. The Comprehensive Plan provides a policy framework for community
development. Act regulations require that the comprehensive plan address physical
constraints to development, protection of potable water supplies, shoreline erosion,
access to waterfront areas, and redevelopment. Local governments may include other
elements in the Comprehensive Plan. For example, Table 9 lists policies of the
Fairfax County, Virginia Comprehensive Plan, which emphasize prevention of pol-
lution from nonpoint sources (Fairfax County, 1990).
Phase III objectives require local governments to adopt or revise a zoning
ordinance (e.g., erosion and sediment control) that protects water quality consistent
with the Act. Many local governments amend existing ordinances to encompass the
11 performance criteria listed in the Act. Phase III provides local governments with
an opportunity to revisit the criteria and incorporate language specific to their local
land use management program. An evaluation of the compatibility of Act regulations
with local development standards also occurs in Phase III.
Nutrient pollution in the watershed is declining, but additional efforts are required
(Chesapeake Executive Council, 1996; Chesapeake Bay Program, 1999). Phosphorus
loads to the bay were reduced by 2,721,500 kg per year between 1985 and 1997,
and the 40 percent reduction goal is likely to be achieved. Nitrogen loads declined
by 14,515,000 kg per year, but additional reductions are needed to achieve the 40
percent reduction goal. Gains in nonpoint source nitrogen reduction were offset by
increases in point source nitrogen. Additional reductions to achieve the 40 percent
goal may come from upgrades to wastewater treatment facilities, an option that was
Table 9 Policies of the Fairfax County, Virginia Comprehensive Plan Designed to
Prevent and Reduce Pollution of Surface Waters
Implement a best management practice (BMP) program
Update BMP requirements as more effective strategies become available
Minimize impervious surfaces
Minimize the application of fertilizers, pesticides, and herbicides to lawns and landscaped areas
Preserve stream valleys when locating and designing stormwater dentention and BMP facilities
Update erosion and sediment regulations; minimize grading
Retrofit stormwater management ponds to become BMPs
Monitor BMP performance
Maintain high standards for discharges from point sources
©2001 CRC Press LLC
earlier rejected because of cost. Nutrient reductions have not markedly improved
water clarity in the Bay.
Other indicators suggest the program is having an impact. Many waters of the
watershed that had been closed to fishing because of kepone contamination have
been reopened. Industries within the watershed reduced chemical releases by 67
percent between 1988 and 1997. More than 700,000 ha of farmland were placed
under nutrient management (i.e., comprehensive plans for efficient nutrient use)
between 1985 and 1997. Restoration efforts have reforested 350 km of riparian
zone, and fish passage construction and barrier removal have reopened 1000 km of
spawning habitat.
Anacostia Watershed Restoration
The Anacostia River watershed is a critical area within the Chesapeake Bay
Program and illustrates management approaches at a local level. The Anacostia River
has a 70 ha watershed in the state of Maryland and the District of Columbia. Water
quality problems in the Anacostia are largely attributed to combined sewer overflows,
urban runoff, and erosion from construction activities and surface mining operations
(Metropolitan Washington Council of Governments, 1990; Anacostia Restoration
Team, 1991). The situation has been exacerbated by a 75 percent reduction in
watershed forest cover.
The State of Maryland, Montgomery and Prince George (Maryland) Counties,
and the District of Columbia initiated the Anacostia Restoration Agreement in 1987.
The Anacostia River Restoration Committee is the primary oversight group and is
comprised of representatives from the aforementioned entities, County and District
of Columbia departments, state and federal agencies, and nongovernmental organi-
zations. Various policy and technical committees coordinate the participation of more
than 60 different agencies.
The Restoration Committee established broad water quality, biological, land use,
and outreach goals for the Anacostia watershed (Table 10). The primary program-
matic mechanism for accomplishing these goals is the development of Subwatershed
Action Plans (SWAPs). SWAPs detail the schedule and location of watershed
projects and are intended to streamline the approval of individual projects and define
roles and responsibilities. Each SWAP will assess water quality and the aquatic
community, define goals and targets, identify management opportunities, prioritize
projects, and monitor results. In addition, each SWAP will develop plans to increase
wetlands and forest cover within the subwatershed.
Management actions are focused on implementation of basin-wide controls,
stream restoration, and communicating with stakeholders (Metropolitan Washington
Council of Governments, 1990). Basin-wide controls include abatement of combined
sewer overflows, retrofitting of urban stormwater controls, new discharge restrictions
on point sources of pollution, enhanced stormwater and sediment control regulations
for development, and surface mine reclamation. Stream restoration efforts include
the establishment of stream buffers, riparian restoration, streambank stabilization,
and fish habitat enhancement. The progress of the basin-wide controls and stream
©2001 CRC Press LLC
restoration efforts is being assessed through baseline, performance, and storm event
water quality sampling, and biological and habitat surveys.
Considerable effort is being devoted to communicating watershed issues, project
goals, and results to stakeholders (Metropolitan Washington Council of Govern-
ments, 1998). An annual report details the implementation of controls, restoration
efforts, and monitoring results. A quarterly newsletter is devoted to citizen accom-
plishments and restoration activities. Subbasin educational documents have also been
developed. In addition, subbasin coordinators promote public participation through
slide presentations, stream walks, and clean-up efforts.
The Anacostia Watershed Restoration Program continues to make progress
toward its goals (Metropolitan Washington Council of Governments, 1998). Instal-
lation of a swirl concentrator facility has reduced floatable material and total phos-
phorus discharges from the largest combined sewer overflow by 25 to 30 percent.
No fish kills have been reported in the river since 1992, and submerged aquatic
vegetation has begun to reestablish itself in lower sections of the river. Stream
restoration projects have been initiated and completed, and native fish reintroduced
to part of the watershed have survived. Anadromous fish spawning habitat has been
increased by 30 km by removal and modification of barriers to fish movement. Tidal
and nontidal wetlands have been created, and amphibians have been restored to
vernal pool habitats. More than 25,000 trees have been planted on 20 ha in support
of riparian forest restoration. The Interstate Commission on the Potomac River Basin
public outreach program has communicated to more than 60,000 people, and the
Anacostia River Education Center was established by the District of Columbia and
the Potomac Electric Power Company. Efforts continue to control stormwater runoff
and high sediment loads and to expand recreational opportunities in the watershed.
REFERENCES
Anacostia Restoration Team,
A Commitment to Restore Our Home River: A Six Point Plan
to Restore the Anacostia River
, Metropolitan Washington Council of Governments,
Washington, D.C., 1991.
Bingham, D. R., Wetlands for stormwater treatment, in
Applied Wetlands Science and
Technology
, Kent, D. M., Ed., Lewis Publishers, Boca Raton, FL, 1994, 243.
Bitter, S. and Bowers, J., Bioretention as a water quality best management practice,
Water
Prot. Tech
., 1(3), 114, 1994.
Table 10 Goals of the Anacostia River Restoration Committee
Reduce pollutant loads in the tidal estuary by the turn of the century
Enhance aquatic diversity and provide for an urban fishery
Restore the spawning range of anadromous fish
Increase the acreage of tidal and nontidal wetlands
Expand the range of forest cover and create a contiguous corridor
Make the public aware and increase volunteer participation
Adapted from Metropolitan Washington Council of Governments, 1992. With
permission.
©2001 CRC Press LLC
Bottcher, A. B., Izuno, F. T., and Hanlon, E. A., Procedural Guide for the Development of
Farm Level Best Management Practice Plans for Phosphorous Control in the Everglades
Agricultural Area, Version 1.1, Circular 1777, University of Florida Cooperative Exten-
sion Service, 1995.
Chesapeake Bay Local Assistance Department, A Guide to the Bay Act, 1995.
Chesapeake Bay Program, The State of the Chesapeake Bay: A Report to the Citizens of the
Bay Program, EPA 903-R99-013, CBP/TRS 222/108, Annapolis, MD, 1999.
Chesapeake Executive Council, Commonwealth of Virginia Shenandoah and Potomac River
Basins Tributary Nutrient Reduction Strategy, final comment draft, Virginia Secretary of
Natural Resources, Chesapeake Bay Local Assistance Department, Department of
Conservation and Recreation, Department of Environmental Quality, 1996.
Chow, V. T.,
Handbook of Applied Hydrolog,
McGraw-Hill, New York, 1964.
Commonwealth of Virginia, Commonwealth of Virginia Shenandoah and Potomac River
Basins Tributary Nutrient Reduction Strategy, Virginia Secretary of Natural Resources,
Virginia Chesapeake Bay Local Assistance Department, Virginia Department of Conser-
vation and Recreation, and Virginia Department of Environmental Quality, 1996.
England, G., Stormwater sediment control using baffle boxes and inlet devices, in
Proceedings
of the Fifth Biennial Stormwater Research Conference
, South Florida Water Management
District, 1997, 142.
Fairfax County, Policy Plan: The Countywide Policy Element of the Comprehensive Plan for
Fairfax County, Virginia, 1990.
Florida Department of Agriculture and Consumer Services and the Florida Department of
Environmental Protection, Best Management Practices for Agrichemical Handling and
Farm Equipment Maintenance, 1998.
Garie, H. and McIntosh, A., Distribution of benthic macroinvertebrates,
Water Res. Bull.
, 22,
447, 1986.
Hollis, G., The effect of urbanization on floods of different recurrence intervals,
Water Res.
Res.
, 11(3), 431, 1975.
Kadlec, R. H. and Knight, R. L.,
Treatment Wetlands
, Lewis Publishers, Boca Raton, FL, 1996.
Leslie, A. R., Ed.,
Integrated Pest Management for Turf and Ornamentals
, Lewis Publishers,
Boca Raton, FL, 1994.
Luchetti, G. and Fuersteburg, R., Relative fish use in urban and nonurban streams,
Proceedings
of the Conference on Wild Salmon
, Vancouver, Canada, 1993.
Metcalf and Eddy,
Wastewater Engineering: Treatment, Disposal, and Reuse
, 3rd ed.,
McGraw-Hill, New York, 1991.
Metropolitan Washington Council of Governments, The state of the Anacostia: 1989 status
report, prepared for the Anacostia Watershed Team, Washington, D.C., 1990.
Metropolitan Washington Council of Governments, Anacostia Watershed Restoration Progress
and Conditions Report, 1990–1997, prepared for the Anacostia Watershed Restoration
Committee, 1998.
Peterson, J. W., Meet the National Watershed Coalition,
Land Water
, January/February,
10, 1998.
Schueler, T.,
Controlling Urban Runoff—Practical Manual for Planning and Designing Urban
Best Management Practice
s, Metropolitan Washington Council of Governments,
Washington, D.C., 1987.
Schueler, T.,
Site Planning for Urban Stream Protection
, prepared for the Metropolitan
Washington Council of Governments, Washington, D.C., 1995.
South Florida Water Management District, Guidebook to Develop a BMP Environmental
Protection Plan, draft, 1999.