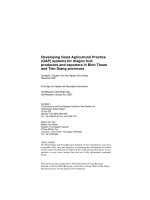
Báo cáo nghiên cứu khoa học: "COMBINATION OF VACUUM PRELOADING AND ELECTROOSMOTIC FOR IMPROVEMENT OF SOFT SOIL - AN EXPERIMENTAL STUDY" pot
Bạn đang xem bản rút gọn của tài liệu. Xem và tải ngay bản đầy đủ của tài liệu tại đây (287.26 KB, 10 trang )
COMBINATION OF VACUUM PRELOADING AND
ELECTROOSMOTIC FOR IMPROVEMENT OF SOFT SOIL - AN
EXPERIMENTAL STUDY
Prof. Dr. Wang BaoTian; MSc. Vu Manh Quynh
Geotechnical Research Institute, Hohai University, Nanjing 210098, P. R. China
1. Introduction
1.1. Fundamentals of vacuum preloading
The concept of vacuum preloading technique first introduced by Professor W. Kjellman at the Royal
Geological University in Sweden (1952) is an effective method to improve the strength of clayey soil. The basis
procedure of vacuum preloading consists in removing atmospheric pressure from a confined sealed medium of
soil to be consolidated and maintain the vacuum during a pre-determined period of time. The technological
problems associated with this method include: maintaining an effective level of vacuum and an effective drainage
system under the membrane that expel water and air throughout the whole pumping duration; maintaining a leak
proof system in particular at the pumps/membrane connections and over the whole membrane area; sealing of
the system at the periphery; and reducing lateral seepage towards the vacuum area. The basis technical
principle of this method is that instead of increasing the effective stress in the soil mass by increasing the total
stress by means of conventional mechanical surcharging, vacuum assisted consolidation preloads the soil by
reducing the pore pressure while maintaining constant total stress.
In comparison with conventional surcharge preloading, vacuum preloading has some remarkable advantages
like: the increase in effective stress is equiaxial, the lateral pressure is therefore compressive one, there is no
shear failure and the preloading can be applied at a rapid rate. No surcharge loading is necessary and the
requirement for other construction activities is greatly reduced (Qian
et al
., 1992). Especially vacuum preloading
has lower cost compared to conventional surcharge preloading. In the Tianjin New Harbour project, the
calculation indicated that the overall cost for vacuum preloading is about 2/3 of that for surcharge preloading
(Qian
et al.,
1992). Vacuum preloading is especially useful for very soft clay when using surcharge preloading
alone is not feasible, because it is difficult to place a fill embankment several meters high on it (Chu, J., and Yan,
S.W., 2005). It should be noticed that, one of the outstanding features of vacuum preloading method is that it is
used with prefabricated vertical drains (PVDs) almost every time to shorten the drainage paths and employ the
radial coefficient of permeability of soils,
k
h
. In most deposits, the horizontal coefficient of permeability,
k
h
, is
about three times greater than the vertical one,
k
v
. Hence, in most of the calculation methods one considers only
the horizontal drainage of soil and neglecting the vertical drainage (Hansbo S. 1981, Indraratna B. and Redana I.
W. 2000).
2.1. Fundamentals of Electroosmotic
Electroosmotic was first demonstrated and used successfully as dewatering tool in Germany by Leo
Casagrande in 1936, and since then the method has been used successfully in many occasions in North
America, Europe, and China. Electroosmotic (EOM) is the process wherein positively charged free water in a
clay-water system moves from the anode to the cathode. Upon application of a direct current, cations in the
diffused double-layer of water moves toward the cathode to gain electrons and thereby become discharged. As
the cations move, they carry water with them so that there is a new movement of water toward the cathode.
Consolidation will result if water is removed at the cathode but not replaced at the anode (D. T. Bergado and
M.A.B. Patawaran, 2000).
The electrokinetic phenomenon in soils includes three main components: electroosmosis, electrophoresis,
and ion migration (see Fig. 1). Electroosmosis is defined as the movement of pore water results from an applied
electrical potential gradient with the electrical gradient acting as the driving force. Electrophoresis is defined as
the movement of charged suspended solids in a fluid because of an applied electrical potential gradient. Ion
migration is defined as the movement of charged soluble ions in the pore fluid results from the applied electrical
potential (Shang J.Q. and Lo K.Y., 1997).
Fig 1.
Principle of Electroosmotic
For existing tailing ponds, installation of horizontal electrodes may not be technically or economically
feasible. The vertical electrode configuration may be used in these cases. On the other hand, horizontal
electrode configurations are preferred for new reclamation project like disposal ponds (Shang J.Q. and Lo K.Y.,
1997).
It should not be confused between the electroosmotic drainage flow, electroosmotic permeability coefficient,
k
e
, and hydraulic drainage flow, hydraulic permeability coefficient,
k
. The magnitude of the
k
e
is principally
dependent on the electric potential gradient, the chemistry of the soil-water system, and the relationship between
the pore water tension and the intergranular stresses, and can be determined by laboratory test. The average
values of
k
e
for typical soils, including sands, range from about 2x10
-5
to 5x10
-5
cm/sec per volt/cm (Casagrande
L. 1983). According to Cassagrande (1952) the electroosmotic transportation of water in soil mass due to
electroosmotic can be described by the equation (Bjerrum L et al. 1967):
. . .
e
V
Q k At
L
(1)
w
here
Q
(cm
3
) is the amount of water transported through an area
A
(cm2),
V/L
is the applied electrical
gradient in volts per centimeter,
k
e
is the electroosmotic permeability coefficient and has the dimensions cm/s per
volt/cm.
The coupled-flow equation for water flow under hydraulic and electrical gradients acting simultaneously can
be written in one-dimensional form as (Wan T.Y. and Mitchell J.K., 1976):
w h e
f f f
(2)
Or
h
w e
w
k
u V
f k
x x
(3)
Where
f
w
=the discharge velocity of water;
f
h
=the flow rate of water induced by the hydraulic gradient;
f
e
=the
flow rate of water induced by electrical gradient;
V
=the voltage; and
k
h
=the hydraulic permeability coefficient.
The electroosmotic permeability coefficient,
k
e
, is an indicator of how quickly a soil can be dewatered.
Comparison of the coefficient of electroosmotic permeability, ke, with the coefficient of hydraulic permeability, k,
may illustrate why electroosmotic is such a useful tool for dewatering fine-grained soils. Casagrande L. (1983)
had indicated that, if one assumes for a clay values of
k
= 5x10
-8
cm/sec and
k
e
= 4x10
-4
cm/sec per volt/cm, and
an applied voltage gradient of
i
e
= 0.5 V/cm and an effective consolidation stress equivalent to a hydraulic
gradient of i = 10, the time required for an equal reduction in water content would be:
2H
2
O4H+O
(g)
+4e
-
[H
+
] increases
pH decreases
2H
2
O+2e
-
H
2(g)
+2OH
-
[H
+
] decreases
pH increases
Base
FrontFront
Acid
Electrolysis Electrolysis
Ion - Migration
Electro-phoretic Particle flow
D.C. Power supply
Electro-osmotic water flow
Cathode (-)Anode (+)
400
e
t t
(4)
Where
t
,
t
e
are the required time for hydraulic consolidation and electroosmotic consolidation, respectively.
In other words, for a given assumptions, it would take 400 times as long to effect the same degree of
improvement in a clay deposit by loading the surface, as it would by applying electroosmotic.
1.3. Combination of two methods, the aim of stydy
The advantages of vacuum preloading applied at the bottom (VAB method) in comparison with that applied
on the top of soil layer (VOT method) has been stated by Vu M.Q
et al
. (2007). It was found out that the VAB
method is much more effective than the VOT method on soil improvement. The undrained shear strength
C
u
of
soil is increased to a greater degree, about 35%, by the VAB method. The VAB method is also less time
consuming. Otherwise, it is easier to create vacuity in the whole soil mass and it has greater effective depth of
soil improvement.
Finding a more advanced and better solution for subsoil improvement is always a demand and challenge for
geotechnical engineers.
system
*Note: Drainage pipes system, Anodes, and sand mat are placed in advance
surface
slurry
Vacuum
Row of
supply
Original
ground
Cathodes (-)
Anodes (+)
-
+
Power
Sand blanket
-
++++++++
Tight membrane
pump
Peripheral
trench
Slurry wall
Impervious
Sand mat
Horizontal drainage
Prefabricated
vertical drains (PVDs)
Filling land
(dredged from sea/river bed)
Ground surface
Original
Fig 2.
Suitable reclamation projects for application of combined method
Originating from the idea of a combination of vertical and horizontal drainages, in order to assess the
probable effectiveness of vacuum preloading incorporated with electroosmotic treatment of silty clay for
reclamation projects like new disposal ponds where horizontal electrode configurations beneath soil layer are
possible and the drainage pipes and PVD system could be easily installed in advance before the sludge dragged
over from sea bed or river bed is filled into the site (see Fig 2), a laboratory test program was undertaken. The
VAB vacuum preloading method was applied, from now on it is concisely called vacuum preloading. The anode
was placed on the top and the cathode was placed beneath the soil layer. It means that the drainage force
created by electroosmotic is in vertical direction from top downward to bottom.
2. Experimental program
2.1. Materials
Three series test with six soil samples were conducted on silty clay dragged from Qin Huai River in Nanjing.
China. Each series included two soil samples with the same water content. One sample was tested under the
vacuum preloading of 80kPa only and the other was tested under vacuum preloading of 80kPa and direct current
electricity of voltage gradient of 0.15V/cm simultaneously. Table 1 lists typical properties of the silty clay before
testing.
2.2. Testing apparatus
The testing apparatus used in this study, as showed in Fig. 3, is developed by Geohohai. It is able to
simultaneously apply vacuum pressure on soil sample at a desirable value and a direct current electric field. It is
also capable to measure the pore-water pressure at different depth of soil layer, vertical settlement and volume
change during the test. The soil sample is placed in a cylindrical container made by Plexiglas of 100cm in height
and 18.5cm in inner diameter. A vacuum moderator is used to adjust the required vacuum pressure and keep it
stable during the test. The moderator is plugged into an airtight, graduated, and transparent glass bottle. This
bottle has two functions, first function is to control the vacuum pressure through the vacuum moderator, second
function is to collect water expelling from the soil sample during the test. A dial gauge is mounted on the top of
the sample to record the settlement along the elapsed time. In addition, the vacuum gauges could be mounted at
different levels at 0.02
h
0
(
T
position), 0.26
h
0
, 0.5
h
0
, 0.74
h
0
, and 0.98
h
0
(
B
position)
of soil column to measure the
pore pressure at different depths with elapsed time. For the tests presented in this paper, the vacuum pressure
was applied at the
B
position. In the case of applying a direct current electric field, a variable voltage DC power
supply will be used; two aluminum plate electrodes are placed on top, which is the anode, and at bottom of the
soil layer, which is the cathode. The plate electrodes, particularly the anode was perforated and covered by a
filter cloth to prevent entry of solids.
Table1.
Typical properties of silti clay
Parameters Series 1 Series 2 Series 3
Natural water content
W
(%)
Liquid limit
W
l
(%)
Plastic limit
W
p
(%)
Plasticity index
PI
(-)
Specific gravity
G
s
(-)
Dry density
d
(g/cm
3
)
Undrained shear strength,
C
u
(kPa)
Initial void ratio
e
(-)
Degree of saturation
S
r
(%)
Permeability,
k
(x 10
-6
m/sec)
92.6
53.35
26.95
26.4
2.72
0.73
0
2.71
100
8.82
102.8
54.29
31.41
22.98
2.72
0.72
0
2.8
100
8.82
98.7
52.68
30.52
26.16
2.72
0.73
0
2.78
100
8.82
DC Power supply
Variable-Voltage
(circular porous plate)
Anode (+)
Cathode (-)
B
T
Dial gauge
flaxible airtight cover
intermediary box
400
100
Silty clay soil
Power supplier
(4.5 x 25mm)
PVD
sand mat (40mm)
(negative pore pressure)
vacuum gauge at different depths
vacuum line
vacuum line valve
water collector (mm)
1000
vacuum pressure controller
vacuum pressure moderator
vacuum pump
185
(circular porous plate)
Volts
Fig 3.
Description of the testing apparatus
2.3. Specimen preparation and testing procedure
After the soil was dragged from the Qin Huai River and packaged in plastic bags, it was left for several days
to expel the extra water that attached with the soil during the dragging until the soil became as closely as
possible to its original status under the river bed. The rubbish was carefully taken away from the soil to prevent
its effects to the test result.
Three test series, under vacuum preloading only and under vacuum preloading incorporated with
electroosmotic method, were performed. In order to avoid any difference between the different parts of sample,
the soil needs to be mixed carefully to make sure that the water content is the same for the whole sample. In
order to reduce the fiction between the soil and inner surface of cylinder, the inner surface of cylinder was
V
V
V
lubricated with a lubricant. Before the soil sample is placed into the cylinder, a layer of sand mat with the
thickness of 4.0cm is laid in advance at the bottom of the cylinder.
Three PVDs with horizontal cross section size of 25mm in length and 4.5mm in width were installed in
triangular shape. The equivalent diameter of singular PVD is calculated by (Hansbo, 1981):
d
w
=2(
a
+
b
)/
=1.88cm (5)
The drain influence zone is therefore calculated by (Bergado et al., 1996):
D
e
=1.05
S
=14.7cm (6)
Where
S
=14cm is the gap between PVDs in triangular pattern (see Fig. 4). As shown in Fig. 4 the influence
zone of PVDs sufficiently covered the whole area of horizontal section of cylinder. Finally, the soil sample was
covered with a rubber membrane to ensure the vacuity of the soil sample during the test. After placing the soil
sample into the container it was left for one or two days to consolidate by self gravity and then the vacuum
pressure or vacuum pressure incorporated with direct current electric field was applied.
The settlement, the pore water expelled from the soil sample, and the pore pressure were monitored during
the test period. The tests were continued until it could be observed that most of the sample had been treated, or
until the rate of discharge decreased to a small fraction of the initial values. After that the index tests and pocket
CPT tests were performed. As far as possible, the test specimens were selected so as to avoid the portions of
the treated samples in the immediate vicinity of the anode and the cathode.
3. Results and Discussion
Three test series with six soil samples were conducted under vacuum pressure of 80kPa only and vacuum
pressure of 80kPa incorporated with direct current electric field of voltage gradient of 0.15V/cm. The results of
the tests are summarized, presented, and discussed in the following sections.
3.1. Water content, soil density, and degree of saturation
The water content was determined and presented in table 2, for average values, and illustrated by Fig 5 for
different depths of residual soil sample. Table 2 indicates that vacuum preloading already had remarkable effect
on the reduction of water content. The water content was decreased by 28.8%, 37.6%, and 34.6% for test series
1, series 2, and series 3, respectively. However, the combined method treatment performed better effect on
dewatering of pore water. The water content was decreased by 35.4%, 42.6%, and 39.2% for test series 1,
series 2, and series 3, respectively.
Real PVD: a=0.45cm,
b=2.5cm
14
Normalized PVD:
d
w
=1.88cm
Influence
zone
Fig 4.
PVDs installation
Similarly, Fig. 5 shows that for both methods, the deeper the soil, the higher the value of water content.
Otherwise, at every depth of soil the water content resulted by the combined method is lower than that resulted
by vacuum preloading only. It can be simply explained by that vacuum preloading method with the use of
prefabricated vertical drains (PVDs) mostly takes advantages of horizontal drainage and ignores the vertical
drainage or even assumes that there is no drainage in vertical. When vacuum preloading is incorporated with
electroosmotic, then both the horizontal and vertical drainage must be considered, because as mentioned above
in sub-heading 1.2 that the electroosmotic drainage flow could be 400 times faster than hydraulic drainage flow
for a given assumptions. Resultant drainage flow may be described by Fig. 6. If the vertical hydraulic
permeability coefficient of soil is assumed to be very small and can be ignored, it could be supposed that the
resultant drainage flow induced by combined method may be calculated by the equation:
2 2
ve v e
Q Q Q
(7)
The average degrees of saturation
S
r
of soil after the tests are summarized in table 3. It shows that in both
cases, the soil changed from saturated state to unsaturated state. This means that
S
r
can not be used as an
evidence of other phenomena such us the decrease of void ratio or increase of shear strength for this case.
Table 2.
Average water content (w,%)
Series 1 Series 2 Series 3
(1)* (2) (1) (2)** (1) (2)
Before test
After test
92.6
63.8
92.6
57.2
102.8
65.2
102.8
60.2
98.7
64.1
98.7
59.5
Reduction 28.8(%) 35.4 (%) 37.6 (%) 42.6 (%) 34.6 (%) 39.2 (%)
* (1) vacuum preloading, ** (2) combined method
Table 3.
Average Degree of saturation after the test
Series 1 Series 2 Series 3
Vacuum preloading only
Combined method
0.96
0.95
0.97
0.95
0.96
0.97
0.0
0.1
0.2
0.3
0.4
0.5
0.6
0.7
0.8
0.9
1.0
45 50 55 60 65 70 75
Water conten (%)
Depth (x Residual height H
0
)
series 2-vacuum only
series 2-Vacumm+EOM
series 1-vacuum only
series 1-vacuum+EOM
series 3-vacuum only
series 3-vacuum +EOM
horizontal
water flow
Electro-osmotic water flow
Cathode (-)
Anode (+)
PVD PVD
ve
v
e
Q
Q
Q
Fig 5.
Water content versus depth
Fig 6.
Resultant drainage caused by combined method
In a similar manner, the dry densities at different depths of soil are illustrated in Fig. 7. It also shows that
for all test series the dry densities gained by combined method have higher values than that resulted by
vacuum preloading only. The average values of dry density of soil gained by combined method for test
series 1, 2, and 3 are respectively about 10.9%, 14.9%, and 14.5% higher than that gained by vacuum
preloading method. On the other hand, Fig. 7 indicates that for both testing methods, the deeper the soil the
lower the value of soil density. These obviously indicate that the combined method is more effective on soil
improvement. The water content was to a greater degree decreased and the dry density was to a greater
degree increased.
-
Q
e
:
Drainage flow induced
by EOM only.
- Q
v
: Drainage flow induced by vacuum preloading
only.
-
Q
: resultant
drainage flow induced
by combined
0.0
0.1
0.2
0.3
0.4
0.5
0.6
0.7
0.8
0.60 0.70 0.80 0.90 1.00 1.10 1.20
Dry density
d
(g/cm
3
)
Depth (x Residual height H
0
)
Series 1-vacuum only
Series 1-vacuum+EOM
Series 2-vacuum only
Series 2-vacuum+EOM
series 3-vacuum only
Series 3-vacuum+EOM
0.0
0.1
0.2
0.3
0.4
0.5
0.6
0.7
0.8
0.9
5 10 15 20 25 30 35 40
C
u
(kPa)
Depth ( x Residual height H
0
)
Cu-series1-V only
Cu-series1-V+EOM
Cu-series2-V only
Cu-series2-V+EOM
Cu-series3-V only
Cu-series3-V+EOM
Fig 7.
Dry density versus depth
Fig 8.
Undrained shear strength C
u
versus depth
3.2. Atterberg Limits
Table 4 summarizes the results of the tests on liquid limit, plastic limit, plasticity index, and is given to
illustrate the effect of electroosmotic treatment individuals on Atterberg limits of the soil.
The following general observation can be made: (a) Treatment increased the liquid limit by about 16-22%,
with the effect being substantially more at the anode than at the cathode. In other words, the magnitudes of the
changes decrease towards the cathode; (b) the plastic limit was slightly increased, by about 11-13% at most; (c)
As a result of these combinations of factors, the plasticity index was also increased and the liquidity index was
substantially decreased.
Table 4.
Effect of electroosmotic treatment on index properties
Series Duration (days) LL (%) PL (%) PI
1 11
Before
After (anode)
After (cathode)
53.35
64.35
61.65
26.95
31.16
30.55
26.4
33.2
31.1
2
12
Before
After (anode)
After (cathode)
54.29
66.31
63.15
31.41
35.47
34.85
23.0
30.8
28.3
3
12
Before
After (anode)
After (cathode)
52.68
65.54
62.12
30.52
33.89
33.45
22.3
31.6
28.7
The liquid limit of the soil was increased, which is an advantage and indicative of fundamental changes in
the soil properties as a result of electric treatment which causes the chemical changes that occur during the
electroosmosis. The effects of electroosmotic field treatment on the soil properties of a soft sensitive clay were
studied by Lo and Ho (1991). They demonstrated that the increase in liquid limit may be due to the increase of
salt content and carbonate content of the soil after treatment. These factors result in the increase in bonding of
soil particles and reduction in the thickness of the double layer. As a result, the soil becomes less sensitive.
However, the magnitudes of these changes decrease towards the cathode. Near the cathode, there may be
little or no change in the plasticity depending on the length of treatment (Casagrande, 1983). In accordance
with the results of other investigations (e.g. Bjerrum et al. 1967, Morris D.V. et al. 1985), the liquidity index of
the material would seem to be a suitable indicator of the overall change in material properties.
3.3. Undrained shear strength C
u
The pocket CPT test was implemented to find the
C
u
of soil. The initial undrained shear strength of soil
before the test was almost zero. The results of undrained shear strength at different depths of soil are presented
in table 5 and Fig. 8. It is showed by Fig. 8 that the
C
u
gained by combined method is much higher than that
gained by vacuum preloading only. Particularly, a side effect of electroosmosis is the heating of the soil near the
anodes. The anodic end of the soil sample gradually became so desiccated that the soil attained the strength of
a soft rock. The same phenomenon was observed by the study of Cassgrande D.R. et al. (1986). Table 5
indicates that for three test series, the average value of
C
u
gained by combined method, without including anodic
parts, are about 32% higher than that resulted by vacuum preloading. This difference may be primarily because
the water content gained by combined method was more decreased, the dry density was more increased or in
other words, the void ratio was more decreased. These factors result in the increase of shear strength of soil.
For clearer understanding,
C
u
curves are again illustrated with void ratio curves in Fig. 9. It obviously shows
that these two curve groups are in reverse direction, the higher depth of soil the higher void ratio and the smaller
value of
C
u
. In addition, the higher value of
C
u
curve corresponds with smaller value of void ratio curve.
Table 5.
Average undrained shear strength Cu (kPa)
Series 1 Series 2 Series 3
(1)* (2)** (1) (2) (1) (2)
Before test (kPa)
After test (kPa)
0
14.2
0
19.1
0
15.5
0
20.5
0
16.3
0
21.8
Differences by two methods (%) 35.06% 32.06% 33.7%
* (1) vacuum preloading, ** (2) combined method
0.0
0.1
0.2
0.3
0.4
0.5
0.6
0.7
0.8
0 5 10 15 20 25 30 35 40 45 50 55 60 65 70 75 80 85 90 95 100
C
u
(kPa) &
e x 50
(-)
Depth (xResidual height H
0
)
Cu-series1-V only Cu-series1-V+EOM Cu-series2-V only
Cu-series2-V+EOM e-series2-V+EOM e-series2-V only
e-series1-V+EOM e-series1-V only Cu-series3-V only
Cu-series3-V+EOM e-series3-V only e-series3-V+EOM
0
1000
2000
3000
4000
5000
6000
7000
8000
0 20 40 60 80 100 120 140 160 180 200 220 240 260 280 300
Time (hours)
Drainage flow (cm3)
Series 2-vacuum only
Series 2-combined method
Series 1-combined method
Series 1-vacuum only
Figre 9.
Undrained shear strength C
u
and normalized void ratio
Fig 10.
Drainage flow versus time
3.4. Drainage flow
The drainage flows of the tests (for series 1 and series 2) are presented in Fig. 10. It obviously shows that
the total water volume dragged out from the soil by using combined method is normally greater than that by
vacuum preloading only. It was also observed that for the case of vacuum preloading, normally after about 7
days there was no discharge water anymore. It can be stated that after 7 days the vacuum pressure has no more
effect on dewatering. On the other hand, for using combined method, after 7 days there was still water
discharging. This can be explained by the principle of vacuum preloading and electroosmotic treatments that the
vacuum preloading can probably only absorb the free pore water; meanwhile electroosmosis generally occurs in
fine clay soils and consists of the movement of the polar water ions through the diffuse double layer of clay from
the anode toward the cathode.
Water flows through the diffuse double layer of saturated clay under an electrokinetic potential due to the
negatively charge surface of the clay particles. The water is oriented in such a manner by the applied
electrokinetic field that the positive pole is attracted to the negatively charged clay surface and simultaneously,
the negative pole is repulsed from the negatively charged clay surface. It can be said that vacuum preloading
plays primary role in earlier stage for extruding the free pore water; meanwhile electroosmotic method is most
effective in later stage for absorbing water in diffuse double layer of soil. It was also observed that when the
electrodes are horizontally placed as in the combined method, there was no crack appeared in cathode zone,
which often happenes for the cases the electrodes are vertically placed.
4. Results and Discussion
The experimental study to assess the potential effectiveness of vacuum preloading incorporated with
electroosmotic treatment on silty clay has been described in this paper. The excess pore-water pressure at
different depths, settlement, and volume change were monitored during the consolidation process. Based on the
measurements and above analyses, the following conclusions of the study can be drawn:
- Both methods produce great effects on the improvement of soft soil. However, the combined method is more
effective.
- The water content, void ratio, and dry density gained by combined method are better than that gained by
vacuum preloading alone. Full treatment reduced the water content by about 33% for vacuum preloading method
and 40% for combined method, with reduction on the top of soil layer more than that at the bottom. Particularly,
the reduction of water content near the anode was much more than that near the cathode for combined method.
- The combined method increased the liquid limit by about 16-22%, with the effect being substantially more at
the anode than at the cathode.
- The plastic limit was also increased, by about 11-13% at most. As a result of the combinations of factors, the
plasticity index was also increased, and the liquid index was substantially decreased.
- The drainage flow of combined method is greater than that of vacuum preloading method alone.
- In comparison with vacuum preloading method alone, the undrained shear strength
C
u
of soil gained by
combined method has increased to a greater degree, especially near to the anode, the soil revealed like soft
rock. The average difference between the undrained shear strength gained by the two methods is about 32%.
References
1.
Barron, R.A
. Consolidation of fine-grained soils by drain wells.
Transactions ASCE
,
Vol. 113, 718-754, 1948.
2.
Bergado D.T.
and
Patawaran M. A. B
. Recent developments of ground improvement with PVD on soft Bangkok
clay.
Proc. Intl. Seminar on Geotechnics in Kochi 2000, Kochi, Japan, 2000.
3.
Bergado, D.T., Manivannan, R., Balasubramaniam, A.S.
, Proposed criteria for discharge capacity of
prefabricated vertical drains.
Geotextiles and Geomembranes, 14, 481–505, 1996.
4.
Bjerrum L., Moum J.,
and
Eide O.
Application of electroosmosis to a foundation problem in Norweygian quick clay.
Geotechnique, Vol.17, 214-235, 1967.
5.
Casagrande D. R., Casagrande L
., and
Castro G
. Discussions Improvement of sensitive silty clay by
electroosmosis.
Canadian Geotechnical Journal, 23, 95-96, 1986.
6.
Casagrande L.
Stabilization of soils by means of electro-osmosis State-of-the-art.
Geotechnical section of the Boston
society of civil engineers section, ASCE, 255-302, 1983.
7.
Chu J., Yan S. W.
Estimation of degree of consolidation for Vacuum preloading projects.
International J. of
Geomechanics, vol. 5, No.2, 158-165, 2005.
8.
Hansbo S.
Consolidation of fine-grained soils by prefabricated drains.
Proc. of the 10
th
Int. Conf. Soil Mechanics and
Foundation Engineering, Stockholm
,
Vol. 3, 677-682, 1981.
9.
Indraratna B., Redana I. W.
Numerical modeling of vertical drains with smear and well resistance installed in soft
clay.
Can. Geotech. J. 37: 132-145, 2000.
10.
Kjellman, W.
Consolidation of clayey soils by atmospheric pressure.
Proceedings of a conference on soil
stabilization, Massachusetts institute of technology
,
Boston: 258-263, 1952.
11.
Lo KY
and
Ho KS
The effects of electroosmotic field treatment on the soil properties of a soft sensitive clay.
Canadian
Geotechnical Journal. 28, 763-770, 1991.
12.
Morris Derek V., Sydney F. Hills
, and
Jack A. Caldwell
. Improvement of sensitive silty clay by
electroosmosis.
Canadian Geotechnical Journal, 22, 17-24, 1985.
13.
Qian J. H., Zhao W. B., Cheung Y. K
., and
Lee P. K. K.
The theory and practice of vacuum preloading.
Computers
and Geotechnics, 13, 103-118, 1992.
14.
Shang J.Q
. and
Lo K.Y
. Electrokinetic dewatering of a phosphate clay.
Journal of Hazardous Materials, Vol.55, 117-
133, 1997.
15.
Vu M.Q
. and
Wang BT
. Effects of vacuum preloading regard to its applying position on soil improvement.
Proc. of the
MDCMS 1, Vol. 2, 283-290, Hanoi, Vietnam, 2007
.