Báo cáo nghiên cứu khoa học: "STUDY ON A NEW PRECAST POST - TENSIONED BEAM COLUMN JOINT SYSTEM" ppsx
Bạn đang xem bản rút gọn của tài liệu. Xem và tải ngay bản đầy đủ của tài liệu tại đây (452.57 KB, 9 trang )
STUDY ON A NEW PRECAST POST - TENSIONED BEAM -
COLUMN JOINT SYSTEM
Do Tien THINH
Ph.D. Student, Dept. of Architecture, Yokohama National University,
Koichi KUSUNOKI
Associate Professor, Dept. of Architecture, Yokohama National University, Dr. Eng
Akira TASAI
Professor, Dept. of Architecture, Yokohama National University, Dr. Eng.
1. Introduction
Precast concrete buildings were known as cost-effective, well-controlled quality, and fast, easy erection on
site. In Japan, up to now, the design philosophy for precast concrete buildings is to simulate cast-in-situ concrete
structure behavior with strong connection. The common approach is connecting precast element by cast-in situ
concrete and topping slab [1]. Recently, new design philosophy was developed for precast concrete frame
building. In this philosophy, the connections are detailed to be weaker than the precast elements and are
allocated as location of ductile inelastic deformation. The precast elements are designed to have adequate
margin strength over that of the connection and will remain elastic under seismic response. Consequently, the
precast elements would not need to be detailed for ductility, hence resulting in economies. Moreover, in many
cases, ductile connection could be designed to be replaceable at much lower cost than repairing of damage to a
ductile reinforced concrete [2].
Pampanin, S. et al. (2006) developed and tested a new hybrid system in that unbonded post-tensioned steel
was used together with external energy dissipaters and shear bracket. However, the test specimens in this
experiment just simulated short-span frame and no gravity load was apply to the beam to simulate the actual
situation [3].
The objectives of this study is design new type of connection which post-tensioned steel resists the moment
induced by seismic and gravity loads, and shear bracket resists the shear force induced by the gravity load. The
connection should have well performance at design level of loading, easy and rapid for erecting and
disassembling. In order to investigate the performance of the connection, gravity load was applied together with
the cyclic load. This study focuses on the exterior connection in upper stories of a large span frame building,
where the gravity load dominates the design of the connection. Two test specimens, one with shear bracket and
the other without shear bracket were designed and tested. The behavior of two specimens was recorded and
compared.
2. Experimental Program
2.1. Specimens Outline
The test specimens were taken to represent exterior beam-column connection at the 10
th
floor of a
twelve-story office building, of which story height is four meters and the span length is eighteen meters. The
columns and beams sections are 800 x 800 mm and 600 x 1000 mm, respectively. The test specimens modeled
the region from mid-column height below the joint to the mid - column above the joint and the region from the
joint to the mid - span of the beam. There were two specimens in this study. The first, named SP1, was designed
without shear bracket. The second, named SP2, was designed with shear bracket to resist the shear force
induced by the gravity load. Due to the limitation of the loading system, test specimens were scaled down to
one-half scale of the prototype and the beam length was shortened from 4.5m to 2.415m. Brief information of the
test specimens are shown in table 1.
Table 1.
Specimens outline
Specimens SP1 SP2
b x D (mm) 300 x 500 300 x 500
PC bars
2
26 P
y
=834 kN 2
15 P
y
=382 kN
Initial prestressed force 0.7P
y
=592 kN 0.7P
y
=267 kN
PC length, mm 1500 1500
Cracking moment, (kNm) 101.7 48.2
Beam
Yield moment, (kNm) 187.7 86
Column b x D (mm) 400 x 400 400 x 400
Shear Bracket (mm) no 120x19
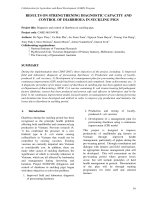
2.2. Specimens Design
The specimens were designed following ductile connection philosophy in which flexural and the shear
strength of the beams and columns were higher than that of the connection. Dimensions and reinforcement
details of two specimens is shown in Figure 1. The beam and column sectional dimensions are 300 x 500 mm
and 400 x 400 mm, respectively. The longitudinal reinforcements for the beam are 4D19 at both top and bottom
sides, and the stirrups are 4D10 with the space of 100mm. In the beam end area of which length is 250mm from
the column face, the stirrups were provided at closer space of 50mm. Column longitudinal reinforcement are
12D22 uniformly arranged around the perimeter, while the hoops are 2D10 at 100mm space.
The demand moment and shear force at the beam end were 86 kNm and 288 kN, respectively. In the
specimen SP1, the PC steel was designed to resist all the demand moment and shear force, while in the
specimen SP2, the shear force induced by the gravity load was carried by the shear bracket, and the PC steel
was designed to resisted the demand moment and shear force induced by the seismic load.
Figure 1.
Reinforcement details of specimens SP1, SP2
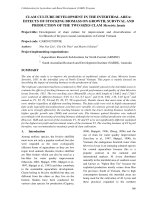
Figure 2.
Details of the shear bracket, SP2
The moment strength at opening (the crack propagates though the sectional centre of the beam) of the beam
at the column face was calculated by the formula [4]:
3
.DN
M
cr
(1)
where:
N
is the initial prestressed force,
N
= 0.7
P
y
, and
D
is the beam height.
Yield moment strength was calculated as:
2
.
9.0
DP
M
y
y
(2)
In the specimen SP1, shear force was carried by the shear friction at the beam and column interface. The
volume of PC steel was designed as follow:
N=Q/
(3)
w
here:
N
is the total initial prestressed force,
N=0.7P
y
,
P
y
is the yield load of the PC steel,
provided by the
manufacturer,
Q
is the total shear
force at the beam end, and
is the friction coefficient
,
= 0.5 follow the
guidance of AIJ [5],
N
= 576 kN, hence
P
y
= 823 kN. Applied 2
26 SBPR 785/1030 PC bars with yield load
P
y
=834 kN larger than required
P
y
= 823 kN, corresponded yielded moment strength is
M
y
= 187.7 kNm, satisfy
to resist demand moment of 86 kNm.
In the specimen SP2, 2
15 SBPR 1080/1230 PC bars with yield load
P
y
=382 kN were used. Corresponded
moment and shear strength were 86 kNm and 133.7 kN, respectively. It can be seen that with the existence of
the shear bracket, the required volume of the PC steel was greatly reduced. The PC bars were arranged at the
middle level of the beam to avoid yielding of the PC steel at large drift level.
The shear bracket in specimen SP2 was designed as a simple corbel welded to a steel plate that embedded
in the column. Shear strength of the bracket was calculated as:
Lw
y
s
Qa
F
Q
35.1
9.0
(4)
where:
Q
s
is the shear strength of the bracket,
F
y
is yield strength of the steel plate,
a
w
is the shear resistance
area,
a
w
=
h
x
t
,
h
and
t
are the height and thickness of the bracket, respectively, and
Q
L
is the shear force at the
beam end induced by the gravity load,
Q
L
= 255 kN. The bracket with the dimensions of 120 x 19 mm was
applied. The length of shear bracket is calculated as follows:
tms
LbDRl 4.0
(5)
w
here:
R
is the maximum target beam end rotation,
D
is the beam height (mm),
b
m
is the grout thickness (mm),
and
L
t
is the manufacture tolerance (mm).
Here
R
= 4% = 0.05,
b
m
= 20mm,
L
t
= 10mm, hence
l
s
= 40 mm. Applied
l
s
= 50 mm in order to prevent failure
of beam by stress concentration at the place where top face of the bracket get in touch with the beam.
The bracket was welded to a steel plate which connected to the studs. The shear force and moment from the
bracket was transferred to the column though these studs. At the beam end, in order to prevent the concrete
from large concentrated stress, an inverted U-shaped steel box was used. The detail of the bracket and inverted
U-shaped steel box is shown in Figure 2.
The concrete and grout materials were tested at the starting and finishing days of the experiment, and
average values of test results are shown in Table 2.
Table 2. Test result of usage materials
Design strength (N/mm
2
)
b (N/mm
2
)
Ec (N/mm
2
)
t (N/mm
2
)
Concrete 60 60.4 36510 3.8
Grout 60 68.1 3.2
Steel Usage
y
(N/mm
2
)
u
(N/mm
2
)
y
(%)
Es
(N/mm
2
)
D6(SD345) Spiral 410.2 535.3 0.23 194280
D10(SD295) Stirrup 329.3 459.9 0.39 171011
D19(SD295) Beam main bar 337.7 521.6 0.18 188566
D22(SD345) Column main bar 386.2 555.9 0.22 183244
T16(SN490C) U-shaped box 369.0 533.9 0.26 201949
T19(SN490C) Bracket 357 536.4 0.20 205046
2.3. Specimens Construction
The specimens were casted from the same batch of concrete in vertical direction. At the concrete age of 8
days, the gap between the beam and the column was filled by the cement grout. A steel mesh was used to
reinforce the grout and prevent it from spalling down at high drift level. Fifty-one days after casting, the beams
were prestressed to the column.
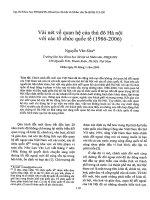
2.4. Test Setup and Testing Sequence
a. Experimental setup
The experimental setup is shown in
Figure
3. The lower end of the column was connected to the strong floor by the pin while the upper end was
connected to the reaction wall by the horizontal two-end pin brace that equivalent to a vertical roller. The cyclic
load was applied to the beam end by the 1000 kN vertical hydraulic jack that attached to the beam end with the
pin. A concentrated vertical load of 255 kN was applied to the beam to simulate the total dead load and live load
of 9.8 kN/m
2
. Because the main aim of applying this load was to create the shear force at the beam end, hence it
was applied as near the column face as possible. However, because of the limit of the loading system, the load
was put at the distance of 215 mm from the column
face.
Figure 3. Test setup
b. Loading history
The loading history is shown in Figure 4. The first two cycles was loaded by the force control. The peak
values were 0,1Q and 0,5Q, where Q is the story shear force that corresponded with yielding of the PC bars.
After that, displacement control was used with the peak displacements of 0.25%, 0.5%, 0.75%, 1%, 1.5%, 2%,
3%, 4% story drift. Two cycles were carried at each story drift level. However, after finishing target drift of 4%, the
load was applied as pushover loading up to 6% story drift in positive direction. It should be noted that the vertical
load was applied before starting of cyclic load and exist all time during the test.
Figure 4. Loading history
c. Data acquisitation system
The gravity load, cyclic load, and PC load were measured by loadcells. The story drift was measured by the
system shown on Figure 5. The rigid frame was attached to the top and bottom pin of the column and the
transducer was fixed on the frame to measure vertical displacement of the beam end. The opening of the beam
at column face, vertical slip of the beam were also monitored. The strains of PC bars, four beam stirrups closest
to the column face, four hoops of the column within the joint, column longitudinal bars were measured using
electric resistance strain gauges. The gauges were also used to measure the strain of the inverted U-shaped
steel box.
Figure 5. Measurement system of story drift
3. Test results and discussions
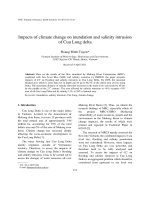
3.1. Visual Observation
Figure 6 shows the crack pattern of specimens SP1 and SP2 after 4% drift. For the specimen SP1, beam
flexural cracking was concentrated to a wide single crack at the interface between the beam and the grout.
Flexural cracks started to occur in column at the drift of 0.25%, inclined cracks occurred in the joint area at a drift
of 0.5% and continue to developed up to the drift of 4%. These inclined cracks might not be induced by joint
shear stress but by the concrete compressive strut. All the cracks occurred in the column and joint were very
small and completely close when the load was removed. Cracks also occurred in the upper part of the beam end
near the column face in the negative direction while there are no cracks occurred in the lower part. This might be
the result from the combination effect of compressive stress and shear stress induced by the concentrated
vertical load. These cracks caused the top part of the beam became “softened”. The concrete at the top part of
the beam near the column face started crushing at the drift of 1.5% and continued when the drift increased. In
the column, very few flexural cracks occurred. However, in the joint area, the inclined cracks distributed from the
position near the top and bottom of the beam to the end of the PC bars. The grout at the bottom of the beam
started to fall down at the drift of 0.75%. The concrete of the beam started to fall down at the drift of 3% at the top
part and increased at higher drift level.
concrete spalled
a) SP1 b) SP2
Figure 6.
Crack pattern of specimens after 4% drift
For the specimen SP2, the crack pattern of the beam was similar to that of the specimen SP1 with cracks
occurred in the upper part of the beam end. However, there were only some small horizontal cracks occurred in
In specimen SP2, no damage was observed on the shear bracket except little deformed at the top where it
contacts with the steel part of the beam. The bracket could resist the beam even at the drift up to 6%. The
inverted U-shaped steel box at the beam end was designed to transfer the shear force from the beam to the
shear bracket on the column. In this steel part, the welding between the top horizontal plate and the vertical
plates started to be damaged and the top horizontal plate was bent up. Shear bracket and the inverted U-shaped
steel box after testing are shown in Figure 7.
Figure 7.
Shear bracket and inverted U-shaped
steel box after testing
3.2. Moment – Rotation Hysteresis Response
The beam moment – rotation angle relationships of specimens SP1 and SP2 are shown in Figure 9a and
Figure 9b, respectively. In these figures, moments are the acting moment at the column face due to the cyclic
and concentrated vertical loads on the beam and determined as:
M=P*l -Q
L
*l’
(6)
w
here:
P
is the cyclic load,
l
is the distance from the beam-end pin to the column face,
Q
L
is the
concentrated vertical load, and
l’
is the distance from the concentrated load to the column face.
The calculation curve was modeled as bilinear behavior, where the moments
M
cr
and
M
y
were determined
from Eq. (1) and (2), and the rotation was determined from the beam stiffness. Initial stiffness of the beam was
calculated as:
l
EI
K
e
3
(7)
Stiffness of the beam after opening was calculated as:
2
2
'
.
d
l
AE
K
pcpc
(8)
w
here:
E
and
I
were the Young modulus and second moment of the beam,
E
pc
and
A
pc
were the Young
modulus and area of the PC, respectively,
l
is the beam length, is the moment lever arm, as shown in Figure 8.
Figure 8.
Determination of d’
Figure 9a indicates stable hysteresis response and small residual drift. Figure 9b also shows good response
except considerable residual drift at high drift level. Calculated strengths are also expressed in these figures.
Both specimens show higher moment strength and stiffness after opening in the positive compared to that of
the negative direction. From the visual observation, it can be seen that the “softening” of the concrete at the
upper part of the beam made the concrete compressive force could not fully developed, hence moment strength
was reduced. From the figures, it can be seen that the calculated moments are smaller in positive direction and
larger in negative direction than the experimental ones.
without bracket
-250
-200
-150
-100
-50
0
50
100
150
200
250
-0.06 -0.04 -0.02 0.00 0.02 0.04
0.06
Rotation (rad)
Moment (kNm)
Experiment
Calculation
with bracket
-100
-50
0
50
100
150
-0.06 -0.04 -0.02 0.00 0.02 0.04
0.06
Rotation (rad)
Moment (kNm)
Experiment
Calculation
a) SP1
b) SP2
Figure 9.
Moment-Rotation Relationship
3.3. Beam Slip and Friction Coefficient
From Figure 10 it can be seen that, from the drift of 0.5%, the slip in specimen SP1 increased rapidly,
although this specimen was designed with the prestressed force that enough to carry the shear force by shear
friction. In Figure 10,
Q
b
is the beam end shear force and
N
is the total PC force. After applying vertical load and
before applying cyclic load,
Q
b
/
N
ratio was 0.418, and up to 3% drift cycle, this ratio was still less than the design
friction coefficient value of 0.5. It seems that the proposed friction coefficient proposed by AIJ is not sufficient in
this case and further studies should be carried out about this.
The specimen SP2 was designed with shear bracket to carry the shear force cause by the concentrated
vertical load.
0
5
10
15
20
25
0
1
2
3
4
5
Story Drift (%)
Slip (mm)
SP1: Without bracket
SP2: With bracket
SP1
0.0
0.1
0.2
0.3
0.4
0.5
0.6
0.7
-5 -4 -3 -2 -1 0 1 2 3 4 5
Story Drift (%)
Q
b
/N
Figure 10.
Slip of the beam
Figure 11.
Variation of beam shear force/PC force ratio
From Figure 11, it can be seen that the bracket worked well and the slip was much smaller than that of
specimen SP1. However, the small slip still happened because of some deformation at the bracket and the
inverted U-shaped steel box.
3.4. PC force – Story Drift Relationship
Figure 12 shows the relationship between the prestressed forces and the story drift. The PC force here is the
average force in the two PC bars. The dashed line illustrates the yield force of the PC bar. At the drift of 3%, the
PC bars have yielded in both positive and negative directions in specimen SP1, while in specimen SP2, the PC
bars started to yield only in negative direction. It can be seen that, the PC bars in the specimen SP1 has yielded
more clearly
than that of the specimen SP2. It can be concluded that, the bracket has postponed the yielding of the PC
bars.
3.5. Strain of the U-shaped steel box
The relationship between strain of the vertical plate of the U-shaped steel box and story drift is shown in
Figure 13. It can be seen that the strain increased as the drift increased. This improves that the U-shaped steel
box has worked well to transfer the beam shear force to the bracket.
0.00
0.05
0.10
0.15
0.20
0 1 2 3 4 5
Story Drift (%)
Strain (%)
T1
T2
Figure 13.
Strain of the U-shaped steel box
4. Conclusions and recommendations
4.1. Conclusions
From the test results, following conclusions can be drawn.
- The shear bracket and the inverted U-shaped steel box at the beam end on the column worked well to
transfer the shear force from the beam to the column although some deformation still occurred within these parts.
- In both specimens, the deformation concentrated on the beam end near the column face with the
elongation of the PC bars and the damage of the beam concrete at the upper part of the beam near the column
face. There was nearly no damage occurred with the column, especially in cases the shear bracket was used.
- The vertical slip of the beam was excessively large in the specimen without shear bracket while it was
significantly reduced in case with shear bracket.
- The moment capacity of the beam is quite different between positive and negative side. From the visual
observation, the “softening” of the upper part of the beam and vertical slip of the beam might be the main reason
of the asymmetry of the moment capacity in positive and negative side.
4.2. Recommendations
From the test results, following recommendations are proposed:
- The spiral steel should be used in the upper part of the beam end near column face to confine the concrete
and avoid compression failure of the concrete.
without bracket
200
250
300
350
400
450
500
550
-6 -4 -2 0 2 4 6
Story Drift (%)
PC force (kN)
SP2: with bracket
50
100
150
200
250
-6 -4 -2 0 2 4 6
Story Drift (mm)
PC force(kN)
a) SP1 b) SP2
Figure 12. PC force – Story drift relationship
Py=417 kN
Py=191kN
- The detail of the inverted U-shaped steel box should be modified to prevent bending deformation of the top
horizontal plate and failure of the welding. Using the thicker plate and change the detail of this plate may help to
prevent this type of damage.
- The bracket should be checked for local concentrated stress at the top to avoid deformation of the bracket.
Acknowledgement
This research was conducted as a part of the project to develope new type of high-rise R/C office building,
organized in Building Contractors Society, led by Prof. Hitoshi Shiohara. The financial support of this research
was received from Ministry of Land, Infrastructure and Transportation.
References
1.
N. Shinsuke
, and
K. Yoshikazu
, “US-Japan Cooperative Research Program (Phase 4): Research Project Activity of
Precast Seismic Structural (PRESSS) from Japan side”,
10th World Conference on Earthquake Engineering, 1992.
2.
M. J. N. Priestley
, “Overview of PRESSS Research Program,” PCI JOURNAL,
Vol. 36, No. 4, July-August 1991, pp.
50-57.
3.
S. Pampanin
,
A. Amaris
, and
A. Palermo
, “Implementaion and Testing of Advanced Solutions for Jointed Ductile
Seismic Resisting Frames,”
Federation International du Beton, Proceeding of the 2
nd
International Congress, June 5-8,
2006, Naples, Italy.
4.
M. J. N. Priestley
, and
J. Tao
, “Seismic Response of Precast Prestressed Concrete Frames with Partially Debonded
Tendons,”
PCI JOURNAL,
Vol. 38, No. 1, January-February 1993, pp. 58-69.
5. Architecture Institute of Japan, “Standard for Structural Design and Construction of Prestressed Concrete Structures”,
1998.
6. Prestressed Concrete Institute, “PCI Design Handbook”,
3
rd
Edition, 1985.
7.
W. C. Stone
,
G. S. Cheok
, and
J. F. Stanton
, “Performance of Hybrid Moment-resisting Precast Beam-Column
Concrete Connections Subjecd to Cyclic loading,”
ACI Structural Journal, V91, No.2, March-April 1995.