Báo cáo nghiên cứu khoa học " REPORT ON INVESTIGATIONS INTO MANGO SUPPLY CHAINS IN THE MEKONG DELTA VIETNAM 2005-2007 " ppt
Bạn đang xem bản rút gọn của tài liệu. Xem và tải ngay bản đầy đủ của tài liệu tại đây (3.82 MB, 114 trang )
REPORT ON INVESTIGATIONS INTO MANGO SUPPLY
CHAINS IN THE MEKONG DELTA VIETNAM 2005-2007
By
Robert Nissen
1
, Tran Thi Ngoc Diep
2
, Nguyen Duy Duc
2
, Nguyen Minh Chau
3
, Nguyen
Trinh Nhat Hang
2
, Tran Nguyen Lien Minh
2
, Tran Thi Kim Oanh
2
, M. Rankin
4
, I. Russel
4
and Peter Hofman
1
1
Queensland Department of Primary Industries and Fisheries (DPI&F) , Maroochy Research Station, PO
Box 5083 SCMC, Queensland, Australia, 4560.
2
Southern Sub-Institute of Agricultural Engineering and Post-Harvest Technology (SIAEP), 54 Tran Khanh
Du Street, District 1, Ho Chi Minh City, Vietnam.
3
Southern Fruit Research Institute (SOFRI), Long Dinh-Chau Thanh, P0 Box 203 My Tho Tien Giang,
Vietnam.
4
University of Queensland, Gatton College, School of Natural and Rural Systems Management, Gatton
Campus, Lawes Queensland, 4343, Australia.
AusAID CARD Project 050/04 VIE Improvement of domestic and export markets through improved post harvest and supply chain management
January 2008 Page
2
© The State of Queensland, Department of Primary Industries and Fisheries 2008.
Copyright protects this work. Except as permitted by the Copyright Act 1968 (Cth), reproduction by any means (photocopying,
electronic, mechanical, recording or otherwise), making available online, electronic transmission or other publication of this
work is prohibited without the prior written permission of The Department of Primary Industries and Fisheries, Queensland.
Inquiries should be addressed to
(phone 61 7 3404 6999), or
Director,
Intellectual Property Commercialisation Unit
Department of Primary Industries and Fisheries
GPO Box 46
Brisbane Queensland 4001
All rights reserved. Reproduction and dissemination of materials in this information product for educational or other non
commercial purposes is authorised without any prior written permission from the copyright holders provided the sources is fully
acknowledged. Reproduction of materials in this information product for resale or other commercial purposes is prohibited
without written permission of the copyright holders.
AusAID CARD Project 050/04 VIE Improvement of domestic and export markets through improved post harvest and supply chain management
January 2008 Page
3
TABLE OF CONTENTS
Background 5
Introduction 5
Methodology 5
Survey of mango consumers in Ho Chi Minh City 7
Introduction 7
Results 7
Demographics of Ho Chi Minh City 7
Survey of Mango Retailers in Ho Chi Minh City (HCMC) 23
Introduction 23
Results 23
Retailers of Ho Chi Minh City. 23
Retailer experience and length of time in the trade. 23
Retailers purchasing patterns and locations 24
Transport of product to retailer’s place of business 24
Retailers’ delivery of product to consumers 25
Transaction types and methods of payment 25
Retailer sales, quantity of mango sold in Ho Chi Minh City 25
The retailer wholesale purchasing price of mango in Ho Chi Minh City 27
The retail sale price for mango in Ho Chi Minh City 30
Factors contributing to fruit loss at the retail level 33
Preservation techniques and post-harvest technologies applied by retailers 36
Difficulties and costs associate with running a retail business in Ho Chi Minh City, Vietnam 37
Labour requirements for retail shops at markets and fruit shops 37
Taxes and fees paid by retailers to operate their business 38
Information flows, exchanges and business fess paid by retailers to associations 38
Survey of Mango Wholesalers and Collectors 39
Ho Chi Minh City Fruit and Vegetable Central Markets 39
Wholesalers experience and length of time in the trade in South Vietnam 39
Transportation practices 40
Wholesaler purchasing practices 42
Wholesaler mango purchasing prices 43
Quantity of mango sold by wholesalers 45
Wholesaler mango selling prices and profit
46
Wholesaler business operational expenses 48
Labour costs 49
Tax and electricity and water fees 49
Wholesalers post-harvest handling techniques and practices 50
Fruit grading practices and quality assurance 54
Artificial ripening of fruit 54
Maturity level of fruit 55
Wholesalers supply chain communication practices 55
Collectors 57
Collectors’ purchasing practices 57
Collectors’ suppliers 57
Transportation 57
Collectors handling and quality assurance practices 58
Fruit grading by collectors 58
Packaging 59
Storage 61
AusAID CARD Project 050/04 VIE Improvement of domestic and export markets through improved post harvest and supply chain management
January 2008 Page
4
Collectors’ sale price for mango 61
Survey of Mango Farmers in the Mekong Delta, Vietnam 63
Pre-Harvest 63
Varieties 63
Production Area 63
Farm sizes 64
Production Periods 65
Orchards and production systems 65
Orchard tree age 66
Canopy Management 66
Yield 67
Yield manipulation 69
Fertilizers and Irrigation 70
Pre-harvest pest and disease control methods 70
Infield diseases that directly affect on fruit 70
Infield pests that directly affect fruit quality 73
Post-harvest 78
Harvesting 78
Maturity indicators 81
Fruit grading AND packing 82
Shelf life 86
Transport 88
Sale of fruit 90
Farm gate prices received for mango fruit 91
Farm fees and taxes 92
Communication and information exchange 95
Farm profit from mango production 98
Environmental sustainability issues in the Mekong Delta 100
Soil Management 101
Irrigation and Water Management Practices 101
Agricultural Chemical Usage 102
Mango Processor:- Costal Fisheries Development Copporation (CONFIDEC) Mango Processing Factory
106
Observations and recommendations for the mango processor 107
Ho Chi Minh City, May 2006 107
Mango ripening 107
Air movement 107
Suggestions 107
Other suggestions 108
Conclusions 109
Consumers 109
Retailers 109
Wholesalers/Collectors 110
Farmers 111
Cooperatives and groups 111
Supply chains 111
References 114
AusAID CARD Project 050/04 VIE Improvement of domestic and export markets through improved post harvest and supply chain management
January 2008 Page
5
BACKGROUND
In the Mekong Delta, Vietnam, about 33 286 hectares of mango are grown, producing about 193 383 metric
tonnes of fruit per year. Currently, over 80% of the mango production is from small individual village farms.
Many farmers harvest immature fruit to reduce damage from fruit fly and poor handling systems along the
supply chain. Many poor farmers do not have direct access to supermarkets due to food safety, quantity
requirements, and delivery conditions. Many open wet markets in Asia lack the necessary hygiene facilities
to meet the growing demand for safe products. Traditional markets and street vendors are the major
participants in the food distribution lines in Vietnam.
Supermarket numbers are increasing due to consumer demands for safe food and the Vietnamese
Government promotion of ideals on safe food. As Vietnamese wages increase and consumers demand a
safe product, the number of supermarkets has increased dramatically in Ho Chi Minh City between 1990
and 2004, at a rate of 17% per year. In Hanoi, supermarket expansion also occurred at a rate of 14% per
year from 2000 to 2004. In 2004, there were 43 supermarkets and nine trade centres in Hanoi. In 2005,
there were 71 supermarkets in Ho Chi Minh City (Moustier, et al 2006). Producers must be highly
adaptable; inflexible producers will not be able to generate added value to the supply chain and will be
forced out of their industry. Producers must adopt new supply chain strategies that will deliver value for
money to their customers and ultimately the end consumer.
INTRODUCTION
This report provides baseline information on investigations undertaken as part of the Collaboration for
Agriculture and Rural Development CARD Project 050/04VIE “Improvement of export and domestic
markets for Vietnamese fruit through improved post-harvest and supply chain management”. This
collaborative project is funded by AusAID and administered by Hassall and Associates International. The
project is between the Queensland Department of Primary Industries and Fisheries (QDPI&F) and the
Vietnamese organisations, Southern Sub-Institute of Agricultural Engineering and Post-Harvest Technology
(SIAEP), and Southern Fruit Research Institute (SOFRI).
The aim of this report is to investigate and understand mango supply chains in Mekong Delta, Vietnam by:
• determining pre- and post-harvest technology practices of these supply chains
• determining the quality of the product produced by these supply chains
• identifying participants in the existing domestic and export supply chains
• map the existing mango supply chains and their and distribution channels
METHODOLOGY
Several methods were used to collect baseline data on mango supply chains operating in the Mekong
Delta of Vietnam. Relevant data and information was collected from the internet and reports produced by
the Ministry of Agriculture and Rural Development (MARD), The Government Statistics Office (GSO) of
Vietnam, and provincial government offices in the Mekong Delta, Vietnam. Further information was
obtained from the internet and published reports and databases of the Food and Agricultural Organisation
(FAO) of the United Nations and World Bank.
Survey sheets and process analyses were developed and tested by Vietnamese project staff. This was
part of the training conducted by the Australian collaborators for the CARD Project 050/04VIE. The supply
chain was segmented into the various supply chain participant groups, consumers, wholesalers, collectors
and farmers. A full investigation was carried out via interviews and surveys with the consumers,
AusAID CARD Project 050/04 VIE Improvement of domestic and export markets through improved post harvest and supply chain management
January 2008 Page
6
wholesalers, collectors and farmers along the mango supply chains operating in the Tien Giang, Vinh Long,
Dong Thap and Ben Tre Provinces and Ho Chi Minh City, Vietnam in July 2005 to May in 2006.
Stratified random sampling and random sampling techniques were used to collect survey data. Interviews
were conducted on a 100 consumers, 560 retailers, including 30 supermarkets, 46 high class shops, 397
retailer markets and 87 push cart and sidewalk shop vendors. Retailers were segmented into four groups,
based on store classification type list. These classifications are:
• Supermarkets are more than 250 m
2
in size and selling both consumer goods and fruit and
vegetable
• High class fruit shops are retailers specalising in selling high quality fruit and vegetable only
• Retail markets are fruit and vegetable retailers selling fruit and vegetable in a general market
(traditional as well as wet markets retailers)
• Push cart, sidewalk shops and travelling street vendors
A stratified random sampling technique was used to select the retail businesses to interview. Numbers of
retailers surveyed for each store classification type are presented in Table 1.
Table 1. Retailer classification and number surveyed in Ho Chi Minh City.
Classification Type Number surveyed
Supermarkets 30
High Class Fruit shops 46
Retail Markets 397
Vendors (push-cart, sidewalk shops) 87
Total 560
Further investigations on mango sales during both the main mango season and off season were
undertaken. A total of 98 retailers were interviewed during the main mango season and a further 100
retailers interviewed during the off season.
A total of 8 wholesalers from the city of Cai Be, Tien Giang Province were interviewed and a further 10
collectors were interviewed in the Vinh Kim and Cai Be Districts. Interviews of 299 wholesalers were
conducted, including the wholesale markets in Ho Chi Minh City, Ton That Thuyet floating markets (which
no longer exist), Cho Lon, Thu Duc as well as wholesale markets in the production areas of Binh Thuan,
Bin Duong, Ben Tre, Tien Giang and Don Thap. A further survey of wholesalers was also carried out in
2006 and an investigation of HCMC Fruit and Vegetable Central Markets was undertaken on the 29
th
of
April 2006.
A total of 64 farmers were interviewed within Cam Son district, with 34 new mango farmers and 30
established mango farmers. In Hoa Hung district, 24 surveys were conducted with established farmers. All
farmers interviewed produce fruit for market in January to March period. A further 100 farmers were
interviewed while they attended mango training courses at the Agricultural Extension Centre. Further
information was obtained via interviews with 3 grower cooperatives/groups in November 2005 and April
2006.
AusAID CARD Project 050/04 VIE Improvement of domestic and export markets through improved post harvest and supply chain management
January 2008 Page
7
SURVEY OF MANGO CONSUMERS IN HO CHI MINH CITY
I
NTRODUCTION
The retail and consumer scene, especially in Ho Chi Minh City, is undergoing a great deal of change that is
beginning to benefit the end consumer. Not only have supermarkets and department stores grown in
number, but many are already modernising their services and products, from better-designed shelves,
promotions, to point-of-sale (POS) terminals to help boost sales and competitiveness. Fast moving
consumer goods (FMCG) have experienced the highest growth rates, growing at a rate of 10% per year for
the past four years (Vietnam Economy, 2007). Vietnam Economy (2007), reported growth rates for 2006
for FMCG are:
• 18% for dairy products (milk)
• 13% for personal care items (shampoo, facial moisture, skin care and beauty products)
• 13% for non-alcoholic beverages (tea, fruit juice, etc)
In contrast, the traditional markets and street vendors are the major sellers of fruit and vegetables in
Vietnam. This is based on quantities sold, area of sales and employment (Moustier, 2006). These markets
and vendors are the main point of sale to poor customers, who rarely purchase from supermarkets
because of high prices and inconvenient locations. In Ho Chi Minh City, 33% of the poor households have
never shopped in supermarkets and only 38.5% shop there regularly. This sharply contrasts with the
figures for non-poor households in Ho Chi Minh City, where only 2% have never shopped in supermarkets
and as many as 81.2% shop there regularly (Vietnam Economy, 2006).
RESULTS
DEMOGRAPHICS OF HO CHI MINH CITY
POPULATION CHANGES
The population of Ho Chi Minh City (HCMC) has been increasing at a rate of 3.5% per annum. Estimates
now place the population to be over 7 million, of which migrants make up about a third. The city occupies
approximately 2,000 square kilometres, but due to the urban development history, the city’s population
density is not allocated equally. The population density in the inner city is over 30,000 persons per square
kilometre, whereas the density in suburban and rural areas of the city is considerably lower. Ho Chi Minh
City consists of 24 urban and rural districts (Figure 1), among which 13 are inner districts; 6 are newly
established urban districts, and 5 are suburban districts (Thanh, 2007). See Table 2 for topology and
characterisations of the districts of Ho Chi Minh City.
AusAID CARD Project 050/04 VIE Improvement of domestic and export markets through improved post harvest and supply chain management
January 2008 Page
8
Figure 1. Administration map of Ho chi Minh City
Table 2. Topology of districts in Ho Chi minh City, Vietnam
Categories
Rapid Urbanisation
Medium
Urbanisation
Slow Urbanisation
Total
Urban
Districts
1, 3, 4, 5, 6, 10, 11, Phu Nhuân 8,
Bình Thanh, Gò Vấp, Tân
Bình,Tân Phu
13
Semi-urban
Districts
7,12, Bình Tân,
Thu Duc
2, 9 6
Rural
districts
Cu Chi, Bình Chánh, Hóc
Môn, Nhà Bè, Cân Gio
5
Total 13 4 7 24
Previous research into urban life claimed that rural poor people (migrants) who leave their villages to seek
a livelihood in the cities fall into the urban poor class, and their prospects do not improve. Despite this, the
rural poor, many of whom have lost their access to land and a livelihood, still view the city as a means to
escape rural poverty. According to the 1999 general census of Ho Chi Minh City, the rate of female
migration to the city is higher than that of men (Ho Chi Minh City Office of Statistics 2000). This was also
higher than the number of female migrants moving to other areas in Vietnam. Nationally, women made up
45% of all migrants within Vietnam, but they accounted for 58% of all migrants moving into Ho Chi Minh
City (Gubry et al. 2002).
AusAID CARD Project 050/04 VIE Improvement of domestic and export markets through improved post harvest and supply chain management
January 2008 Page
9
Table 3. Occupation before and after migration to Ho Chi Minh City
Occupation Before migration At present
Agriculture 49% 0%
Wage Labour 21% 18%
Handicraft production 11% 22%
Student 6% 0%
Employee 1% 2%
Small trading 10% 31%
Petty trading 0% 27%
Housewife 2% 0%
Total 100% 100%
E
ARNING CAPACITY AND INCOME LEVELS OF THE CITIZENS OF HO CHI MINH CITY
Ho Chi Minh City is the largest and fastest developing city and has the highest per capita income in
Vietnam, yet around 12% of its population was classified as poor in 2001. Although this rate is lower than
any other city in Vietnam, the gap between the rich and poor is widest in HCMC. According to several
social surveys, the majority of poor families still struggle to earn money. During the past 5 years in HCMC,
only 25% of people have improved their situation while 50% have been worse off (Leonhardt, 2001).
The Vietnamese Household Living Standards Survey (VHLSS) of 2002 estimated the total annual
expenditure calculated on the basis of Purchasing Power Parity at approximately Int$ 5 510 (approximately
12 738 624 Vietnamese Dong (VND). The total annual expenditure per capita was Int$ 1 345
(approximately 3 109 518 VND) and the total annual food expenditure per capita at Int$ 581 (approximately
115 364 VND) with 11.4% on livestock foods (meat, eggs and milk) and 9.2% on fish and the remainder on
agricultural products (Maltsoglou, 2007).
Poverty affects food security of men and women differently in Vietnam. Women are more vulnerable to
malnutrition because they eat less than men. Especially when pregnant, they need a high level of nutrient
intake (Colwell et al., 2002). In addition, women take an active role in working and looking after the family
and the custom of men eating first may contribute to malnutrition. Information on women and their earning
capacity are presented below to provide a guide to the overall earning capacities of the poor in Ho Chi Minh
City, Vietnam.
Most of the women who migrated to Ho Chi Minh City for work, work in the informal sector and are poor.
60% said that they brought less than 100 000 VND ($US 1=14 000 VND), and more than 90% come to the
city with less than 500 000 VND. Most of the women found work in petty trading or wage work, which
required little to no money. While the capital needed to cover costs was relatively small, the average
monthly amount earned by a female migrant worker from trade related activities was approximately 640
000 VND (Thai Thi Ngoc Du et al 2006). About 45% of these women earned over 600 000 VND a month.
Within the various occupations, women engaging in petty trade earned a higher monthly income, grossing
about 740 000 VND, and women who traded goods in the market place earned over 650 000 VND.
Women undertaking handicraft production averaged over 600 000 VND per month and wage labourers
received the lowest monthly salary of about 480 000 VND (Thai Thi Ngoc Du et al 2006). Some of these
monthly incomes show that many women were not able to earn as much as they needed, as average
monthly expenses for most women was more than 500 000 VND. Food costs came to approximately
345 000 VND, while rent and utilities were about 130 000 VND. Some women earn more than this and
AusAID CARD Project 050/04 VIE Improvement of domestic and export markets through improved post harvest and supply chain management
January 2008 Page
10
spent the remainder on miscellaneous goods. Other women saved some of their earnings and sent it back
to their families in the country areas (Thai Thi Ngoc Du et al 2006).
Ben Thanh ward
(District I), is a high-income area of Ho Chi Minh City, where
many residents are business
persons, officials and workers In contrast, most residents in the
suburban Phu Thuan village (Nha Be
District) are workers and farmers (Thanh, 2007).
HOUSEHOLD CONSUMPTION
Per capita consumption expenditure has grown dramatically in Vietnam since 1993, almost doubling by
2004. Urban areas have experienced faster growth. The richer have done better; most recently, however, it
is the middle groups that have experienced the highest rates of growth. Households have increased their
expenditure on all major categories, but mostly on education, which grew at 12 per cent per annum over
the eleven year period (ADB, 2006). In 1998, expenditure on food consumption was, on average, 47% of
the household budget (MARD, 2001). Rice consumption only varies slightly by income group, but above a
certain income threshold, additional income is spent on high value food such as meat, fat, oil eggs and non
food items (Oxfam 2001).
The Asian Development Bank (ADB) project ‘Making Markets Work Better for The Poor’, categorised
household expenditures into four categories:
• Food
• Education
• Health
• Housing.
Food continues to account for the bulk of household expenditure today, but costs have grown at the lowest
rate (2.19% p.a.). The amount spent on education grew the most over the 11 year period, at nearly 12%
p.a., with the bulk of the increase occurring in 1993-1998. Expenditure on health grew only 4.5% p.a. over
the 11-year period, but rose nearly 17% between 2002 and 2004. Housing expenditure grew nearly 7%
over the whole period. (ADB, 2006). The share of food per capita in household expenditure fell from 62%
of total expenditure in 1993, to 42% in 2004, while that of education increased from 3% to 5%. The share of
housing remained virtually unchanged (around 7 %). The share of health dropped from 7.6% to 5.9%
(ADB, 2006).
Households in rural areas have lower expenditure levels and higher food budget shares compared to urban
areas. As incomes increase, the discrepancies in expenditure levels between urban and rural households
increases, while the food budget shares reduce. Urban households spend more on livestock products and
consume 1.5 times the amount consumed by rural households. In the case of livestock products, both in
rural and urban areas, the expenditure levels, the consumption levels per capita and the food budget share
increase as income increases. The pattern is slightly different in the case of fish. In urban areas across
different income levels, expenditure levels increase, shares reduce and quantities per capita is slightly
reduce. In rural areas, expenditure levels, food expenditure shares and quantities consumed increase as
income increases (Maltsoglou, 2007).
S
HOPPING BEHAVIOUR
Consumers in Ho Chi Minh City who do not buy food and household items in supermarkets, cite prices,
time and distance as their main reasons for not shopping there. According to the study, poor consumers
generally have a positive opinion of their primary food outlets (which generally consist of formal markets,
informal markets such as street vendors and shops). In particular, poor consumers have specific and
opposing perceptions of supermarkets and street vendors: the former offer good quality but also require
AusAID CARD Project 050/04 VIE Improvement of domestic and export markets through improved post harvest and supply chain management
January 2008 Page
11
high prices and time commitments, whereas the latter offer lower quality for cheaper prices and are more
convenient in terms of time
(Vietnam Economy, 2006).
F
OOD OUTLETS
With increasing living standards over the last ten years, consumers have become more fastidious in
choosing fruits. To service these consumers, fruit shops and supermarkets have opened to meet
consumer demands. Supermarkets numbers have increased dramatically in Ho Chi Minh City. In 1990
there were no supermarkets in Ho Chi Minh City. Since then, supermarkets numbers have grown at a rate
of 17% per year and in 2005, there were 71 supermarkets in Ho Chi Minh City. This increase in
supermarkets is due to consumers’ demands for improved quality and food safety. Supermarkets and
market stalls or shops are promoting their goods through improved presentation, packaging and product
safety (Moustier et al, 2006). There are currently around 250 supermarkets throughout the 18 districts of
Ho Chi Minh City. With large amounts of investment, a wide variety of household goods and large scale
promotions, they have become strong rivals to smaller retailers. All are chasing the growing consumption
power developing in Ho Chi Minh City’s new urban districts and suburbs (Vietnam Economy, 2007).
C
ONSUMER PREFERENCES FOR MANGO VARIETIES
The mango variety ‘Cat Hoa Loc’ was the most popular variety for the interviewees, with 71.43% of the
consumers surveyed preferring to purchase and eat this variety due to its attractive color, flavor and
perceived market prestige (Figure 2). The prestige aspect came about 10 years ago when ‘Cat Ho Loc’ was
still rare and very expensive.
Vietnamese consumers, consumption
rates of mango varieties
Percentage (%) of the total consumer surveyed
0 20406080
Mango varieties
Cat Hoa Loc
Cat Chu
Ghep
Others (Thailand, Australia etc.)
Figure 2. Percentage (%) of the total Vietnamese consumers surveyed and purchasing patters of
mango varieties for Ho Chi Minh City, Vietnam
AusAID CARD Project 050/04 VIE Improvement of domestic and export markets through improved post harvest and supply chain management
January 2008 Page
12
During the main production season, the price paid for ‘Cat Hoa Loc’ was reasonable and not too expensive
for all income levels living in Ho Chi Minh City. This pricing level, offers low income workers the ability to
purchase and consume this particular mango variety. Vietnamese consumers in Ho Chi Minh City
purchase mango fruit for eating, gifts and for worship. Times of worship usually occur on the 1
st
and 15
th
day of the lunar month. Mango fruit sold in Ho Chi Minh City that originates from Thailand and Australia
(variety R2E2) occupy only a small proportion of the market. This is because it cannot compete, quality-
wise, with the local mango varieties ‘Cat Hoa Loc’ and ‘Cat Chu’. Most Vietnamese consumers are fiercely
loyal to their local product and they will only purchase products from other countries when there is no local
product available. Vietnamese consumers will purchase foreign fruit as gifts to signal a sign of great
respect, wealth and prestige.
C
ONSUMERS’ FREQUENCY OF PURCHASE, QUANTITY OF PURCHASES AND PLACE OF PURCHASE
This survey found that about 76% of consumers purchase from one to three kg of fruit four to eight times
per month (Figures 3 and 4). Therefore based on the data obtained in this survey, the average consumer
in one year would purchase approximately 144 kg of mango. Most consumers surveyed purchased from
the retail markets (Figure 5) due to perceived conveniences offered such as:
• markets are easily accessible
• ability to select individual fruit for purchase
• familiarity or relationships that have been develop with retailers of mango.
Quantity (kg) per purchase
<1 kg 1-3 kg >3 kg
Percentage (%) of the total
number surveyed
0
20
40
60
80
Figure 3. Quantity (kg) of mango purchased at one time by consumers in Ho Chi Minh City, Vietnam.
AusAID CARD Project 050/04 VIE Improvement of domestic and export markets through improved post harvest and supply chain management
January 2008 Page
13
Frequency of purchases per month
< 4 4 to 8 > 8
Percentage (%0 of the
total number surveyed
0
10
20
30
40
50
60
Figure 4. Monthly mango purchasing frequency for consumers in Ho Chi Minh City, Vietnam.
Consumers preferences
for place of purchase
Percentage (%) of the total
number surveyed
0 10203040506070
Consumers place or location of purchase
Wholesale markets
Retail markets
Fruit shops
Supermarkets
Vendors
Combination of the places
Figure 5. Preferred place of purchase of mango for consumers in Ho Chi Minh City, Vietnam.
AusAID CARD Project 050/04 VIE Improvement of domestic and export markets through improved post harvest and supply chain management
January 2008 Page
14
C
ONSIDERATIONS USED BY CONSUMERS WHEN PURCHASING MANGOES
About 60.9% of consumers surveyed considered; ‘where did the mango they are about to purchase come
from?’ (origin of production). The remaining 39.1% of survey respondents did not consider origin of
production. About 69.5% of survey respondents purchased mangoes for prestige, with 22% purchasing
due to habit and the remaining 8.5% through marketing (Figure 6).
Purchasing habits
Percentage (%) of the total
number of consumers surveyed
0 20406080100
Reasons for purchasing mangoes
Prestige
Habit
Marketing
Figure 6 Consumers’ reasons for purchasing mangoes in Ho Chi Minh City, Vietnam.
P
RICE PAID BY MANGO CONSUMERS IN HO CHI MINH CITY
When asked to compare mango prices against their income, 70% of interviewees indicated that the
purchase price was reasonable, including respondents from the poorer social classes in Vietnamese
society. About 30% said the purchase prices were too high in comparison to their income, even during the
main season, but especially at the beginning of the main season, when many consumers purchase
mangoes to give as gifts. Less than one percent said the prices were too low and they mainly purchased
fruit from high class shops (Figure 7).
AusAID CARD Project 050/04 VIE Improvement of domestic and export markets through improved post harvest and supply chain management
January 2008 Page
15
Consumer ratings
of mango prices
Percentage (%) of the total
number of consumers surveyed
0 20406080
Consumer ratings of mango prices
in comparsion to their wages
High
Average
Low
Figure 7. Consumers’ opinions of the cost of mangoes in relation to their income in Ho Chi Minh City,
Vietnam.
T
HE PURCHASE PRICE FOR MANGO IN HO CHI MINH CITY, VIETNAM
The mango variety ‘Cat Hoa Loc’, in the market place in Ho Chi Minh City Vietnam receives on average a
50% higher price than the variety ‘Cat Chu’, and a 66% higher price than the mango variety ‘Ghep’.
The average retail price per kg for the mango varieties ‘Cat Hoa Loc’, ‘Cat Chu’ and ‘Ghep’ did not fluctuate
widely over the seasons from 2005 to 2006. The average retail price for mango variety ‘Cat Hoa Loc’, early
and late main season and early and middle off season was between 15 000 and 20 000 VND per kg.
During the middle main season, the average retail price fell below 15 000 VND per kg and for the late off
season, the average retail price increased to about 20 000 to 25 000 VND per kg (Figure 8). The average
retail price for the mango variety ‘Cat Chu’ for early and late main season and early and middle off season
was between 14 000 and 18 000 VND per kg. During the middle main season, the average retail price fell
below 15 000 VND per kg, and for late off season, the average retail price increased to about 20 000 to
25 000 VND per kg (Figure 9). The average retail price for the mango variety ‘Ghep’, was between 6 000
and 8 000 VND per kg for all seasons (Figure 10).
AusAID CARD Project 050/04 VIE Improvement of domestic and export markets through improved post harvest and supply chain management
January 2008 Page
16
Early Off Season
Percentage (%) of the total
consumers surveyed
0
10
20
30
40
50
60
Mid Off Season
Percentage (%) of the total
consumers surveyed
0
10
20
30
40
50
60
Late Off Season
Thousands ('000) of VND / kg
<15 15-20 20-25 25-30 >30
Percentage (%) of the total
consumers surveyed
0
10
20
30
40
50
60
Early Main Season
Percentage (%) of the total
consumers surveyed
0
10
20
30
40
50
60
Mid Main Season
Percentage (%) of the total
consumers surveyed
0
10
20
30
40
50
60
Late Main Season
Thousands ('000) VND / kg
<15 15-20 20-25 25-30 >30
Percentage (%) of the total
consumers surveyed
0
10
20
30
40
50
60
Figure 8. Purchase price of mango variety ‘Cat Hoa Loc’ during the main and off seasons in Ho Chi
Minh City, Vietnam.
AusAID CARD Project 050/04 VIE Improvement of domestic and export markets through improved post harvest and supply chain management
January 2008 Page
17
Early Main Season
Percentage (%) of the total
consumers surveyed
0
10
20
30
40
50
60
Early Off Season
Percentage (%) of the total
consumers surveyed
0
10
20
30
40
50
60
Middle Main Season
Percentage (%) of the total
consumers surveyed
0
10
20
30
40
50
60
MIddle Off Season
Percentage (%) of the total
consumers surveyed
0
10
20
30
40
50
60
Late Main Season
Thousands ('000) of VND / kg
<6 6 - 10 10 - 14 14 - 18 >18
Percentage (%) of the total
consumers surveyed
0
10
20
30
40
50
60
Late Off Season
Thousands ('000) of VND / kg
<6 6 - 10 10 - 14 14 - 18 >18
Percentage (%) of the total
consumers surveyed
0
10
20
30
40
50
60
Figure 9. Purchase price of mango variety ‘Cat Chu’ during the main and off seasons in Ho Chi Minh
City, Vietnam.
AusAID CARD Project 050/04 VIE Improvement of domestic and export markets through improved post harvest and supply chain management
January 2008 Page
18
Early Main Season
Percentage (%) of the total
consumers surveyed
0
20
40
60
80
100
Early Off Season
Percentage (%) of the total
consumers surveyed
0
20
40
60
80
100
Middle Main Season
Percentage (%) of the total
consumers surveyed
0
20
40
60
80
100
Middle Off Season
Percentage (%) of the total
consumers surveyed
0
20
40
60
80
100
Late Main Season
Thousands ('000) of VND / kg
<4 4 - 6 6 - 4 8 - 10 >10
Percentage (%) of the total
consumers surveyed
0
20
40
60
80
100
Late Off Season
Thousands ('000) of VND / kg
<4 4 - 6 6 - 4 8 - 10 >10
Percentage (%) of the total
consumers surveyed
0
20
40
60
80
100
Figure 10. Purchase price of mango variety ‘Ghep’ during the main and off seasons in Ho Chi Minh City,
Vietnam.
AusAID CARD Project 050/04 VIE Improvement of domestic and export markets through improved post harvest and supply chain management
January 2008 Page
19
C
OMMON PROBLEMS THE CONSUMERS FACE WHEN PURCHASING MANGO
About 51.7% of consumers surveyed indicated they had problems when selecting mangoes to purchase
due to uneven ripening (Figure 11). Based on Australian varieties, mangoes are best ripened at about
20°C. This provides the best balance between good skin colour and flavour, whilst minimizing disease on
the fruit. In relation to processing where skin colour is not an issue, we recommend ripening at about 24-
25°C.
We know little about ripening conditions for Vietnamese varieties, but it is possible that higher ripening
temperatures can be used. Uncontrolled temperatures of 26-35°C and inadequate air circulation and
temperature control during the ripening process can have serious consequences in for mango fruit,
causing:
• uneven colouring occurring (green patches with a yellow background on skin of the
mango)
• uneven ripening of the flesh, and
• the possibility of increasing disease presence, such as stem end rots and anthracnose
Generally, temperatures above 32-35°C can prevent ripening. Therefore, temperature control during the
ripening process is critical.
Purchasing problems
Percentage (%) of the total
number of consumers surveyed
0 20 40 60 80 100
Consumers problems
when purchasing mangoes
Too much disease
Non uniform size
Overripe
Non uniform ripening
Figure 11. Problems encountered by consumers when choosing mangoes to purchase.
C
ONSUMERS’ PREFERENCES FOR PURCHASING AND SELECTING MANGOES BASED ON THEIR QUALITY
About 37% of consumers surveyed chose mangoes to purchase based on their colour, with overall fruit
appearance ranking second at 21%, followed by size 20% and then flavour/smell 19.5%. Vietnamese
consumers shop every day and therefore shelf life is not considered a major factor by consumers when
making the initial purchase of mangoes (Figure 12).
AusAID CARD Project 050/04 VIE Improvement of domestic and export markets through improved post harvest and supply chain management
January 2008 Page
20
Consumers preference
for selecting mangoes
Percentage (%) of the total
number of consumers surveyed
0 10203040
Criteria consumers used
to select mangoes
Colour
Appearance
Flavour (smell)
Size
Shelf life
Figure 12. Consumers’ preferences for selecting mangoes to purchase in Ho Chi Minh City, Vietnam.
C
ONSUMER REQUIREMENTS ON THE QUALITY OF MANGOES
The mango variety ‘Cat Hoa Loc’ was the most popular variety of mango. Many consumers, when
questioned about their preference for quality requirements of mangoes, indicated that quality should be
improved in terns of being sweeter, have a smaller seed, have more fragrance and have a longer shelf life.
About 85% of consumers surveyed indicated that fruit size was suitable, 60% indicated that colour was
suitable with 24.8% indicating it should be yellower and 14.4% indicating that there is too much sap on the
skin and in the fruit. About 71% of consumers surveyed indicated that flesh was suitable, 14% indicating
that the seed was too large. About 63% indicated that the flavour was suitable, but 18% indicating that the
fruit was not sweet enough and a further 18% indicating that the smell could be improved. About 71%
indicated that shelf life was suitable with 18.8% indicating that the fruit rotted too quickly and 13% saying
that the skin shriveled/withered quickly
(Figure 13).
AusAID CARD Project 050/04 VIE Improvement of domestic and export markets through improved post harvest and supply chain management
January 2008 Page
21
Fruit colour
Problems with fruit colour
Suitable
Should be yellower
Less sap in the fruit
Fruit flesh
Problems with flesh
Suitable
Too much fiber
Too much water
Large seed
Fruit size
Problems with frut size
Suitable
Too large
Too small
Fruit flavour
Problems with flavour
Suitable
Not sweet enough
Do not smell good
Shelf life
Percentage (%) of the total number
of consumers surveyed
0 20406080
Problems with shelf life
Suitable
Rot to quickly
Skin withered quickly
Figure 13. Consumer ratings of mango fruit quality.
AusAID CARD Project 050/04 VIE Improvement of domestic and export markets through improved post harvest and supply chain management
January 2008 Page
22
C
ONSUMER SUGGESTIONS TO IMPROVE MANGO MARKETING
About 60% of consumers surveyed indicated that mango fruit quality is the single most important marketing
factor that could be improved to increase mango sales. The next factor indicated by consumers was the
distribution system at 16%, closely followed by packaging (12%) and the remaining 12% had no
suggestions on how to improve the marketing and sales of mangoes in Ho Chi Minh City, Vietnam (Figure
14).
Consumer suggestions for
improvements in the marketing mangoes
Percentage (%) of the total
number of consumers surveyed
0 20 40 60 80 100
Consumer suggestions
The quality
The package
Distribution system
Other (No idea)
Figure 14. Aspects of mango marketing and sales that consumers believe should be improved upon.
AusAID CARD Project 050/04 VIE Improvement of domestic and export markets through improved post harvest and supply chain management
January 2008 Page
23
SURVEY OF MANGO RETAILERS IN HO CHI MINH CITY (HCMC)
I
NTRODUCTION
Supermarkets and department stores grown in number in HCMC, many are already modernising their
services and products, from better-designed shelves, promotions, to point-of-sale (POS) terminals to help
boost sales and competitiveness. Supermarkets are also responding to consumers’ demands for improved
quality and food safety for fruit and vegetable products.
Between 1990 and 2004 In Ho Chi Minh City, the number of supermarkets has increased at 17% per year.
In 2005 there were 71 supermarkets in Ho Chi Minh City. This demand has seen the rise of supermarkets
and market stall or shops that promote their goods via improved presentation, packaging and product
safety (Moustier et al, 2006).
RESULTS
RETAILERS OF HO CHI MINH CITY.
We found that in Southern Vietnam, there are three main mango varieties sold by retailers and vendors -
‘Cat Hoa Loc’, ‘Cat Chu’ and ‘Ghep’. Many vendors also sell green mangoes. These are sold intensively
near factories, schools, and hospitals. Mango sellers reported that ‘Cat Hoa Loc’ was the most profitable
mango to sell due to its marketability. Consumers regard this mango a having prestige and it is highly
sought after. ‘Cat Hoa Loc’ mango was mainly sold by retailers with high quality fruit shops not associated
with retail markets, and high quality fruit shops located in retail markets and supermarkets. Retailer ratings
on the most profitable mango cultivars are shown in Table 4 below.
Table 4. The most profitable mango varieties to market in Ho Chi Minh City as chosen by
retailers.
I. Mango Varieties Supermarkets Fruit shops Retail markets Vendors
1. ‘Cat Hoa Loc’ X X X
2. ‘Cat Chu’ X
3. ‘Ghep’ X X
RETAILER EXPERIENCE AND LENGTH OF TIME IN THE TRADE.
All surveyed retailers in Ho Chi Minh reported that consumers are becoming more fastidious in choosing
fruit. This change can be attributed to the increase in living standards over the past ten years. All street
vendors surveyed see their particular line of business as a temporary job. Most vendors have been in this
line of business for only two to three years compared to market retailers, fruit shops and supermarkets,
which have been in their line of business for 5 years or longer (Table 5).
Table 5. Proportion of retailers and time spent in the trade.
Classification Trade time (years) Percentage (%)
vendors/the fruits shops < 5 years 23.5
supermarkets, retail markets and fruit shops 5 - 15 years 50.6
retail markets 15 - 30 years 8.23
retail markets > 30 years 17.67
AusAID CARD Project 050/04 VIE Improvement of domestic and export markets through improved post harvest and supply chain management
January 2008 Page
24
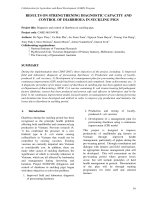
RETAILERS PURCHASING PATTERNS AND LOCATIONS
About 93% of retailers surveyed purchase their fruit from the Ho Chi Minh City wholesale markets. Most
high class fruit shops, supermarkets and senior retailers at the retail markets purchase fruit directly from
collectors or growers in the various provinces in the Mekong Delta or other regions in Vietnam. When
questioned about difficulties experienced in obtaining fruit, retailers indicated that:
• 45% indicted that wholesalers did not follow the verbal agreement in term of the price, the
quantity and product quality
• 15% indicated that fruit size was not uniform as agreed
When the old wholesale markets were moved from Cau Muoi Market, District 1, Ho Chi Minh City to Thu
Duc Markets, 15 km from the city centre, some retailers had to break long standing relationships with Cau
Muoi Market wholesalers and develop new relationships with new wholesalers at Thu Duc Markets and
obtain mango fruit from Pham Van Thuong (District 5) or Ton That Thuyet (District 4). In 2006, the Ton
That Thuyet floating markets on the Kinh Te River closed and moved to Binh Dien Markets wholesale
markets in Binh Chanh District, or other floating markets in District 5 and District 6 in Ho Chi Minh City.
TRANSPORT OF PRODUCT TO RETAILER’S PLACE OF BUSINESS
With the Thu Duc Markets being 15 km from the city centre, 10% of retailers highlighted difficulties and
problems with distance from wholesale markets to their place of business (Figure 15). Time taken to go to
the markets and transportation of fruit from the markets back to their business establishments was longer
and transportation fees were considerably higher compared to conducting business at the old wholesale
markets. About 25% of retailers, mainly the vendors, complained about their transportation means (Figure
15).
45%
15%
10%
25%
5%
Break the agreement in terms of the price, the quality and the quantity
Not uniform in size
The distance
The transportation
No idea
Figure 15. Occurrence of problems faced by retailers when purchasing fruit.
Practically all fruit purchased by the retailers are transported from the wholesale market place to the
retailer’s place of business by Honda tricycles with or with out an engine. In some instances, small vans
are used to deliver mangoes in cartons or boxes. Street vendors use push carts or bicycles to transport
their fruit. Where tricycles are used, transportation fees are calculated according to the trip distance.
Where vans are used to transport fruit in boxes, costs are calculated on a box basis and trip distance.
AusAID CARD Project 050/04 VIE Improvement of domestic and export markets through improved post harvest and supply chain management
January 2008 Page
25
When purchasing mangoes, the retailer does not negotiate the transportation fee back to their place of
business. They do not pay for each delivery, instead transportation fees are usually negotiated between
the retailers and wholesalers, based on the annual quantity of fruit sales. Retailer survey results on costs
are shown in Table 6.
Table 6. Percentage of the total retailers surveyed and transportation fees paid per annum.
Transportation fees in VND per year Percentage (%) of the total number of retailers
surveyed
< 500 000 VND per year 50%
500 000 to 1 000 000 VND per year 40%
1 000 000 to 2 000 000 VND per year 10%
RETAILERS’ DELIVERY OF PRODUCT TO CONSUMERS
Vendors use bicycle or bamboo shoulder carry baskets to peddle and move their fruit along the paths of Ho
Chi Minh City. All retailers sell mango directly to customers who visit or frequent their establishments. Fruit
sold by retailers are placed in plastic bags or wrapped in paper. The customer is responsible for
transporting his or her purchase back to their households. Specialty fruit shops deliver mango sales to
restaurants and hotels if the quantity sold exceeds 5-10 kg per delivery.
TRANSACTION TYPES AND METHODS OF PAYMENT
All contracts between retailers and wholesalers are verbal in terms of type of fruit purchased, price per
kilogram or per fruit, and quality. When retailers receive the goods, 85% of the total payment cost is
handed over to the wholesaler, the remaining 15% is to be paid by a set time period agreed to by the
wholesaler and retailer.
RETAILER SALES, QUANTITY OF MANGO SOLD IN HO CHI MINH CITY
All retailers surveyed reported that they only sell to fruit to consumers in the Ho Chi Minh City area. No fruit
are on sold to other retailers or vendors in other areas or regions of Vietnam. During the main mango
season, 40% of mango retailers sell 1 000 – 2 000 kg per year, 29.5% sell 2 000 – 3 000 kg per year,
22.5% sell 500 – 1 000 kg per year, and the remaining 8% of retailers sell less than 500 kg of mango per
year (Figure 16).