SAT II Physics (SN) Episode 1 Part 2 ppsx
Bạn đang xem bản rút gọn của tài liệu. Xem và tải ngay bản đầy đủ của tài liệu tại đây (1.16 MB, 25 trang )
The vector
is called the “x-component” of A and the
is called the “y-component” of A. In
this book, we will use subscripts to denote vector components. For example, the x-component of A
is
and the y-component of vector A is
.
The direction of a vector can be expressed in terms of the angle
counterclockwise from the x-axis.
by which it is rotated
Vector Decomposition
The process of finding a vector’s components is known as “resolving,” “decomposing,” or
“breaking down” a vector. Let’s take the example, illustrated above, of a vector, A, with a
magnitude of A and a direction
above the x-axis. Because
,
, and A form a right triangle,
we can use trigonometry to solve this problem. Applying the trigonometric definitions of cosine
and sine,
we find:
Vector Addition Using Components
Vector decomposition is particularly useful when you’re called upon to add two vectors that are
26
neither parallel nor perpendicular. In such a case, you will want to resolve one vector into
components that run parallel and perpendicular to the other vector.
EXAMPLE
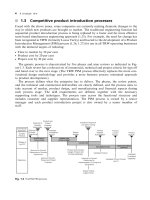
Two ropes are tied to a box on a frictionless surface. One rope pulls due east with a force of 2.0N. The
second rope pulls with a force of 4.0N at an angle 30º west of north, as shown in the diagram. What
is the total force acting on the box?
To solve this problem, we need to resolve the force on the second rope into its northward and
westward components.
Because the force is directed 30º west of north, its northward component is
and its westward component is
Since the eastward component is also 2.0N, the eastward and westward components cancel one
another out. The resultant force is directed due north, with a force of approximately 3.4N.
You can justify this answer by using the parallelogram method. If you fill out the half-completed
parallelogram formed by the two vectors in the diagram above, you will find that the opposite
corner of the parallelogram is directly above the corner made by the tails of those two vectors.
27
Vector Multiplication
There are two forms of vector multiplication: one results in a scalar, and one results in a vector.
Dot Product
The dot product, also called the scalar product, takes two vectors, “multiplies” them together, and
produces a scalar. The smaller the angle between the two vectors, the greater their dot product will
be. A common example of the dot product in action is the formula for work, which you will
encounter in Chapter 4. Work is a scalar quantity, but it is measured by the magnitude of force and
displacement, both vector quantities, and the degree to which the force and displacement are
parallel to one another.
The dot product of any two vectors, A and B, is expressed by the equation:
where
is the angle made by A and B when they are placed tail to tail.
The dot product of A and B is the value you would get by multiplying the magnitude of A by the
magnitude of the component of B that runs parallel to A. Looking at the figure above, you can get
A · B by multiplying the magnitude of A by the magnitude of
, which equals
would get the same result if you multiplied the magnitude of B by the magnitude of
. You
, which
equals
.
Note that the dot product of two identical vectors is their magnitude squared, and that the dot
product of two perpendicular vectors is zero.
EXAMPLE
28
Suppose the hands on a clock are vectors, where the hour hand has a length of 2 and the minute hand
has a length of 4. What is the dot product of these two vectors when the clock reads 2 o’clock?
The angle between the hour hand and the minute hand at 2 o’clock is 60º. With this information,
we can simply plug the numbers we have into the formula for the dot product:
The Cross Product
The cross product, also called the vector product, “multiplies” two vectors together to produce a
third vector, which is perpendicular to both of the original vectors. The closer the angle between
the two vectors is to the perpendicular, the greater the cross product will be. We encounter the
cross product a great deal in our discussions of magnetic fields. Magnetic force acts perpendicular
both to the magnetic field that produces the force, and to the charged particles experiencing the
force.
The cross product can be a bit tricky, because you have to think in three dimensions. The cross
product of two vectors, A and B, is defined by the equation:
where
is a unit vector perpendicular to both A and B. The magnitude of the cross product vector
is equal to the area made by a parallelogram of A and B. In other words, the greater the area of the
parallelogram, the longer the cross product vector.
The Right-Hand Rule
You may have noticed an ambiguity here. The two vectors A and B always lie on a common plane
and there are two directions perpendicular to this plane: “up” and “down.”
There is no real reason why we should choose the “up” or the “down” direction as the right one,
but it’s important that we remain consistent. To that end, everybody follows the convention known
as the right-hand rule. In order to find the cross product,
: Place the two vectors so their
tails are at the same point. Align your right hand along the first vector, A, such that the base of
your palm is at the tail of the vector, and your fingertips are pointing toward the tip. Then curl
29
your fingers via the small angle toward the second vector, B. If B is in a clockwise direction from
A, you’ll find you have to flip your hand over to make this work. The direction in which your
thumb is pointing is the direction of , and the direction of
.
Note that you curl your fingers from A to B because the cross product is
. If it were written
, you would have to curl your fingers from B to A, and your thumb would point downward.
The order in which you write the two terms of a cross product matters a great deal.
If you are right-handed, be careful! While you are working hard on SAT II Physics, you may be
tempted to use your left hand instead of your right hand to calculate a cross product. Don’t do this.
EXAMPLE
Suppose once again that the minute hand of a clock is a vector of magnitude 4 and the hour hand is a
vector of magnitude 2. If, at 5 o’clock, one were to take the cross product of the minute hand
hour hand, what would the resultant vector be?
the
First of all, let’s calculate the magnitude of the cross product vector. The angle between the hour
hand and the minute hand is 150º:
Using the right-hand rule, you’ll find that, by curling the fingers of your right hand from 12
o’clock toward 5 o’clock, your thumb points in toward the clock. So the resultant vector has a
magnitude of 4 and points into the clock.
Key Formulas
Dot Product
Cross Product
Magnitude
Direction
X-, YComponents
30
Vector
Addition
Practice Questions
1. . Which of the following vectors best represents the vector A + B?
(A)
(B)
(C)
(D)
(E)
2. . Vector A has a magnitude of 5 in the leftward direction and B has a magnitude of 2 in the
rightward direction. What is the value of 2A – B?
(A) 12 in the leftward direction
(B) 10 in the leftward direction
(C) 8 in the leftward direction
(D) 8 in the rightward direction
(E) 12 in the rightward direction
31
3. . When the tail of vector A is set at the origin of the xy-axis, the tip of A reaches (3,6). When the tail
of vector B is set at the origin of the xy-axis, the tip of B reaches (–1,5). If the tail of vector A – B
were set at the origin of the xy-axis, what point would its tip touch?
(A) (2,11)
(B) (2,1)
(C) (–2,7)
(D) (4,1)
(E) (4,11)
4. .
A and B are vectors, and is the angle between them. What can you do to maximize A · B?
I.
Maximize
the
magnitude
of
II.
Maximize
the
magnitude
of
A
B
III. Set to 90º
(A) None of the above
(B) I only
(C) III only
(D) I and II only
(E) I, II, and III
5. .
Which of the following statements is NOT true about
?
(A) It is a vector that points into the page
(B) It has a magnitude that is less than or equal to 12
(C) It has no component in the plane of the page
(D) The angle it makes with B is less than the angle it makes with A
(E)
A
It is the same as –B
Explanations
1.
A
By adding A to B using the tip-to-tail method, we can see that (A) is the correct answer.
32
2.
A
The vector 2A has a magnitude of 10 in the leftward direction. Subtracting B, a vector of magnitude 2 in the
rightward direction, is the same as adding a vector of magnitude 2 in the leftward direction. The resultant
vector, then, has a magnitude of 10 + 2 =12 in the leftward direction.
3.
D
To subtract one vector from another, we can subtract each component individually. Subtracting the xcomponents of the two vectors, we get 3 –( –1) = 4, and subtracting the y-components of the two vectors,
we get 6 – 5 = 1. The resultant vector therefore has an x-component of 4 and a y-component of 1, so that if
its tail is at the origin of the xy-axis, its tip would be at (4,1).
4.
D
The dot product of A and B is given by the formula A · B = AB cos
increases. However, cos
= 0 when
maximize A · B one should set
5.
. This increases as either A or B
= 90°, so this is not a way to maximize the dot product. Rather, to
to 0º so cos
= 1.
D
Let’s take a look at each answer choice in turn. Using the right-hand rule, we find that
vector that points into the page. We know that the magnitude of
between the two vectors. Since AB = 12, and since sin
greater than 12. As a cross product vector,
is
, we know that
, where
is indeed a
is the angle
cannot possibly be
is perpendicular to both A and B. This means that it has
no component in the plane of the page. It also means that both A and B are at right angles with the cross
product vector, so neither angle is greater than or less than the other. Last,
magnitude as
identical to
, but it points in the opposite direction. By negating
is a vector of the same
, we get a vector that is
.
Kinematics
KINEMATICS DERIVES ITS NAME FROM the Greek word for “motion,” kinema. Before we
can make any headway in physics, we have to be able to describe how bodies move. Kinematics
provides us with the language and the mathematical tools to describe motion, whether the motion
of a charging pachyderm or a charged particle. As such, it provides a foundation that will help us
33
in all areas of physics. Kinematics is most intimately connected with dynamics: while kinematics
describes motion, dynamics explains the causes for this motion.
Displacement
Displacement is a vector quantity, commonly denoted by the vector s, that reflects an object’s
change in spatial position. The displacement of an object that moves from point A to point B is a
vector whose tail is at A and whose tip is at B. Displacement deals only with the separation
between points A and B, and not with the path the object followed between points A and B. By
contrast, the distance that the object travels is equal to the length of path AB.
Students often mistake displacement for distance, and SAT II Physics may well call for you to
distinguish between the two. A question favored by test makers everywhere is to ask the
displacement of an athlete who has run a lap on a 400-meter track. The answer, of course, is zero:
after running a lap, the athlete is back where he or she started. The distance traveled by the athlete,
and not the displacement, is 400 meters.
EXAMPLE
Alan and Eva are walking through a beautiful garden. Because Eva is very worried about the upcoming
SAT II Physics Test, she takes no time to smell the flowers and instead walks on a straight path from
the west garden gate to the east gate, a distance of 100 meters. Alan, unconcerned about the test,
meanders off the straight path to smell all the flowers in sight. When Alan and Eva meet at the east
gate, who has walked a greater distance? What are their displacements?
Since Eva took the direct path between the west and east garden gates and Alan took an indirect
34
path, Alan has traveled a much greater distance than Eva. Yet, as we have discussed, displacement
is a vector quantity that measures the distance separating the starting point from the ending point:
the path taken between the two points is irrelevant. So Alan and Eva both have the same
displacement: 100 meters east of the west gate. Note that, because displacement is a vector
quantity, it is not enough to say that the displacement is 100 meters: you must also state the
direction of that displacement. The distance that Eva has traveled is exactly equal to the magnitude
of her displacement: 100 meters.
After reaching the east gate, Eva and Alan notice that the gate is locked, so they must turn around
and exit the garden through the west gate. On the return trip, Alan again wanders off to smell the
flowers, and Eva travels the path directly between the gates. At the center of the garden, Eva stops to
throw a penny into a fountain. At this point, what is her displacement from her starting point at the
west gate?
Eva is now 50 meters from the west gate, so her displacement is 50 meters, even though she has
traveled a total distance of 150 meters.
When Alan and Eva reconvene at the west gate, their displacements are both zero, as they both
began and ended their garden journey at the west gate. The moral of the story? Always take time
to smell the flowers!
Speed, Velocity, and Acceleration
Along with displacement, velocity and acceleration round out the holy trinity of kinematics. As
you’ll see, all three are closely related to one another, and together they offer a pretty complete
understanding of motion. Speed, like distance, is a scalar quantity that won’t come up too often on
SAT II Physics, but it might trip you up if you don’t know how to distinguish it from velocity.
Speed and Velocity
As distance is to displacement, so speed is to velocity: the crucial difference between the two is
that speed is a scalar and velocity is a vector quantity. In everyday conversation, we usually say
speed when we talk about how fast something is moving. However, in physics, it is often
important to determine the direction of this motion, so you’ll find velocity come up in physics
35
problems far more frequently than speed.
A common example of speed is the number given by the speedometer in a car. A speedometer tells
us the car’s speed, not its velocity, because it gives only a number and not a direction. Speed is a
measure of the distance an object travels in a given length of time:
Velocity is a vector quantity defined as rate of change of the displacement vector over time:
average velocity =
It is important to remember that the average speed and the magnitude of the average velocity may
not be equivalent.
Instantaneous Speed and Velocity
The two equations given above for speed and velocity discuss only the average speed and average
velocity over a given time interval. Most often, as with a car’s speedometer, we are not interested
in an average speed or velocity, but in the instantaneous velocity or speed at a given moment.
That is, we don’t want to know how many meters an object covered in the past ten seconds; we
want to know how fast that object is moving right now. Instantaneous velocity is not a tricky
concept: we simply take the equation above and assume that is very, very small.
Most problems on SAT II Physics ask about an object’s instantaneous velocity rather than its
average velocity or speed over a given time frame. Unless a question specifically asks you about
the average velocity or speed over a given time interval, you can safely assume that it is asking
about the instantaneous velocity at a given moment.
EXAMPLE
Which of the follow sentences contains an example of instantaneous velocity?
(A) “The car covered 500 kilometers in the first 10 hours of its northward journey.”
(B) “Five seconds into the launch, the rocket was shooting upward at 5000 meters per second.”
(C) “The cheetah can run at 70 miles per hour.”
(D) “Moving at five kilometers per hour, it will take us eight hours to get to the base camp.”
(E) “Roger Bannister was the first person to run one mile in less than four minutes.”
Instantaneous velocity has a magnitude and a direction, and deals with the velocity at a particular
instant in time. All three of these requirements are met only in B. A is an example of average
velocity, C is an example of instantaneous speed, and both D and E are examples of average
speed.
Acceleration
Speed and velocity only deal with movement at a constant rate. When we speed up, slow down, or
change direction, we want to know our acceleration. Acceleration is a vector quantity that
measures the rate of change of the velocity vector with time:
average acceleration =
Applying the Concepts of Speed, Velocity, and Acceleration
With these three definitions under our belt, let’s apply them to a little story of a zealous high
36
school student called Andrea. Andrea is due to take SAT II Physics at the ETS building 10 miles
due east from her home. Because she is particularly concerned with sleeping as much as possible
before the test, she practices the drive the day before so she knows exactly how long it will take
and how early she must get up.
Instantaneous Velocity
After starting her car, she zeros her odometer so that she can record the exact distance to the test
center. Throughout the drive, Andrea is cautious of her speed, which is measured by her
speedometer. At first she is careful to drive at exactly 30 miles per hour, as advised by the signs
along the road. Chuckling to herself, she notes that her instantaneous velocity—a vector quantity
—is 30 miles per hour due east.
Average Acceleration
Along the way, Andrea sees a new speed limit sign of 40 miles per hour, so she accelerates. Noting
with her trusty wristwatch that it takes her two seconds to change from 30 miles per hour due east
to 40 miles per hour due east, Andrea calculates her average acceleration during this time frame:
average acceleration =
This may seem like an outrageously large number, but in terms of meters per second squared, the
standard units for measuring acceleration, it comes out to 0.22 m/s2.
Average Velocity: One Way
After reaching the tall, black ETS skyscraper, Andrea notes that the test center is exactly 10 miles
from her home and that it took her precisely 16 minutes to travel between the two locations. She
does a quick calculation to determine her average velocity during the trip:
Average Speed and Velocity: Return Journey
Satisfied with her little exercise, Andrea turns the car around to see if she can beat her 16-minute
37
time. Successful, she arrives home without a speeding ticket in 15 minutes. Andrea calculates her
average speed for the entire journey to ETS and back home:
Is this the same as her average velocity? Andrea reminds herself that, though her odometer reads
20 miles, her net displacement—and consequently her average velocity over the entire length of
the trip—is zero. SAT II Physics is not going to get her with any trick questions like that!
Kinematics with Graphs
Since you are not allowed to use calculators, SAT II Physics places a heavy emphasis on
qualitative problems. A common way of testing kinematics qualitatively is to present you with a
graph plotting position vs. time, velocity vs. time, or acceleration vs. time and to ask you
questions about the motion of the object represented by the graph. Because SAT II Physics is
entirely made up of multiple-choice questions, you won’t need to know how to draw graphs;
you’ll just have to interpret the data presented in them.
Knowing how to read such graphs quickly and accurately will not only help you solve problems of
this sort, it will also help you visualize the often-abstract realm of kinematic equations. In the
examples that follow, we will examine the movement of an ant running back and forth along a
line.
Position vs. Time Graphs
Position vs. time graphs give you an easy and obvious way of determining an object’s
displacement at any given time, and a subtler way of determining that object’s velocity at any
given time. Let’s put these concepts into practice by looking at the following graph charting the
movements of our friendly ant.
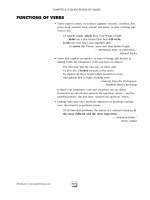
Any point on this graph gives us the position of the ant at a particular moment in time. For
instance, the point at (2,–2) tells us that, two seconds after it started moving, the ant was two
38
centimeters to the left of its starting position, and the point at (3,1) tells us that, three seconds after
it started moving, the ant is one centimeter to the right of its starting position.
Let’s read what the graph can tell us about the ant’s movements. For the first two seconds, the ant
is moving to the left. Then, in the next second, it reverses its direction and moves quickly to y = 1.
The ant then stays still at y = 1 for three seconds before it turns left again and moves back to
where it started. Note how concisely the graph displays all this information.
Calculating Velocity
We know the ant’s displacement, and we know how long it takes to move from place to place.
Armed with this information, we should also be able to determine the ant’s velocity, since velocity
measures the rate of change of displacement over time. If displacement is given here by the vector
y, then the velocity of the ant is
If you recall, the slope of a graph is a measure of rise over run; that is, the amount of change in the
y direction divided by the amount of change in the x direction. In our graph,
is the change in
the y direction and is the change in the x direction, so v is a measure of the slope of the graph.
For any position vs. time graph, the velocity at time t is equal to the slope of the line at t. In a
graph made up of straight lines, like the one above, we can easily calculate the slope at each point
on the graph, and hence know the instantaneous velocity at any given time.
We can tell that the ant has a velocity of zero from t = 3 to t = 6, because the slope of the line at
these points is zero. We can also tell that the ant is cruising along at the fastest speed between t = 2
and t = 3, because the position vs. time graph is steepest between these points. Calculating the
ant’s average velocity during this time interval is a simple matter of dividing rise by run, as we’ve
learned in math class.
Average Velocity
How about the average velocity between t = 0 and t = 3? It’s actually easier to sort this out with a
graph in front of us, because it’s easy to see the displacement at t = 0 and t = 3, and so that we
don’t confuse displacement and distance.
Average Speed
Although the total displacement in the first three seconds is one centimeter to the right, the total
distance traveled is two centimeters to the left, and then three centimeters to the right, for a grand
total of five centimeters. Thus, the average speed is not the same as the average velocity of the ant.
Once we’ve calculated the total distance traveled by the ant, though, calculating its average speed
is not difficult:
39
Curved Position vs. Time Graphs
This is all well and good, but how do you calculate the velocity of a curved position vs. time
graph? Well, the bad news is that you’d need calculus. The good news is that SAT II Physics
doesn’t expect you to use calculus, so if you are given a curved position vs. time graph, you will
only be asked qualitative questions and won’t be expected to make any calculations. A few points
on the graph will probably be labeled, and you will have to identify which point has the greatest or
least velocity. Remember, the point with the greatest slope has the greatest velocity, and the point
with the least slope has the least velocity. The turning points of the graph, the tops of the “hills”
and the bottoms of the “valleys” where the slope is zero, have zero velocity.
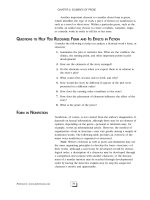
In this graph, for example, the velocity is zero at points A and C, greatest at point D, and smallest
at point B. The velocity at point B is smallest because the slope at that point is negative. Because
velocity is a vector quantity, the velocity at B would be a large negative number. However, the
speed at B is greater even than the speed at D: speed is a scalar quantity, and so it is always
positive. The slope at B is even steeper than at D, so the speed is greatest at B.
Velocity vs. Time Graphs
Velocity vs. time graphs are the most eloquent kind of graph we’ll be looking at here. They tell us
very directly what the velocity of an object is at any given time, and they provide subtle means for
determining both the position and acceleration of the same object over time. The “object” whose
velocity is graphed below is our ever-industrious ant, a little later in the day.
40
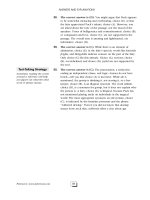
We can learn two things about the ant’s velocity by a quick glance at the graph. First, we can tell
exactly how fast it is going at any given time. For instance, we can see that, two seconds after it
started to move, the ant is moving at 2 cm/s. Second, we can tell in which direction the ant is
moving. From t = 0 to t = 4, the velocity is positive, meaning that the ant is moving to the right.
From t = 4 to t = 7, the velocity is negative, meaning that the ant is moving to the left.
Calculating Acceleration
We can calculate acceleration on a velocity vs. time graph in the same way that we calculate
velocity on a position vs. time graph. Acceleration is the rate of change of the velocity vector,
, which expresses itself as the slope of the velocity vs. time graph. For a velocity vs. time
graph, the acceleration at time t is equal to the slope of the line at t.
What is the acceleration of our ant at t = 2.5 and t = 4? Looking quickly at the graph, we see that
the slope of the line at t = 2.5 is zero and hence the acceleration is likewise zero. The slope of the
graph between t = 3 and t = 5 is constant, so we can calculate the acceleration at t = 4 by
calculating the average acceleration between t = 3 and t = 5:
The minus sign tells us that acceleration is in the leftward direction, since we’ve defined the ycoordinates in such a way that right is positive and left is negative. At t = 3, the ant is moving to
the right at 2 cm/s, so a leftward acceleration means that the ant begins to slow down. Looking at
the graph, we can see that the ant comes to a stop at t = 4, and then begins accelerating to the right.
Calculating Displacement
Velocity vs. time graphs can also tell us about an object’s displacement. Because velocity is a
measure of displacement over time, we can infer that:
Graphically, this means that the displacement in a given time interval is equal to the area under
the graph during that same time interval. If the graph is above the t-axis, then the positive
41
displacement is the area between the graph and the t-axis. If the graph is below the t-axis, then the
displacement is negative, and is the area between the graph and the t-axis. Let’s look at two
examples to make this rule clearer.
First, what is the ant’s displacement between t = 2 and t = 3? Because the velocity is constant
during this time interval, the area between the graph and the t-axis is a rectangle of width 1 and
height 2.
The displacement between t = 2 and t = 3 is the area of this rectangle, which is 1 cm/s
s = 2 cm
to the right.
Next, consider the ant’s displacement between t = 3 and t = 5. This portion of the graph gives us
two triangles, one above the t-axis and one below the t-axis.
Both triangles have an area of 1 /2(1 s)(2 cm/s) = 1 cm. However, the first triangle is above the taxis, meaning that displacement is positive, and hence to the right, while the second triangle is
below the t-axis, meaning that displacement is negative, and hence to the left. The total
displacement between t = 3 and t = 5 is:
In other words, at t = 5, the ant is in the same place as it was at t = 3.
Curved Velocity vs. Time Graphs
As with position vs. time graphs, velocity vs. time graphs may also be curved. Remember that
regions with a steep slope indicate rapid acceleration or deceleration, regions with a gentle slope
indicate small acceleration or deceleration, and the turning points have zero acceleration.
42
Acceleration vs. Time Graphs
After looking at position vs. time graphs and velocity vs. time graphs, acceleration vs. time graphs
should not be threatening. Let’s look at the acceleration of our ant at another point in its dizzy day.
Acceleration vs. time graphs give us information about acceleration and about velocity. SAT II
Physics generally sticks to problems that involve a constant acceleration. In this graph, the ant is
accelerating at 1 m/s2 from t = 2 to t = 5 and is not accelerating between t = 6 and t = 7; that is,
between t = 6 and t = 7 the ant’s velocity is constant.
Calculating Change in Velocity
Acceleration vs. time graphs tell us about an object’s velocity in the same way that velocity vs.
time graphs tell us about an object’s displacement. The change in velocity in a given time interval
is equal to the area under the graph during that same time interval. Be careful: the area between
the graph and the t-axis gives the change in velocity, not the final velocity or average velocity over
a given time period.
What is the ant’s change in velocity between t = 2 and t = 5? Because the acceleration is constant
during this time interval, the area between the graph and the t-axis is a rectangle of height 1 and
length 3.
The area of the shaded region, and consequently the change in velocity during this time interval, is
1 cm/s2 · 3 s = 3 cm/s to the right. This doesn’t mean that the velocity at t = 5 is 3 cm/s; it simply
43
means that the velocity is 3 cm/s greater than it was at t = 2. Since we have not been given the
velocity at t = 2, we can’t immediately say what the velocity is at t = 5.
Summary of Rules for Reading Graphs
You may have trouble recalling when to look for the slope and when to look for the area under the
graph. Here are a couple handy rules of thumb:
1. The slope on a given graph is equivalent to the quantity we get by dividing the y-axis by
the x-axis. For instance, the y-axis of a position vs. time graph gives us displacement, and
the x-axis gives us time. Displacement divided by time gives us velocity, which is what
the slope of a position vs. time graph represents.
2. The area under a given graph is equivalent to the quantity we get by multiplying the xaxis and the y-axis. For instance, the y-axis of an acceleration vs. time graph gives us
acceleration, and the x-axis gives us time. Acceleration multiplied by time gives us the
change in velocity, which is what the area between the graph and the x-axis represents.
We can summarize what we know about graphs in a table:
One-Dimensional Motion with Uniform Acceleration
Many introductory physics problems can be simplified to the special case of uniform motion in
one dimension with constant acceleration. That is, most problems will involve objects moving in a
straight line whose acceleration doesn’t change over time. For such problems, there are five
variables that are potentially relevant: the object’s position, x; the object’s initial velocity,
; the
object’s final velocity, v; the object’s acceleration, a; and the elapsed time, t. If you know any
three of these variables, you can solve for a fourth. Here are the five kinematic equations that
you should memorize and hold dear to your heart:
44
The variable
represents the object’s position at t = 0. Usually,
= 0.
You’ll notice there are five equations, each of which contain four of the five variables we
mentioned above. In the first equation, a is missing; in the second, x is missing; in the third, v is
missing; in the fourth,
is missing; and in the fifth, t is missing. You’ll find that in any
kinematics problem, you will know three of the five variables, you’ll have to solve for a fourth,
and the fifth will play no role in the problem. That means you’ll have to choose the equation that
doesn’t contain the variable that is irrelavent to the problem.
Learning to Read Verbal Clues
Problems will often give you variables like t or x, and then give you verbal clues regarding
velocity and acceleration. You have to learn to translate such phrases into kinematics-equationspeak:
When They Say . . .
They Mean . . .
“. . . starts from rest . . .”
“. . . moves at a constant velocity . . .”
a=0
“. . . comes to rest . . . ”
v=0
Very often, problems in kinematics on SAT II Physics will involve a body falling under the
influence of gravity. You’ll find people throwing balls over their heads, at targets, and even off the
Leaning Tower of Pisa. Gravitational motion is uniformly accelerated motion: the only
acceleration involved is the constant pull of gravity, –9.8 m/s2 toward the center of the Earth.
When dealing with this constant, called g, it is often convenient to round it off to –10 m/s2.
EXAMPLE
A student throws a ball up in the air with an initial velocity of 12 m/s and then catches it as it comes
back down to him. What is the ball’s velocity when he catches it? How high does the ball travel? How
long does it take the ball to reach its highest point?
45
Before we start writing down equations and plugging in numbers, we need to choose a coordinate
system. This is usually not difficult, but it is vitally important. Let’s make the origin of the system
the point where the ball is released from the student’s hand and begins its upward journey, and
take the up direction to be positive and the down direction to be negative.
We could have chosen other coordinate systems—for instance, we could have made the origin the
ground on which the student is standing—but our choice of coordinate system is convenient
because in it,
= 0, so we won’t have to worry about plugging a value for
into our equation.
It’s usually possible, and a good idea, to choose a coordinate system that eliminates
. Choosing
the up direction as positive is simply more intuitive, and thus less likely to lead us astray. It’s
generally wise also to choose your coordinate system so that more variables will be positive
numbers than negative ones, simply because positive numbers are easier to deal with.
WHAT IS THE BALL’S VELOCITY WHEN HE CATCHES IT?
We can determine the answer to this question without any math at all. We know the initial velocity,
m/s, and the acceleration due to gravity,
m/s2, and we know that the
displacement is x = 0 since the ball’s final position is back in the student’s hand where it started.
We need to know the ball’s final velocity, v, so we should look at the kinematic equation that
leaves out time, t:
Because both x and
are zero, the equation comes out to
But don’t be hasty and give
the answer as 12 m/s: remember that we devised our coordinate system in such a way that the
down direction is negative, so the ball’s final velocity is –12 m/s.
HOW HIGH DOES THE BALL TRAVEL?
We know that at the top of the ball’s trajectory its velocity is zero. That means that we know that
= 12 m/s, v = 0, and
m/s2, and we need to solve for x:
HOW LONG DOES IT TAKE THE BALL TO REACH ITS HIGHEST
POINT?
Having solved for x at the highest point in the trajectory, we now know all four of the other
variables related to this point, and can choose any one of the five equations to solve for t. Let’s
choose the one that leaves out x:
46
Note that there are certain convenient points in the ball’s trajectory where we can extract a third
variable that isn’t mentioned explicitly in the question: we know that x = 0 when the ball is at the
level of the student’s hand, and we know that v = 0 at the top of the ball’s trajectory.
Two-Dimensional Motion with Uniform Acceleration
If you’ve got the hang of 1-D motion, you should have no trouble at all with 2-D motion. The
motion of any object moving in two dimensions can be broken into x- and y-components. Then it’s
just a matter of solving two separate 1-D kinematic equations.
The most common problems of this kind on SAT II Physics involve projectile motion: the motion
of an object that is shot, thrown, or in some other way launched into the air. Note that the motion
or trajectory of a projectile is a parabola.
If we break this motion into x- and y-components, the motion becomes easy to understand. In the
y direction, the ball is thrown upward with an initial velocity of
and experiences a constant
downward acceleration of g = –9.8 m/s2. This is exactly the kind of motion we examined in the
previous section: if we ignore the x-component, the motion of a projectile is identical to the
motion of an object thrown directly up in the air.
In the x direction, the ball is thrown forward with an initial velocity of
and there is no
acceleration acting in the x direction to change this velocity. We have a very simple situation
where
and
is constant.
SAT II Physics will probably not expect you to do much calculating in questions dealing with
projectile motion. Most likely, it will ask about the relative velocity of the projectile at different
points in its trajectory. We can calculate the x- and y-components separately and then combine
them to find the velocity of the projectile at any given point:
47
Because
is constant, the speed will be greater or lesser depending on the magnitude of
. To
determine where the speed is least or greatest, we follow the same method as we would with the
one-dimensional example we had in the previous section. That means that the speed of the
projectile in the figure above is at its greatest at position F, and at its least at position C. We also
know that the speed is equal at position B and position D, and at position A and position E.
The key with two-dimensional motion is to remember that you are not dealing with one complex
equation of motion, but rather with two simple equations.
Key Formulas
Average Speed
average speed =
Average
Velocity
average velocity =
Average
Acceleration
average acceleration =
OneDimensional
Motion with
Uniform
Acceleration
(a.k.a. “The
Five Kinematic
Equations”)
Velocity of TwoDimensional
Projectiles
Practice Questions
48
1. . An athlete runs four laps of a 400 m track. What is the athlete’s total displacement?
(A) –1600 m
(B) –400 m
(C) 0 m
(D) 400 m
(E) 1600 m
2. . Which of the following statements contains a reference to displacement?
I.
“The
town
is
a
five
mile
drive
along
the
winding
II.
“The
town
sits
at
an
altitude
of
III. “The town is ten miles north, as the crow flies.”
(A) I only
(B) III only
(C) I and III only
(D) II and III only
(E) I, II, and III
country
940
road.”
m.”
Questions 3 and 4 refer to a car that travels from point A to point B in four hours, and
then from point B back to point A in six hours. The road between point A and point B is
perfectly straight, and the distance between the two points is 240 km.
3. . What is the car’s average velocity?
(A) 0 km/h
(B) 48 km/h
(C) 50 km/h
(D) 60 km/h
(E) 100 km/h
4. . What is the car’s average speed?
(A) 0 km/h
(B) 48 km/h
(C) 50 km/h
(D) 60 km/h
(E) 100 km/h
5. . A ball is dropped from the top of a building. Taking air resistance into account, which best describes
the speed of the ball while it is moving downward?
(A) It will increase until it reaches the speed of light
(B) It will increase at a steady rate
(C) It will remain constant
(D) It will decrease
(E) Its rate of acceleration will decrease until the ball moves at a constant speed
49
6. . A car accelerates steadily so that it goes from a velocity of 20 m/s to a velocity of 40 m/s in 4
seconds. What is its acceleration?
(A) 0.2 m/s2
(B) 4 m/s2
(C) 5 m/s2
(D) 10 m/s2
(E) 80 m/s2
Questions 7 and 8 relate to the graph of velocity vs. time of a moving particle plotted at
right.
7. . What is the acceleration and displacement of the particle at point A?
(A) Acceleration decreasing, displacement decreasing
(B) Acceleration constant, displacement decreasing
(C) Acceleration increasing, displacement decreasing
(D) Acceleration decreasing, displacement increasing
(E) Acceleration increasing, displacement increasing
8. . How do the acceleration and displacement of the particle at point B compare to the acceleration
and displacement of the particle at point A?
(A) Acceleration is less, displacement is less
(B) Acceleration is less, displacement is the same
(C) Acceleration is less, displacement is greater
(D) Acceleration is greater, displacement is less
(E) Acceleration is greater, displacement is greater
9. . A sprinter starts from rest and accelerates at a steady rate for the first 50 m of a 100 m race, and
then continues at a constant velocity for the second 50 m of the race. If the sprinter runs the 100
m in a time of 10 s, what is his instantaneous velocity when he crosses the finish line?
(A) 5 m/s
(B) 10 m/s
(C) 12 m/s
(D) 15 m/s
(E) 20 m/s
50