Báo cáo nghiên cứu khoa học: "Mô hình ăn uống và tình trạng dinh dưỡng của loại 2 bệnh nhân tiểu đường kiểm soát đường huyết ở Nongbualumphu bệnh viện, Thái Lan" ppsx
Bạn đang xem bản rút gọn của tài liệu. Xem và tải ngay bản đầy đủ của tài liệu tại đây (102.9 KB, 6 trang )
297
JOURNAL OF SCIENCE, Hue University, N
0
61, 2010
EATING PATTERNS AND NUTRITIONAL STATUS OF TYPE 2 DIABETIC
PATIENTS WITH GLYCEMIC CONTROL IN NONGBUALUMPHU
HOSPITAL, THAILAND
Muktabhant B
Faculty of Public Health, Khon Kaen University
Thonguthaisiri A
Nongbualumphu Hospital Thailand
SUMMARY
Introduction: Diabetic patients are requested to control their dietary intake in order to
keep their blood glucose levels at an acceptable level. This study aimed to determine eating
patterns and the nutritional status of inhabitants of Northeastern Thailand suffering from type 2
diabetes with good glycemic control (GC) compared with those with poor glycemic control (PC).
Methodology: During 2007, we performed a cross-sectional study of 284 type 2 diabetic
patients who attended diabetic outpatient clinics at Nongbualumphu Hospital, Thailand. 142
patients were in each group, GC (HbA
1c
of <7%) and PC (HbA
1c
of ≥7%),. Face to face
interviews were based on a questionnaire that included eating habits, and food
frequency
information. Body mass index (BMI) was used to indicate the nutritional status of the diabetic
patients. Chi-square tests were used to analyse and compare eating patterns, and nutritional
status between two groups. Results: Most of the patients (>90%) in both the GC and PC groups
ate three meals a day. About 70% of GC patients, while 53% of PC patients had breakfast and
dinner punctually (p<0.05). There were a higher proportion of GC patients who restricted the
amount of food consumed than PC patients (p<0.05). Moreover the GC patients ate stir-fried
dishes, sweet fruits and Thai fast food less frequently than the PC patients did (p<0.05). Fifty-
five percents of the subjects in both groups were obese. This difference was not statistically
significant. Conclusions: Better dietary control of diabetic patients should be encouraged to
improve their glycemic control and reduce long term complications.
Key words: Eating pattern, Diabetes mellitus, Glycemic control, Nutritional status
1. Introduction
The ultimate goal of management of type 2 diabetes patients is to prevent
complications. Good glycemic control can prevent retinopathy, kidney failure; and
cardio-vascular events, as well as other complications. Current guidelines set a
hemoglobin A
1C
level less than 7.0% as the goal of treatment. A dietary strategy is
298
recognized as a key component in prevention and management of type 2 diabetes
(T2DM). The diabetic patients are therefore requested to control their dietary in order to
keep their blood glucose levels at an acceptable level. However, only 30% of the T2DM
patients in Thailand are good control of their glycemic levels. This study aimed to
determine eating patterns and the nutritional status of inhabitants of Northeastern
Thailand suffering from type 2 diabetes. Two groups had been compared namely
individuals with a good- (GC), and those with poor control of their blood glucose levels
(PC).
2. Methodology
During 2007, a cross-sectional study was conducted with 284 diabetic patients,
of 142 with good glycemic control and 142 with poor glycemic control. All patients did
attend the diabetic outpatient clinics at the Nongbualumphu Hospital, within the
province of the same name in Thailand. Good glycemic control was defined as HbA
1c
of
<7%, and HbA
1c
>7% was considered as an indication of a poor glycemic control. Face
to face interviews were based on a questionnaire that included eating habits, and food
frequency information. The weight and height of the patients was measured, and the
body mass index (BMI) was calculated. For classifying the nutritional status, the Asian
criteria was applied in defining a BMI of 18.5 to 22.9 kg/m
2
as normal, a BMI of 23.0
to 24.9 kg/m
2
as overweight and a BMI>25 kg/m
2
as obese. The chi-square test was
used to test whether there was a statistically significant difference between the GC and
the PC group or not.
3. Results
3.1 Demographics
Seventy four percent of individuals in both the GC- and the PC group were
female. The average age of the patients was 59.7 for the GC and 55.3 years for the PC
patients. Most of the study participants finished primary school. About half of them had
no stable occupation. (Table 1)
Table 1. Characteristics of the subjects
Characteristics GC group (n=142) PC group (n=142)
% %
Sex: Male
Female
26.1
73.9
26.1
73.9
Age: <40
40-59
≥60
4.3
40.9
54.9
4.3
63.4
32.4
299
X ± SD 59.7 ±10.7 55.3 ± 8.8
Educational level:
No school
Primary school
Secondary school
Higher than Secondary school
4.9
90.2
3.5
1.4
7.0
81.0
9.9
2.1
Occupation:
No occupation
Farmers
Merchants
Laborers
Officers
54.2
27.5
6.3
10.6
1.4
48.6
32.4
7.8
5.6
5.6
3.2 Eating habits
Most of the study participants (>90%) in both groups ate 3 meals a day.
Punctuality of meal time was less consistent, with a little less than 70% of the GC group
being punctual for breakfast and dinner and only half reported being punctual for lunch.
While just 52% of the PC group reported punctuality for breakfast and dinner and only
44% of them for lunch. The proportion of individuals of the GC group controlling the
amount of food consumed was better than the PC group including rice, sweet fruits,
desserts and sweet drinks as well.(Table 2)
Table 2. Eating habits of the GC and PC patients
Categories GC group PC group P-value*
% %
Number of meals 0.24
2 meal/day 8.5 4.9
3 meal/day 91.6 95.1
Punctuality of meal time
For breakfast 69.7 52.1 0.009
For lunch 53.5 44.4 0.15
For dinner 68.3 52.8 0.007
300
Controlling the amount of food intake
For breakfast 78.2 66.2 0.08
For lunch 77.5 66.2 0.02
For dinner 75.4 65.5 0.04
Controlling the amount of rice intake 30.1 14.8 0.002
Controlling the amount of sweet fruits
intake
67.6 48.6 0.002
Controlling the intake of desserts 63.4 48.6 0.01
Controlling the consumption of sweet drinks
66.2 49.3 0.001
* p-value by χ
2
test
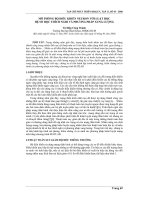
Frequency of Food Intake
The GC patients ate stir-fried dishes, sweet fruits and Thai fast food (ready to eat
dish such as Pad Thai, Kaw Pad) less frequently than the PC patients (p<0.05). The
percentage of the GC and PC groups were similar in the frequency of intake of sweet
drink, bakery, dessert, high cholesterol food and fatty meat and also vegetable. (Figure
1)
0 20 40 60 80 100 120
Fatty meat
High cholesterol food
Bakery
Dessert
Soft drink
Sweet drink
Fried food
Stir food
Thai fast food
Vegetable
Sweet fruit
% of the subjects
PC
GC
Figure 1. Percentage of the GC- and PC group by frequency of food intake at least 1 time/week
*
*
*
* Significant difference
between GC and PC group by
χ
2
test at
p
-
value <0.05
301
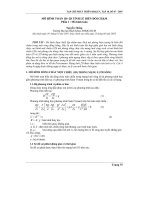
3.3. Nutritional status
In terms of BMI, the nutritional status of both the GC and the PC group were similar.
Twenty-one subjects of each group- the GC- and the PC group were overweight (BMI 23–
24.9 kg/m
2
) and 55 % of participants in each group were obese (BMI 25 kg/m
2
). (Figure
2)
0
10
20
30
40
50
60
%
underweight
normal
overweight
obese
GC
PC
Figure 2. Nutritional status of the GC and PC patients by BMI classification
4. Discussion
The diabetic patients with good glycemic control were more aware about their
disease than the ones with poor control. The results show that good glycemic control
patients reported better dietary habits than the people in the poor glycemic control group,
including punctuality of meal time, control of the amount of foods eaten which have a
high glycemic index (GI) food such as sweet fruits, sweet drink and desserts. High
glycemic index foods generally make blood sugar levels higher. Not surprisingly,
therefore, the patients who do not limit the intake of foods with a high glycemic index
are more likely to retain high blood glucose level than those that do. Some studies have
shown improvements
in glucose control following a low GI diet as compared to a
high
GI diet. For the nutritional status, about half of the patients in both groups were obese. A
study in Japanese patients with type 2 diabetes revealed that glycemic control was
poorly correlated with BMI. Although the nutritional status of both groups investigated
here was not different, eating habits between both groups differed to a great extent, as
mentioned before. Since blood glucose levels are also dependent on the total caloric
intake, the individuals with a food intake adjusted to their disease and those who
obviously did not care about blood glucose levels while eating also display a difference
in the total caloric intake. This reflected by a difference in the nutritional status between
groups. Why the results of the study did not show this requires further investigations. In
this study food intake could only be estimated qualitatively. Another explanation might
302
be that total caloric intake does not make a difference between good and a poor control
of bloods glucose levels for the patients, but instead sweet fruits, stir fried food, and
Thai fast food which contain a high amount of glucose and fat.
5. Conclusion
The importance of an adequate dietary intake is not entirely recognized by the
diabetic patients of the Nongbualumphu Hospital. A better understanding about the
relationship of certain food items to blood glucose levels seems to be necessary. More
investigations would also be helpful in differentiating between various frequently
consumed fruits which increase or do not increase blood glucose levels to a great extent.
Acknowledgments
We thank Prof.(emeritus) Frank P. Schelp for his kindness in English editing for
this paper.
REFERENCES
1. American Diabetes Association. Nutrition recommendations and interventions for
diabetes. A position statement of the American Diabetes Association. Diabetes Care
(2008); 31 Suppl 1
2. American Diabetes Association, Standards of medical care in diabetes, Diabetes Care
(2005); 28: S4–S36
3. Ben-Avraham S, Harman-Boehm I, Schwarzfuchs D, Shai I. Dietary strategies for
patients with type 2 diabetes in the era of multi-approaches; review and results from the
Dietary Intervention Randomized Controlled Trial (DIRECT). Diabetes Res Clin Pract.
(2009);86 Suppl 1:S41-8.
4. Rawdaree P, Ngarmukos C, Deerochanawong C, Suwanwalaikorn S, chetthakul T,
Krittiyawong S. Thailand diabetes registry project: clinical status and long term
vascular complications in diabetes patients. J Med Asso. Thai (2006); 89 (Suppl 1): S1-
S9.
5. Brand JC, Colagiuri S, Crossman S, Allen A, Roberts DCK, Truswell AS: Low glycemic
foods improve long-term glycemic control in NIDDM. Diabetes Care (1991);14: 95–101
6. Heilbronn LK, Noakes M, Clifton PM. The effect of high- and low-glycemic index
energy restricted diets on plasma lipid and glucose profiles in type 2 diabetic subjects
with varying glycemic control. J Am Coll Nutr. (2002);21(2):120-7
7. Sone H, Yoshimura Y, Tanaka S, Iimuro S, Ohashi Y, Ito H, Seino H, Ishibashi S,
Akanuma Y, Yamada N. Cross-sectional association between BMI, glycemic control
and energy intake in Japanese patients with type 2 diabetes. Analysis from the Japan
Diabetes Complications Study. Diabetes Res Clin Pract. (2007);77 Suppl 1:S23-9