The effects of a RMB devaluation on ASEAN economies
Bạn đang xem bản rút gọn của tài liệu. Xem và tải ngay bản đầy đủ của tài liệu tại đây (242.75 KB, 20 trang )
The Effects of a RMB Devaluation on ASEAN Economies: An Applied General
Equilibrium Approach
By Robert R. Teh Jr.
Director Trade, Industry and Services
Introduction
There is growing complexity in the economic relationship between ASEAN and China. On the one hand,
China is a major competitor to ASEAN both as an investment destination and as a major producer of
labour-intensive manufactures. But on the other hand, China’s maintenance of the renminbi during the
height of the Asian crisis was a major reason why the crisis did not precipitate an even more devastating
meltdown in the region.
This paper examines the effect of a depreciation of the Chinese renminbi on the ASEAN economies,
focusing in particular, on the resulting pattern of competitive advantage and effect on the market share of
ASEAN economies in major export markets - US, the EU and Japan. To the extent that a devaluation of
the renminbi serves as a proxy for the trade rivalry between ASEAN and China, the outcome of the
simulation should provide some answers to the state of the economic relationship between them.
Ever since the Asian crisis broke out in mid-1997, China's maintenance of the value of the renminbi has
served as a regional anchor preventing what could possibly have been successive rounds of competitive
devaluations. There was, however, an implicit trade-off being made by China - geo-political gain from
maintaining the renminbi as against the loss of export markets, as much cheaper goods from the
crisis-plagued region compete with Chinese goods. However, now as export performance stalls and as
growth slows in China’s domestic economy, the cost of delaying the devaluation may be steadily rising.
The threat of regional currency instability may have also ebbed with the beginning of economic recovery
in the crisis countries, making it less likely that a renminbi devaluation would be followed by
beggar-thy-neighbour responses elsewhere in the region.
To provide a quantitative analysis of the likely impact of such a devaluation on the ASEAN economies,
this paper uses the Global Trade Analysis Project (GTAP) model to simulate several devaluation
scenarios. The first part of this paper describes the GTAP model and examines some of the difficulties
involved in using applied general equilibrium models to simulate macroeconomic crises and devaluation
scenarios. The second part of the paper describes the procedures employed to simulate the Asian crisis
and subsequently the renminbi devaluation. The third part discusses the results of the simulation. The
results suggest that while a renminbi devaluation only has a small effect on total ASEAN exports, there is
substantial sectoral impact on ASEAN exports of textiles and apparel as well as other manufactures. This
suggests that individual ASEAN countries may experience a significant negative impact since textiles
and other manufactures are a bigger proportion of the trade of countries like Indonesia, the Philippines
and Thailand. Furthermore, a renminbi devaluation has large spillover effects on Japan, which could
precipitate competitive devaluation pressures on the rest of the region. Finally, it is also important to
factor in the possible rise of protectionist sentiment in the US, which has experienced strained relations
with China, and which suffers a large imbalance in the trade account in the face of a significant renminbi
devaluation. The results of the simulations tend to support the view that while ASEAN and China
compete directly in export markets and as investment destination, the degree of competition may be less
than what conventional wisdom suggests. The last part of the paper suggests further extensions of the
study.
Maybe as a final caveat, it is important to note that this paper is focussed exclusively on the trade effects
of a renminbi devaluation. It abstracts from issues of macroeconomic stability and adjustment and the
resulting impact on foreign investors of a realistic realignment of China’s currency. To the extent that a
renminbi devaluation is seen as a commercial response to deteriorating export performance, then the
framework of the analysis conducted here is probably appropriate for the purpose on hand. But if the
realignment of the currency is seen as part of a larger policy commitment to economic reform in China,
and couple this with the likely accession of China to the WTO sometime in the year 2000, then this static
analysis will likely underestimate the likely toll for ASEAN. As part of a larger package of reform
measures, a renminbi devaluation could re-energise foreign investor interest in China and produce
dramatic increases in economic efficiency and long-term export competitiveness that we would be unable
to capture in the simulations conducted with the GTAP model.
The GTAP Model
To simulate the effects of a renminbi devaluation, this paper makes use of the Global Trade Analysis
Project (GTAP) model developed by Hertel and Associates and which is described in detail in Hertel
1997. The advantage of using this model is that it has been widely used for simulating a number of
important global trade scenarios, such as a new round of WTO negotiations and global energy use and
climate change. Hence it is already familiar to a large number of international trade economists and
applied general equilibrium modellers and provides a widely shared platform for investigating
international trade issues.
Regional Household
In each region, there is a regional household whose Cobb-Douglas preferences are defined over
composite private expenditures, composite public sector expenditures and savings. The regional
household derives income from ownership and sales of primary factors of production - capital, skilled and
unskilled labour, land and natural resources. It turns out that the intertemporal, extended linear
expenditure system could be derived from an equivalent, static maximisation problem, in which savings
enters the utility function (Howe, 1975). This result provides a justification for the inclusion of savings in
the regional utility function.
Demand
Private expenditures are governed by a Constant Difference of Elasticity (CDE) function which was first
proposed by Hanoch (1975). The CDE function has the desirable property that the resulting preferences
are not homothetic and is more parsimonious in its parameter requirements than functional flexible forms.
It can also be shown that the CES and the Cobb-Douglas are special cases of the CDE function.
Government expenditures are governed by a Cobb-Douglas preference function. Finally, there is
inter-industry demand whose technical specifications are described by the usual input-output matrix.
Production
Production is assumed to be described by a multi-level production function (see Figure 1). The upper
nest is a Leontief-type production function involving value added and intermediate inputs. The technical
coefficients of this top-level nest are generated from the Social Accounting Matrix (SAM) constructed for
each region. Value added is produced through a Constant Elasticity of Substitution (CES) function of the
five primary factors of production. Each intermediate input is in turn produced using domestic and
imported components (the so-called Armington assumption) with the technical process described by a
CES function. Finally, imported components are a mix of imports from the other regions in the global
model with the technical process again described by a CES function.
Households own all factor supplies - land, natural resources, capital, skilled and unskilled labor and sell
their services to firms. In the GTAP model, sluggishness of some factors is allowed so that it is possible
for factor prices not to be equalised within a region. Firms are supposed to sell output and purchase
inputs (whether primary factors or intermediates) in competitive markets. Hence, firms make no
economic profits.
Prices and Taxes
The GTAP model allows for factor taxes, production and consumption taxes, export taxes and import
tariffs which are in turn distinguished by production sector, by agent (regional household, firm,
government) and by region.
Savings and Investment
Given the Cobb-Douglas assumption about preferences of the regional household, savings are a
constant proportion of regional household income. The pool of savings is what becomes available for
investments. There is a capital goods sector in each region, which produces the investment goods. The
rate of return on capital goods is assumed to be inversely related to the stock of capital. The allocation of
investment across regions and sectors is done in such a way that expected regional rates of return
change by the same percentage. In the model, the pooling of savings and the global allocation of
investment is done costlessly.
Aggregation
We have used a smaller 9 region and 10-sector aggregation of the larger 45 region and 50-sector GTAP
model. The data employed in the study is version 4 which uses 1995 data as the benchmark. The data is
described in greater detail in McDougall, R. et al (1999).
The 9 regions used in our simulation are ASEAN, the US, EU, Japan, China, Korea, Rest of Asia, the
Common Economic Relations (CER) and the Rest of the World. The GTAP database does not include all
ASEAN countries, and hence, ASEAN in this paper covers only Indonesia, Malaysia, Philippines,
Singapore, Thailand and Viet Nam. In this paper, "China" includes both the People's Republic of China
(PRC) and Hong Kong. This reflects not only the political reality that Hong Kong is now part of the PRC
but also the level of economic integration between Hong Kong and the PRC. It is important to highlight
that the inclusion of Hong Kong with the PRC implies that the renminbi devaluation is also accompanied
by a devaluation of the Hong Kong dollar by the same amount. Now the likelihood of Hong Kong
abandoning its currency board increases with the size of the renminbi devaluation, in which case,
lumping Hong Kong and the PRC together may make sense only for large devaluation scenarios. For
small devaluations of the renminbi, therefore, this paper may tend to overstate the likely impacts.
Other regions include the US, Japan and the EU which represent the biggest export markets of ASEAN
and China. Korea is given particular attention because it is an important crisis country. The other three
regions, which complete the aggregation employed in this paper are the Common Economic Relations
comprised of Australia and New Zealand, Rest of Asia and the Rest of the World.
The 10 sectors are food, vegetable oils and fats, other agricultural products, extractive industries, textiles,
chemicals, electronics and machinery, motor vehicles, other manufactures and services. The particular
aggregation employed highlights important sectors of interest to the ASEAN countries. The mapping from
the 45 country and 50 sector grouping of GTAP to our 9x10 model appears in Annex 1.
Simulating a Devaluation
Applied general equilibrium models are "real" models of the economy in which monetary and financial
variables do not enter. Hence macroeconomic variables are normally not integrated into AGE models
and if they are, ad hoc methods are typically used to introduce macroeconomic shocks or variables into
AGE models.
There are several ways in which macroeconomic shocks can be introduced in applied general equilibrium
models. One would be to impose the shocks exogenously by changing real prices or investment flows.
Another procedure would be to build explicitly dynamic models that allow interaction between
expectations and investments. In this paper, we take the first approach and shock the standard GTAP
model by adjusting the real exchange rate.
There are a number of possible prices in the GTAP model that could be used as the real exchange rate.
The Armington assumption is usually made in AGE models, which implies, that foreign and domestic
products are never perfectly substitutable. So to take an example, domestic food is not identical to
foreign-produced food and hence, their prices will differ even in the absence of other taxes and tariffs.
Hence, one possible real exchange rate to use would be the ratio of the index of exportable and
importable prices. However, in the context of the GTAP model, a more useful price to shock in order to
simulate the effect of a devaluation is the relative price of the country's factors of production. This is more
consistent with the macroeconomic consequences of a nominal devaluation since the ultimate
adjustment entails changes in the prices of factors of production. A nominal devaluation that is followed
by an equi-proportionate increase in the prices of primary factors of production would have no real effects.
Thus in the paper, we have simulated the renminbi devaluation and the Asian crisis devaluation with
changes in the prices of primary factors of production.
Baseline Scenario
The benchmark year used for release 4 of the GTAP database is 1995. However, this is not what we
want to use for our baseline scenario since we must start with the Asian crisis of 1997 and attempt to
mimic the resulting outcomes.
This is done by reducing prices of all primary factors in ASEAN and Korea by the same rate as the real
devaluation of the currencies in those countries (see Table 1). While the devaluation of the ASEAN and
Korean currencies have been enormous, ranging from 67% to 15%, the crisis-affected countries have
also seen an appreciable change in prices eroding a significant amount of the currency devaluation. For
example, while Indonesia has experienced a drop of nearly 67% in the value of the rupiah, price inflation
ran at 61% in 1998 virtually wiping out any competitive edge gained from the currency depreciation. As a
consequence, the real rate of depreciation for both ASEAN and Korea have been much lower. In the
case of ASEAN the computed average rate of real devaluation is only about 14.3% while it is only 8.8%
for Korea.
TABLE 1
Nominal Devaluation and Rates of Inflation in ASEAN and Korea, 1997-99
REGION
REGIONREGION
REGION
Nominal
Nominal Nominal
Nominal
Devaluation
DevaluationDevaluation
Devaluation
CPI
CPI CPI
CPI
Inflation
InflationInflation
Inflation
Real
Real Real
Real
Devaluation
DevaluationDevaluation
Devaluation
ASEAN
67.3%
80%
14.3%
Indonesia Malaysia Philippines
Singapore Thailand Vietnam
67.4%
33.6%
33.4%
14.9%
32.7%
21.2%
15.7%
1.7%
13.7%
10.9%
-0.1%
-25.6%
-17.7%
-13.2%
-19.0%
-10.3%
Korea 20.7% 11.9% 8.8%
Source: World Economic Outlook (May 1999).
In the paper, the prices of all primary factors of production are reduced by the amount of real devaluation
in each region. Prices of skilled and unskilled labor, capital, land and natural resources are reduced by
14.3% in ASEAN and by 8.8% in Korea. It would be preferable to have differential changes in factor
prices since there is considerable evidence to suggest that the impact of the Asian crisis on unskilled
labor was much more severe than to skilled workers or owners of land. However, we lack the detailed
information on how factor prices have changed in each region and have therefore chosen to reduce them
all by the same amount.
There is also an important complication created by the way we have chosen to introduce the real
devaluation in the GTAP model. Factor prices are made exogenous and reduced by the real devaluation
experienced by the region.
Accompanying the real devaluation, we have also added a shock to total factor productivity to mimic,
among other things, the near collapse of the banking sector in the crisis-affected countries. While it is
difficult to provide estimates of how much the banking crisis in Asia has affected the long-run growth
potential of the region, it is important to take these supply shocks into account because they affect the
short to medium term response of the producers in the crisis-affected countries. The output shock
assumption has also been used in other AGE simulation of the Asian crisis. In this paper, we have made
the productivity shocks equal to the actual GDP contraction experienced in ASEAN and Korea in 1998.
This was equal to -5.5% for Korea while the GDP-weighted average for ASEAN was -4.3% (see Table 2).
The output shock has the effect of dampening the export response to the initial real devaluation. This is
consistent with one of the important stylised features of the Asian crisis, which saw exports in US dollar
terms languish, despite the sharp fall in regional currencies.
TABLE 2
Output Shock in ASEAN and Korea
REGION
REGIONREGION
REGION GDP GROWTH
GDP GROWTHGDP GROWTH
GDP GROWTH
ASEAN
Indonesia
-4.3%
-
13 7%
Malaysia
Philippines
Singapore
Thailand
Vietnam
-6.8%
-0.5%
1.5%
-8.0%
3.5%
Korea -5.5%
Source: World Economic Outlook (May 1999).
Baseline Measures of GDP and Export Performance
The resulting global pattern of trade after the real devaluation and output shocks in ASEAN and Korea is
our baseline scenario. We can compare this Asian Crisis baseline with the 1995 benchmark of the GTAP
database. For Gross Domestic Product (GDP), we see that the Asian crisis simulation we have employed
has probably understated the actual contraction in GDP experienced by the crisis countries. ASEAN’s
GDP falls by 7.42% to US $ 568.0 billion while Korea’s GDP contracts by 16.2% to US $ 378.2 billion.
This compares with the latest IMF estimates of 1998 GDP for the two regions concerned - US $ 446.6
billion for ASEAN and US $ 310.1 billion for Korea. The simulation also suggests that there is very little
spillover effects of the Asian Crisis on other regional economies. One should probably not place too
much weight on the lack of a contagion effect in the simulations since AGE models are real models and
do not have a central role for financial variables.
TABLE 3
Impact of Asian Crisis on Regional GDP (Simulation Result)
REGION
REGIONREGION
REGION 1995 GDP
1995 GDP1995 GDP
1995 GDP CRISIS
CRISISCRISIS
CRISIS CHANGE IN GDP
CHANGE IN GDPCHANGE IN GDP
CHANGE IN GDP
ASEAN 613,444.4 567,953.6 -7.42%
USA 7,126,432.0 7,159,306.5 0.46%
Japan 5,091,655.0 5,125,799.5 0.67%
EU 8,209,777.0 8,250,170.0 0.49%
China 813,366.7 815,950.1 0.32%
Korea 451,163.3 378,228.3 -16.17%
Rest of
Asia
710,279.0 713,595.5 0.47%
CER 405,301.8 404,579.6 -0.18%
ROW 4,892,905.0 4,904,165.0 0.23%
TOTAL
TOTALTOTAL
TOTAL 28,314,324.2
28,314,324.228,314,324.2
28,314,324.2 28,319,748.5
28,319,748.528,319,748.5
28,319,748.5 0
00
0.02%
.02%.02%
.02%
Table 4 shows the world market share of all regions in the baseline scenario (Asian Crisis). ASEAN and
China are still relatively small players in the world market with ASEAN representing 6.9% of world exports
and China making up 5.0% of world exports. However, they are significant market participants in some
important products. ASEAN is a major player in vegetable oils (20.9% of world exports) and other
agricultural products (15.1% of world exports) while China has a huge share of textiles and apparel
(17.9%) and a significant share of other manufactures (7.8%).
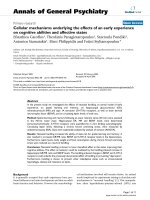
Figure 2 shows the sectoral composition of ASEAN exports. More than a third of ASEAN exports are
exports of electrical appliances and machinery; other major export sectors are other manufactures and
services.
FIGURE 2:SECTORAL COMPOSITION OF ASEAN EXPORTS
TABLE 4
Baseline (Asian Crisis) Structure of World Exports
In Per Cent
(Simulation Result)
SECTOR
SECTORSECTOR
SECTOR ASEAN
ASEANASEAN
ASEAN USA
USAUSA
USA Japan
JapanJapan
Japan EU
EUEU
EU China
ChinaChina
China Korea
KoreaKorea
Korea
Rest
Rest Rest
Rest
of
of of
of
Asia
AsiaAsia
Asia
CER
CERCER
CER ROW
ROWROW
ROW
Food 7.20 12.80 0.50 43.30 2.30 0.70 3.00 4.80 25.40
Vegetable Oil 20.90 22.10 0.10 21.70 2.30 0.00 1.50 0.60 30.70
Other
Agricultural
Products
15.10 10.50 0.40 25.80 3.10 0.40 3.20 6.30 35.30
Extractive 8.00 3.30 0.30 12.00 1.60 0.10 1.90 4.00 68.80
Textiles and
Apparel
7.40 5.00 2.90 33.10 17.90 3.90 11.40 0.40 17.90
Chemicals 4.80 12.00 6.10 49.40 2.50 1.80 2.70 0.90 19.80
Motor Vehicles 1.40 14.10 15.60 49.60 0.60 1.50 1.00 0.30 15.90
Electrical and
Machinery
9.50 15.50 16.50 37.30 4.10 2.70 4.30 0.40 9.80
Other
Manufactures
6.20 8.30 5.80 43.40 7.80 1.70 3.40 1.20 22.10
Services 6.60 17.50 5.40 40.80 5.90 2.10 1.60 1.70 18.30
Total
TotalTotal
Total 6.90
6.906.90
6.90 12.60
12.6012.60
12.60 8.50
8.508.50
8.50 39.80
39.8039.80
39.80 5.00
5.005.00
5.00 1.90
1.901.90
1.90 3.30
3.303.30
3.30 1.40
1.401.40
1.40 20.50
20.5020.50
20.50
Table 5 shows the market share of ASEAN and China in several key markets. ASEAN has a larger
market share than China in the three markets, with the lead being most pronounced in the Japanese
market. ASEAN exports have significant market share in food, vegetable oils, other agricultural products
and electrical appliances and machinery. On the other hand, Chinese exports have significant market
share in textiles and apparel and other manufactures.
TABLE 5
Market Share of ASEAN and China in Selected Markets
(Asian Crisis Simulation Result)
SECTORS
SECTORSSECTORS
SECTORS USA
USAUSA
USA EU
EUEU
EU JAPAN
JAPANJAPAN
JAPAN
ASEAN China ASEAN China ASEAN China
Food 12.6% 2.4% 1.9% 0.5% 15.6% 8.2%
Vegetable Oil 33.7% 0.3% 12.5% 1.2% 13.4% 5.6%
Other
Agricultural
Products
26.6% 1.9% 7.5% 1.5% 26.4% 8.1%
Extractive
Industries
1.4% 1.0% 1.1% 0.6% 22.0% 3.7%
Textiles & Apparel 12.9% 20.6% 4.2% 8.7% 9.4% 55.9%
Chemicals 4.0% 4.6% 0.9% 1.3% 10.3% 6.0%
Motor Vehicles 1.2% 0.8% 0.4% 0.1% 1.1% 1.3%
Electrical and
Machinery
15.2% 5.8% 4.1% 3.0% 21.0% 10.1%
Other
Manufactures
7.1% 15.0% 2.4% 4.1% 14.0% 17.2%
Services 7.0% 9.6% 4.2% 3.2% 16.8% 7.4%
TOTAL
TOTALTOTAL
TOTAL 8.8%
8.8%8.8%
8.8% 7.6%
7.6%7.6%
7.6% 2.9%
2.9%2.9%
2.9% 2.7%
2.7%2.7%
2.7% 16.3%
16.3%16.3%
16.3% 11.3%
11.3%11.3%
11.3%
Renminbi Devaluation Simulation Results
We now turn to examine how a renminbi devaluation would affect this baseline scenario. We simulate a
series of real devaluation scenarios: low (10%) and high (25%). There is strong non-linearity in the
simulation results with the trade impact becoming more pronounced for devaluation scenarios of 25% or
more. Some of the general conclusions that can be drawn from the simulation results are the following
(see Table 6):
a. Chinese exports respond strongly to a renminbi devaluation as exports rises by 33.9% with a
10% devaluation and more than double with a 25% devaluation.
b. The share of Chinese exports in world trade rises to 6.7% with a 10% devaluation and to 10.8%
with a 25% devaluation.
c. The biggest winners in absolute terms are Chinese exports of textiles and other manufactures.
Their share of world trade rises to 36.6% and 17.5% respectively with a 25% renminbi
devaluation.
d. The biggest winners in percentage terms are Chinese exports of motor vehicles, electrical
appliances and machinery and other manufactures.
e. The biggest losers from the renminbi devaluation are the EU, Japan, the CER and the US. This
follows from the rapid expansion of Chinese exports in those sectors in which the EU, Japan
and the US are major exporters.
f. ASEAN experiences only a moderate impact from a renminbi devaluation. Exports contract by
1.02% with a 10% devaluation and by 3.2% with a 25% devaluation. However, individual
ASEAN countries who are major exporters of textiles and apparel and other manufactures may
suffer disproportionately more.
g. Global trade still expands as a result of a renminbi devaluation despite the fall in exports from all
other regions.
Table 6 shows the changes in export values in the aftermath of a renminbi devaluation. China’s exports
leap by US $ 96.6 billion (a 33.9% increase) in the wake of a 10% devaluation while ASEAN’s total
exports decline by nearly US $ 4.0 billion (a 1.02% fall). A 25% devaluation of the renminbi more than
doubles Chinese exports by US $ 341.17 billion (a 119.7% increase) and reduces ASEAN exports by US
$ 12.5 billion (or a 3.2% decline).
TABLE 6
Change in Regional Exports from Renminbi Devaluation
(Simulation Result)
REGION
REGIONREGION
REGION TEN PERCENT DEVALUATION
TEN PERCENT DEVALUATIONTEN PERCENT DEVALUATION
TEN PERCENT DEVALUATION
TWENTY
TWENTYTWENTY
TWENTY-
-FIVE PERCENT
FIVE PERCENT FIVE PERCENT
FIVE PERCENT
DEVALUATION
DEVALUATIONDEVALUATION
DEVALUATION
ASEAN -1.02%
-4.0
billion
-3.18%
-12.5
billion
CHINA 33.89%
96.6
billion
119.67%
341.2
billion
US -1.28%
-9.1
billion
-4.21%
-30.1
billion
JAPAN -3.04%
-14.6
billion
-9.93%
-47.6
billion
EU -0.99%
-22.4
billion
-3.50%
-79.0
billion
KOREA -0.85%
-0.93
billion
-2.46%
-2.7
billion
REST OF ASIA -0.88%
-1.7
billion
-2.73%
-5.1
billion
CER -1.42%
-1.1
billion
-4.80%
-3.7
billion
REST OF WORLD -1.11%
-12.8
billion
-3.83%
-44.4
billion
TOTAL
TOTALTOTAL
TOTAL 0.53%
0.53%0.53%
0.53%
29.9
29.9 29.9
29.9
billion
billionbillion
billion
2.05%
2.05%2.05%
2.05%
116.0
116.0 116.0
116.0
billion
billionbillion
billion
Interestingly, a devaluation of the renminbi has a larger percentage impact on Japan, the CER, the US
and the rest of the world than on ASEAN. Japan’s exports decline by US $ 14.6 billion (a 3.04% decline)
with a 10% devaluation and by US $ 47.6 billion (a 9.9% decline) with a 25% renminbi devaluation. US
exports decline by US $ 9.1 billion (a 1.3% decline) with a 10% devaluation and by US $ 30.1 billion (a
4.2% decline) with a 25% renminbi devaluation.
It should also be noted that while the percentage reduction in EU exports is smaller than the reductions
experienced by Japan, the CER and the US, the EU actually faces the largest absolute reduction in
exports. With a 10% renminbi devaluation, EU exports fall by US $ 22.4 billion; the loss in export
revenues go up to US $ 79.0 billion with a 25% devaluation.
Sectoral Effects
The reason for the larger impact on Japan and the US has to do with the sectoral composition of Chinese
exports after the devaluation. From Table 7, we see that motor vehicle exports already doubles (albeit
from small levels) with a 10% devaluation. There is also a strong response in the electrical appliances
and machinery sector, textiles and other manufactures. Note that both motor vehicles and electrical
appliances and machinery are sectors where Japan and the US have a large share of world exports. The
EU has a substantial share of world exports in textiles and apparel and other manufactured products
which explains why in absolute terms, the renminbi devaluation also has a large adverse effect on it.
TABLE 7
Sectoral Changes in Chinese Exports
(Simulation Result)
SECTOR
SECTORSECTOR
SECTOR 10% DEVALUATION
10% DEVALUATION10% DEVALUATION
10% DEVALUATION 25% DEVALUATION
25% DEVALUATION25% DEVALUATION
25% DEVALUATION
Food 31.93% 110.29%
Vegetable Oil 26.14% 86.88%
Other Agricultural
Products
33.16% 113.82%
Extractive Industries 31.27% 114.25%
Textiles & Apparel 34.71% 114.64%
Chemicals 20.91% 68.09%
Motor Vehicles 101.06% 566.31%
Electrical Appliances &
Machinery
38.15% 138.84%
Other Manufactures 37.45% 131.02%
Services 24.90% 82.81%
TOTAL
TOTALTOTAL
TOTAL 33.89%
33.89%33.89%
33.89% 119.67%
119.67%119.67%
119.67%
In ASEAN, the most severely affected sectors are textiles and apparel, other manufactures and
extractive industries (see Table 8). However, with the exception of other manufactures, the other sectors
actually constitute only a relatively small part of total exports. This explains why the impact on ASEAN
exports is not as severe as say in the case of the EU, Japan and the US. We also note that some sectors
- motor vehicles, electrical appliances and machinery and chemicals - actually expand even in the face of
a renminbi devaluation.
However, the modest impact on overall ASEAN exports may hide significant inter-country differences.
ASEAN countries like Singapore and Malaysia, that have moved up the technological ladder, may require
little adjustments from a renminbi devaluation. We may not be quite as sanguine about other ASEAN
countries like Indonesia and Viet Nam, which may face greater exposure to trade in textiles and apparel
and labour-intensive manufactures.
Change in Market Share
The resulting structure of world exports is shown in Tables 9-10. China’s share of world exports rises to
6.7% with a 10% devaluation and then to 10.8% in the face of a 25% renminbi devaluation. Her share of
world exports in textiles and apparel, motor vehicles, electrical appliances and machinery and other
manufacture rises rapidly.
Given her already hefty role in world trade in textiles and apparel, the renminbi devaluation catapults her
to even greater prominence (36.6% of world exports with a 25% devaluation). This comes at the expense
of the EU and the rest of the world. ASEAN’s share of the textiles and apparel trade falls by 1.6
percentage points.
TABLE 8
Sectoral Changes in ASEAN Exports
(Simulation Result)
SECTOR
SECTORSECTOR
SECTOR 10% DEVALUATION
10% DEVALUATION10% DEVALUATION
10% DEVALUATION 25% DEVALUATIO
25% DEVALUATIO25% DEVALUATIO
25% DEVALUATION
NN
N
Food -2.38% -6.31%
Vegetable Oil -1.50% -4.03%
Other Agricultural
Products
-1.94% -5.94%
Extractive Industries -2.06% -7.18%
Textiles & Apparel -5.53% -17.65%
Chemicals 0.16% 0.90%
Motor Vehicles 1.79% 5.06%
Electrical App. &
Machinery
0.25% 0.74%
Other Manufactures -2.26% -7.61%
Services -0.62% -1.61%
TOTAL
TOTALTOTAL
TOTAL -
-1.02%
1.02%1.02%
1.02% -
-3.18%
3.18%3.18%
3.18%
An equally rapid run-up is experienced in trade in other manufactured goods. China’s share of this trade
rises to 10.6% with a 10% renminbi devaluation and thereafter to 17.5% with a 25% devaluation. This is
primarily at the expense of the EU and the rest of the world.
TABLE 9
STRUCTURE OF WORLD EXPORTS AFTER 10% DEVALUATION
(Simulation Result)
SECTOR
SECTORSECTOR
SECTOR ASEAN
ASEANASEAN
ASEAN USA
USAUSA
USA Japan
JapanJapan
Japan EU
EUEU
EU China
ChinaChina
China Korea
KoreaKorea
Korea
Rest
Rest Rest
Rest
of
of of
of
Asia
AsiaAsia
Asia
CER
CERCER
CER ROW
ROWROW
ROW
Food 7.00 12.60 0.50 43.20 3.10 0.70 3.00 4.80 25.20
Vegetable Oil 20.80 21.90 0.10 21.60 2.90 0.00 1.50 0.60 30.60
Other
Agricultural
Products
14.90 10.10 0.40 25.60 4.20 0.30 3.20 6.20 35.10
Extractive 7.80 3.30 0.30 12.00 2.10 0.10 1.90 4.00 68.50
Textiles and
Apparel
6.90 4.50 2.60 30.80 23.80 3.70 10.60 0.40 16.70
Chemicals 4.80 11.90 6.00 49.10 3.00 1.80 2.70 0.90 19.70
Motor Vehicles 1.40 14.00 15.10 49.50 1.30 1.50 1.00 0.30 16.00
Electrical and
Machinery
9.40 15.30 15.90 36.80 5.60 2.60 4.30 0.40 9.60
Other
Manufactures
6.10 8.00 5.40 42.30 10.60 1.60 3.30 1.20 21.40
Services 6.50 17.30 5.20 40.20 7.30 2.00 1.60 1.70 18.10
Total
TotalTotal
Total 6.80
6.806.80
6.80 12.40
12.4012.40
12.40 8.20
8.208.20
8.20 39.20
39.2039.20
39.20 6.70
6.706.70
6.70 1.90
1.901.90
1.90 3.30
3.303.30
3.30 1.30
1.301.30
1.30 20.10
20.1020.10
20.10
TABLE 10
STRUCTURE OF WORLD EXPORTS AFTER 25% DEVALUATION
(Simulation Result)
SECTO
SECTOSECTO
SECTOR
RR
R ASEAN
ASEANASEAN
ASEAN USA
USAUSA
USA Japan
JapanJapan
Japan EU
EUEU
EU China
ChinaChina
China Korea
KoreaKorea
Korea
Rest
Rest Rest
Rest
of
of of
of
Asia
AsiaAsia
Asia
CER
CERCER
CER ROW
ROWROW
ROW
Food 6.70 12.10 0.40 42.70 4.90 0.60 3.00 4.60 24.80
Vegetable Oil 20.50 21.30 0.10 21.40 4.40 0.00 1.50 0.60 30.20
Other
14.40 9.50 0.30 25.00 6.80 0.30 3.20 6.00 34.50
Agricultural
Products
Extractive 7.50 3.20 0.30 11.80 3.40 0.10 1.90 4.00 67.80
Textiles and
Apparel
5.80 3.60 1.90 25.70 36.60 3.10 9.00 0.30 14.00
Chemicals 4.80 11.70 5.80 48.20 4.20 1.90 2.90 0.90 19.60
Motor Vehicles 1.40 13.40 13.50 48.70 4.10 1.50 1.00 0.30 15.90
Electrical and
Machinery
9.30 14.60 14.60 35.50 9.50 2.60 4.30 0.40 9.30
Other
Manufactures
5.60 7.40 4.70 39.40 17.50 1.50 3.10 1.10 19.70
Services 6.40 16.70 4.90 38.80 10.50 2.00 1.60 1.60 17.50
Total
TotalTotal
Total 6.60
6.606.60
6.60 11.90
11.9011.90
11.90 7.50
7.507.50
7.50 37.70
37.7037.70
37.70 10.80
10.8010.80
10.80 1.90
1.901.90
1.90 3.20
3.203.20
3.20 1.30
1.301.30
1.30 19.30
19.3019.30
19.30
Since her exports of motor vehicles and electrical appliances and machinery start from relatively low
levels, the renminbi devaluation only produces small changes in her market share of world exports in
these sectors. Nevertheless, the gain in market share comes primarily at the expense of Japan and the
EU.
We also examine in which markets Chinese exports gain the most (Table 11) and in which markets
ASEAN loses its hold (see Table 12). Chinese exports gain market share in all regions, with the biggest
gains being made in the Japanese and US markets. There is also strong penetration of the Asian
economies - ASEAN, Korea and rest of Asia - particularly for larger rates of devaluation. This is
consistent with the greater trade and economic links among the Asia-Pacific countries. As is expected,
ASEAN exports lose market share in Japan and the US and just manages to maintain its hold on the EU
market. Intra-ASEAN trade also declines as a result of the renminbi devaluation, with the share of
intra-ASEAN imports falling from 19.2% to 18.5% for a 25% renminbi devaluation. We also note that prior
to the renminbi devaluation, ASEAN enjoys greater market share in all regions. However, with a 25%
devaluation, China zooms past in all regions except in ASEAN itself.
Other Risks
While the direct impact on ASEAN of a renminbi devaluation is expected to be sector-specific as well as
probably country specific, there are other risks associated with a renminbi devaluation that have to be
taken into account.
TABLE 11
MARKET SHARE OF CHINA
REGION
REGIONREGION
REGION BASELINE
BASELINEBASELINE
BASELINE 10% DEVALUATION
10% DEVALUATION10% DEVALUATION
10% DEVALUATION 25% DEVALUATION
25% DEVALUATION25% DEVALUATION
25% DEVALUATION
ASEAN 5.30% 7.20% 11.90%
US 7.60% 10.10% 16.40%
JAPAN 11.30% 14.60% 21.90%
EU 2.70% 3.70% 6.30%
CER 6.70% 8.90% 14.00%
KOREA 6.20% 8.20% 13.00%
REST OF ASIA 6.30% 8.40% 13.40%
ROW 3.30% 4.50% 7.80%
TABLE 12
MARKET SHARE OF ASEAN
REGION
REGIONREGION
REGION BASELINE
BASELINEBASELINE
BASELINE 10% DEVALUATION
10% DEVALUATION10% DEVALUATION
10% DEVALUATION 25% DEVALUATION
25% DEVALUATION25% DEVALUATION
25% DEVALUATION
ASEAN 19.20% 19.10% 18.50%
US 8.80% 8.70% 8.20%
JAPAN 16.30% 15.70% 14.40%
EU 2.90% 2.90% 2.80%
CER 10.80% 10.60% 10.20%
KOREA 8.60% 8.50% 8.10%
REST OF ASIA 12.90% 12.80% 12.30%
ROW 3.80% 3.80% 3.70%
CHINA 11.90% 11.50% 10.70%
We raise two important risks here. The simulations suggest that Japan has the most to worry about from
a renminbi devaluation. There may be strong pressure on Japan to allow its currency to devalue as a
consequence of a renminbi devaluation, which may then lead to further trade pressures on the ASEAN
countries. The second issue has to do with the possible rise of US protectionism if the renminbi
devaluation leads to a surge of Chinese imports and a deterioration in the US trade balance. We examine
this last issue in greater detail below.
Effect on US Trade Balance
There are important political dimensions to a renminbi devaluation and perhaps none is more important
than the impact on US-China economic and trade relations. The US has effectively become the “importer
of last resort” as a result of the Asian crisis and the weakness of the Japanese economy. The rising trade
imbalance has triggered protectionist reactions from the US. Just to cite some recent examples, there
has been a proliferation of anti-dumping actions on imports of steel as well as safeguard actions taken on
lamb imports from Australia and New Zealand. This unrelenting attention given to the US trade balance
by US policymakers is particularly surprising given the continuing strength of the US economy. The worry
is that if protectionism could rear its ugly head at a time of US economic strength, the likelihood of
stronger unilateral measures would rise dramatically if the US economy begins to slow down.
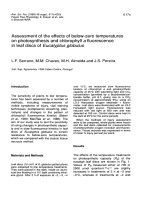
FIGURE 2 US TRADE BALANCE
We examine the effect of the renminbi devaluation scenarios on the US trade balance (see Figure 2).
Note that as expected the renminbi devaluation leads to a worsening of the US trade balance. The US
trade deficit is US $ 172.3 billion in the baseline scenario with the critical US-China trade deficit at US $
39.8 billion. A 10% devaluation of the renminbi leads to a moderate worsening of the trade balance to US
$ 192.8 billion but with the US trade deficit with China rising rapidly to US $ 65.7 billion. Note that the
increase in the trade deficit with China accounts for almost all the actual increase in the US deficit. A
devaluation in the order of 25% or more leads to a rapid deterioration of the US trade balance to nearly
US $ 239.8 billion with the US deficit with China increasing dramatically to US $127.8 billion.
As we can see from the figure, the share of the US-China deficit to the overall US trade imbalance rises
quite rapidly with larger changes in the value of the renminbi. The simulations seem to suggest that a
renminbi devaluation in the order of 10% would not lead to a dramatic worsening of the US trade balance
or to any serious rise in US -China trade tensions. However, a larger renminbi devaluation approaching
25% could have more serious repercussions and could trigger unilateral responses from the US - either
through emergency safeguard actions or through increased anti-dumping investigations.
The risks for ASEAN of a small renminbi devaluation seems to be modest and confined to specific
sectors which competes heavily with Chinese products. But increased US protectionism, particularly if
the devaluation is sufficiently large, and the spillover effects of a renminbi devaluation on other traders
and how they respond to it may be an additional worries
Summary and Conclusions
The paper uses a 9 region 10 sector applied general equilibrium model to simulate the effect of a
renminbi devaluation on ASEAN's competitive position in major export markets - the US, Japan and the
EU. The simulation is conducted in two phases. The first phase involves replicating the Asian crisis. This
is done by reducing factor prices in ASEAN and Korea by an amount equal to the real devaluation faced
by those two regions and applying a negative shock to output equal to the average contraction
experienced by the two regions in 1998. The second phase reduces factor prices in China between 10%
to 25% to simulate a range of possible renminbi devaluation scenarios. The results suggest that while a
renminbi devaluation only has a small effect on total ASEAN exports, there is substantial sectoral impact
on exports of textiles and apparel as well as other manufactures. This suggests that individual ASEAN
countries may experience a significant negative impact since textiles and other manufactures are a
bigger proportion of the trade of countries like Indonesia, the Philippines and Thailand. ASEAN's import
share also falls significantly in its key markets - Japan, China and the US. A renminbi devaluation is also
expected to erode the share of intra-ASEAN trade. Furthermore, there are other associated risks of a
renminbi devaluation which must be taken into account. It turns out that a renminbi devaluation has large
spillover effects on Japan, which could precipitate competitive devaluation pressures in the rest of the
region. Finally, it is also important to factor in the possible rise of protectionist sentiment in the US, which
has experienced strained relations with China, and which would suffer a large imbalance in the trade
account in the face of a large renminbi devaluation.
There are a number of possible extensions of the study that could be undertaken to strengthen the
conclusions that have been reached. The most obvious extension is to more adequately incorporate the
Asian Crisis elements in an AGE model. While there are limits to how well AGE models could capture the
Asian crisis, it is possible to look at alternative ways of introducing the shock to the GTAP framework, e.g.,
work through commodity prices rather than factor prices, set the trade balance or investment
exogenously, etc. Second, we have combined the PRC and Hong Kong together as one region, which
implicitly means that any devaluation of the renminbi is accompanied by an abandonment of the currency
board. Surely, this is not likely for small movements in the renminbi and a decoupling of the two for small
devaluation scenarios may be required. Third, given the pronounced sectoral impact of a renminbi
devaluation, the paper could be improved by decomposing ASEAN into its individual members so that
the country effects can be isolated.
REFERENCES
Hanoch, G. (1975). "Production and Demand Models in Direct or Indirect Implicit Additivity"
Econometrica 43:395-419.
Hertel, Thomas W. ed. (1997). Global Trade Analysis: Modeling and Applications. (Cambridge:
Cambridge University Press).
Howe, H. (1975). "Development of the Extended Linear Expenditure System from Simple Saving
Assumptions," European Economic Review 6:305-310.
Liu, Ligang, Marcus Noland, Sherman Robinson and Zhi Wang (1998). Asian Competitive Devaluations.
(Washington, D.C.: Institute for International Economics).
McDougall, R., Aziz Elbehri and Truong P. Truong, Ed (1999). Global Trade, Assistance and Protection:
The GTAP 4 Data Base (West Lafayette: Purdue University).
ANNEX 1
I. SECTORAL AGGREGATION
SECTORS
SECTORSSECTORS
SECTORS GTAP SECTORS
GTAP SECTORSGTAP SECTORS
GTAP SECTORS
1. Food
Paddy rice; Wheat; Cereal grains nec;
Vegetables, fruit, nuts; Sugar cane,
sugar beet; Fishing; Bovine cattle,
sheep and goat, horse meat products;
Meat products nec; Dairy products;
Processed rice; Sugar; Food products nec
2. Vegetable Oils and Fats Oil seeds; Vegetable oils and fats
3. Other Agricultural Products
Plant-based fibres; Crops nec; Bovine
cattle, sheep and goats, horses; Animal
products nec; Raw milk; wool, silk-worm
cocoons;
4. Extractive Forestry; Coal; Oil; Gas; Minerals nec;
5. Textiles and Apparel Textiles; wearing apparel
6. Chemicals
Petroleum, coal products; Chemical,
rubber, plastic products
7. Motor Vehicles
Motor vehicles and parts; Transport
equipment nec
8. Electronics and Machinery
Electronic equipment; Machinery and
equipment nec
9. Other Manufactures
Beverages and tobacco products; Leather
products; Wood products; Paper
products, publishing; Ferrous metals;
Metals nec; metal products;
Manufactures nec
10. Services
Electricity; Gas manufacture,
distribution; Water; Construction;
Trade, transport; Financial, business,
recreational services; Public
administration and defence, education,
health; Dwellings
II. REGIONAL AGGREGATION
REGIONS
REGIONSREGIONS
REGIONS GTAP REGIONS
GTAP REGIONSGTAP REGIONS
GTAP REGIONS
1. ASEAN
Indonesia, Malaysia, Philippines,
Singapore, Thailand, Viet Nam
2. US United States of America
3. EU
United Kingdom, Finland, Germany,
Denmark, Sweden, Rest of European Union
4. Japan Japan
5. China China, Hong Kong
6. Korea Korea
7. CER Australia, New Zealand
8. Rest of Asia
Taiwan, India, Sri Lanka, Rest of South
Asia
9. Rest of the World
Argentina, Brazil, Chile, Colombia,
Mexico, Uruguay, Venezuela, Central
America and the Caribbean, Rest of the
Andean Pact, Rest of South America
Morocco, Rest of North Africa, South
African Customs Union, Rest of Southern
Africa, Rest of Sub-Saharan Africa
Canada, Central European Associates,
EFTA, Finland, Former Soviet Union,
Turkey, Rest of Middle East, Rest of
World
Source: /> 09/1999