The effects of devaluation on the trade balance and the balance of payments
Bạn đang xem bản rút gọn của tài liệu. Xem và tải ngay bản đầy đủ của tài liệu tại đây (492.22 KB, 21 trang )
The Effects of Devaluation on the
Trade Balance and the Balance of
Payments: Some New Results
Marc
A.
Miles
R~itgti, Colltgr, Rntg<r\-Thr
Stnte
Lrl?r'er\rt\
This paper examines the statistical relationship between de\raluation
ant1 both the trade balance and the balance of paymelits for
16
de\raluatio~lsof 14 countries in the
1960s.
Using several tests involv-
ing both the seemingly u~lrelated and pooled cross-section time-
series regression techniques, the paper tests the effect of devaluation
hile sta~~dardizirlg
for other variables that map affect the foreign
accounts. \Yhile the balance of pa)-merits does seem to improve
follo\ving devaluation, no evidence is found to support the hypothe-
sis that cievaluation improves the trade balance. The paper con-
cludes that the acljustment to devaluation is essentially monetary in
nature, involving only
a
portfolio stock adjust~nent.
Within the international trade literature, it is not uncommon to find
arguments about lvhether devaluation will improve the trade balance
or the balance of payments. Each theoretical approach has its own set
of arguments. For example, the proponents of the elasticities ap-
proach (e.g., Robinson
1947;
Metzler
1948)
describe the necessary
and sufficient conditions for an improvement in the trade balance in
terms
of
elasticities of demand and supply.
If
the demand elasticities
are sufficiently large and the supply elasticities sufficiently small,
devaluation should improve the trade balance. Proponents of the
absorption approach (e.g., Alexander
1952;
Johiison
1967)
describe
11on. devaluation nlay change the terms of trade, increase production,
l'he author ~vould like
to
thank Jacob Frenkel, Harr! Johnson, Arthur Laffer,
Stephen Slagee, John Bilson. and an anonvmous referee for helpful aclvice and
corn-
ments. The\- should
not
be held responsible. holve~er, for any remaining errors.
[Joiir~i(il
01
PoJ~IIc(I/
F~orzo~riv,
1979.
xol.
Xi,
no
11
'G
1979
by
1
he
Yni\ersii\
of
C:hicago.
0022-380817Y~8703-00Oti$01
58
THE
ETFECTS
OF
DEVAI
L
ATION
60
1
switch expenditure from foreign to domestic goods, or have some
other effect in reducing domestic absorption relative to production
and thus improving the trade balance. International niorletarists (e.g.,
Mundell 197
1
;
Dornbusch
1973n;
Frenkel and Rodriguez
1975)
argue that derraluation reduces the real value of cash balaiices andlor
changes the relative price of traded and nontraded goods, thus im-
proving both the trade balance and the balance of payments.
This article, however, examines the statistical relationship between
devaluation and the two foreign accounts. More specifically, the arti-
cle tries to determine if, on the average, devaluation improves the
trade balance andior the balance of payments. No attempt is niade to
show the merits of one theoretical approach over another. While the
theoretical discussion
is
primarily in terms of a monetarist model, the
final empirical 111odel is a reduced-form equation that is not inconsis-
tent u.ith the other theoretical models. If devaluation causes a
significant improvement in the trade balance, this irnprovernent
should he statistically observable regardless of ivhich theoretical ap-
proach is used.
Section
I
describes empirical studies of the effects of devaluation by
other authors and analyzes why their approaches fail to answer the
relevant questions completely. Section I1 describes the functional
forms used in this study and summarizes the theory behilid the
model. Section I11 describes the various tests and their results. Finally.
Section
IV
summarizes the results and drarvs some conclusions.
I.
Other
Empirical
Studies
In recent years several papers have appeared tvhich have tried to
analyze empirically the effect of devaluation on the trade balance and
balance of payments. There are three basic objectio~is that one can
niake to these previous studies:
(1)
They examine only the impact
effects and fail to show whether any apparent improvement is tempo-
rary or permanent.
(2)
They do riot compare postdevaluation levels of
the accounts with predevaluation levels. It therefore cannot be de-
termined if an improvement as compared with the pear of devalua-
tion is also an irnproveme~it as compared with predevaluation years.
(3)
They have not accounted for the effects of other variables such as
the government's monetary or fiscal policy. Only the improvement or
~vorsening of the raw account figures follolving devaluation is re-
ported. Such a procedure is equivalent to ascribing all the changes in
the accounts to devaluation.
TYhile all three objections do not apply to each of the previous
studies, each study fBils to deal properly with at least one of them. For
example, the widely quoted study by Cooper (1971n, 1971b) is subject
- -
602
JOURNAL
OF
POLITICAL
ECONOMY
to all three objections.' Cooper shows that the impact effect of
15
of
24
devaluations is to "improve" the balance of goods and
service^,^
while in 17 of 24 cases the balance of payments improves. However,
there is no indication if this improvement is permanent, because
figures are not provided for succeeding years. Nor are figures pro-
vided for years prior to devaluation, so it is impossible to determine if
the "improved" level is an improvement over the levels in the previous
pears. In fact,
10
of the 15 "improved" balances of goods and services
are still negative follo~ving devaluation, while in contrast 14 of the 17
improved balances
of
payments are in surplus. Finally, no attempt has
been made to separate what portion of the improvement
is
due to
devaluation and what portion is due to changes in other variables.
Connolly and Taylor (1972) partially overcome some of the
shortcomings of the Cooper paper. Using 16 of the devaluations in
the Cooper sample, they try to relate improvements in the balance of
payments (defined as net change in reserves) and rates of domestic
credit creation. They conclude that
(1)
the higher the rate of devalua-
tion, the greater the improvement in the reserve position; and (2) the
higher the rate of domestic credit expansion following devaluation,
the smaller the improvement.
Laffer (1976) eliminates the first two objections in a test of
15
postwar devaluations. He examines the time path of the trade balance
over
'i
years, from
3
years before devaluation until
3
years after. He
finds that although the trade balance "improves" in the year following
devaluation for eight of the 15 cases, in one-half of those cases the
trade deficit is still worse than the average balance of the
3
years prior
to
clevaluation. Furthermore, 10 of the 15 countries have the largest
deficit of the 7-year period in the
3
years following devaluation, and
two more have the largest deficit in the year of devaluation. Ten of
the 14 countries with data for the third year following devaluation
have a larger deficit in that year than in the pear after devaluation.
Thus, there is little evidence of devaluation causing significant or
sustained improvement in the trade balance.
An analysis similar to Laffer's is performed by Salant (1976) on 101
devaluations, for both the trade balance and the balance of payments.
Salant
finds
that
in
about three-quarters of the cases
(75
of
101)
the
In this summary,
I
have excluded some well-known articles that attempt to explain
the effect of devaluation on the percentage change in exports, imports, market shares,
o1.5ome other related variables. IVtlile these articles purport to explain the effect on the
trade balance (a general equilibriutn concept), their technique is to examine changes in
exports or imports in isolation (a partial eq~lilibriuril concept). Since I am investigating
the siniultaneous net change in exports and imports in this paper,
I
have restricted the
discussion in this section to studies that have also dealt explicitly with this concept.
In
each of these studies, an "improvement" is defined as any absolute reduction in
a
drficit or
an
increase in a surplus.
603
THE
EFFECTS
OF
DEVALUATIOB
average balance of payments for the 3 years following devaluation is
improved as compared with the average in the
3
years preceding
devaluation. In contrast. in less than one-half the cases
(46
of 101)
does the average
of
the trade balance improve.
The implication of these studies is that there is considerably more
evidence for the balance of payments to improve following devalua-
tion than for the trade balance to do so. But, while some of the studies
overcome one or two of the previously stated objections, none takes
into account all three. Even more important, none of the tests fully
accounts for the third objection. Only the Connolly and Taylor (1972)
study makes any attempt to take into account the kffects of a variable
other than devaluation.
The object of this paper is to account for each of the three objec-
tions which arise from the previous studies. Evidence of not only the
impact but also the longer run effects of devaluation will be examined
and compared with the predevaluation behavior of the accounts.
Furthermore, an attempt will be made to isolate the effects of devalu-
ation alone by standardizing for the effects of other exogenous vari-
ables.
11.
The
Equations
The trade balance equation is an absorption model concentrating on
factors that affect domestic expenditure relative to domestic output.
A/-/
TB
=
a,
+
a:-)
A(g,
-
g,)
+
a:-'
A(M,
-
hIR)
Y,
(1
)
+ad-'
h(G,
-
GR)
+
nJr'
AEK,.
The balance of payments equation is a simple monetary approach
model concentrating on factors that affect money supply relative to
money demand.
where
TBi
=
the level of the trade balance in country
i;
Bpi
=
the level
of the balance of payments in country
i;
Yi
=
the level of output in
country
i;
gi,
gR
=
growth rates of income in country
i
and the
rest-of-world R;
Mi,
MR
=
the ratio of the average level of high-
powered money (where changes occur only from domestic sources) to
output in country
i
and the rest-of-world R;
Gi, GR
=
the ratio of
government consumption to output; and ERL
=
the exchange rate of
country
i
(see the Appendix for a more detailed description of these
variables).
604
JOURNAL
OF
POLITICAL
ECOSOhIY
Following Laffer
(1969,
1975),
increases in a country's growth rate
relative to the average growth rate in the rest of the world are
expected to cause a deterioration in the trade balance but an im-
provement in the balance of payments. These anticipated relation-
ships are consiste~lt with the theory that commodities such as money
and goods tend to flow from areas of the ~vorld where there
is
excess
supply to areas of excess demand. An increase in the relative growth
rate of a country increases demand for money and goods relative to
elsewhere, increasing the flow of these con~modities into the country
and causing the trade balance to Ivorsen and the balance of payments
to impr~ve.~
The nlonetary variable is not the usual money supply variable such
as
M
1
or
M2.
Rather,
it
represents changes in the level of the domestic
portion of high-powered money, the portion of high-powered money
directly under the control of the monetary authorities. The effect of
this variable on the trade balance is uncertain, depending upon se\,-
era1 factors. According to some theorists (Johnson
1972;
Dornbusch
19730, 1975;
Frenkel and Rodriguez
1975),
as the government in-
creases the money supply, the level of real balances in the economy
increases. Individuals perceive their wealth to rise, causing the level of
expenditure to increase relative to income and the trade balance to
deteriorate. However, a negative relationship between changes in the
money supply and changes in the trade balance may not be observed
for at least three reasons. First, nominal money balances may be only a
small fraction of total wealth. In this case, a devaluation will not cause
a significant change in real wealth. Second, expenditure may respond
only slightly to changes in wealth. Thus, even if the reduction in the
real value of money significantly reduces real ~vealth, an impercepti-
ble change in the trade balance will be observed. Finally, money may
not be perceived as net wealth by the private sector. In this case, there
"he hypothesized relationship bettveen the trade balance and growth rates ausumes
that demand shocks dominate supply shocks. If ari increase in the relative growth rate
represents an exogenous supply shock, then output increases Inore than demand,
creating an excess supply of goods and a positive relationship between changes in
relative growth rates and changes in the trade balance. However, if the increased
relative growth is caused b\ an exogenous dernand shock, domestic demand rises by
more than domestic supply, creating the negative relationship between changes in
relatibe growth rates and changes in the trade balance.
A
general equilibrium model of
ho~
demand shocks produce the negative relationship is provided in Laffer 11975) and
Laffer and hliles (1980), chap.
8.
Empirical cvidence that demand shocks tend to
dominate is found not only in this paper but also in Laffer (1969), Laffer and Ranson
(1975), and Miles (1977).
An
alternative explariation of the negative relationship in
terms of permanent income is found in Miles (1977). It' current economic conditions
strongll irlfluerice expectatiorls about the future, a rise in the current growth rate raises
the expected increase in income not only in the current year but in fl~ture years as well.
Permanent incomc theretor-e rises
b!
more than present income, causing current
demand to rise by more than current supply and a worsening in the trade balance.
605
THE EFFECTS OF
DEV.4LUATIOS
is no real balance effect and the trade balance does not deteri~rate.~ If
any of these three conditio~ls holds, the real balance effect loses its
empirical relevancy.
Increases in the money supply are expected to cause the balance of
payments to worsen regardless of whether the real balance effect is
relevant. Where a real balance effect exists, increasing the
money
supply increases the supply of real balances relative to demand; and
this excess supply ~vill be alleviated by an outflolv of money through
the balance of payments. 111 the absence of a real balance effect,
increasing the money supply raises the ratio of money to bonds above
the desired level, necessitating a portfolio adjustmeilt that occurs
exclusively through a balance of payments-capital account deficit.
Notice that it is not just the changes in the domestic ratio of money
to output which is used as the independent variable but, rather,
changes in the difference between the domestic and
rest-of-world
values. For example, as long as there is no reserve creation in the
~~orld,
the sum of all changes in the balance of payments must be zero.
If all governments are increasing the domestic ratios of money to
output, not all balances of pavments can be deteriorating. Instead, the
account will be expected to deteriorate in those countries where the
domestic ratio increases the most.
Government consunlption represents one source of direct expen-
diture in the economy. Thus, if the government increases the level of
its corlsumption by a dollar, as long as individuals do not immediately
view government expenditures as merely replacing their private con-
sun~ption,total expenditure will rise. Given the level
of
output, a rise
ill total expenditure causes the trade balance to deteriorate. As in the
case of the monetary variable, the change in the domestic ratio rela-
tive to the rest-of-~vorld ratio is used as the independent variable.
Since devaluation is a monetary phenomenon, the expected effects
depend upon the importance of the real balance effect. If the real
balance effect is empirically relevant, devaluation is expected to im-
prove both the trade balance and the bala~lce of pavments. The
Eeduction in real balances caused by devaluation both ;-educes expen-
diture and creates an excess demand for money, ivhich has the effect
of improving both accounts. Hon~ever, if the real balance effect
is
not
empirically relevant, only the balance of payments is expected to
improve. The absence of a real balance effect means that both expen-
diture and the trade balance are unaffectecl. Instead. devaluation
Qank-created or "inside" monev is certainly recognired not to be net wealth to the
private sector.
The
onlv remaining rnone! asset is fiat or high-powered
mane\.
Fiat
monev is the liability of the guvernment,
To
the extent that
the
private sector recog-
nizes that governmental liabilities represent tax liabilities on the PI-ivate sector, fiat
money is si~nultaneousl\
both
a private asset and liability.
606
JO~RNAL
OF
POLITICAL
ECONOMY
reduces the ratio of real money assets to real net bond assets below the
desired level. The necessary adjustment occurs entirely as a portfolio
reacljustment, as bonds are exchanged for money.
111.
Empirical
Tests
In this section the functional forms of the trade balance and the
balance of payments equations described above are used in several
tests to try to determine if devaluation has a positive effect on either
account. As an interesting by-product of the procedure, the impor-
tance of the individual variables in affecting the accounts can also be
measured.
By regressing country equations separately using ordinary least
squares (OLSs), it is implicitly assumed that the errors of the indi-
vidual
countr?. equations are unrelated. However, such an assumption
may not be valid for the trade balance and the balance of payments.
For the world as a whole, the sum of all trade balances or the sum of
all balance of payments is constrained to be zero. For each export in
the world there must be an equivalent import. Thus, the trade balance
and balance of payments errors for all countries in the world are not
independent. The remaining question is what effect any covariance of
errors will have on the estimated coefficients. The effect of the
covariance is measured through the use of seemingly unrelated re-
gressiorls (Zellner 1962; Kmenta 1971). The first step of the proce-
dure is to estimate the individual country equations by OLSs. At this
stage, the equations are assumed unrelated. However, in the second
step the errors of these equations are used to create a variance-
covariance matrix. The final step is to use Aitken's generalized least
squares to reestimate the individual regression coefficients incor-
porating the information about the covariance of the errors. Incor-
porating the information increases the efficiency of the estimators.
The sample
of
countries for the seemingly unrelated tests consists
of 14 countries. One problem is the possible first-order autocorrela-
tion of the disturbances of individual countries. To handle the au-
tocorrelation, estimates of the autocorrelation coefficient
p
obtained
from the iterative Cochrane-Orcutt technique (CORC) on OLSs are
used to transform the data before the present test is performed. The
transformation leaves each variable in each of the 14 countries with 17
observations for the period 1956-72.
607
THE
EFFECTS
OF
DEVALUATIOh'
The seemingly unrelated regressions are used for both a residuals
test and a direct test of the exchange rate, both of which are described
below
:'
Residuals Test
This test utilizes equations
(1)
and
(2)
~~itho~itthe exchange-rate
variable. Excluding the exchange rate in the estimated equation
means that the residuals of the equation represent the effects of
devaluation and all other variables. Using a test similar to one em-
ployed by Fama, Fisher, Jensen, and Roll
(1969),
the path of the
residuals around devaluation is examined to determine if they be-
have differently after devaluation occurs as compared with prior
behavior.
Examination of these residuals around the period of devaluation
provides information about the effectiveness of devaluation. For
example, if devaluation causes a permanent improvement in the trade
balance, there should be large positive residuals at or near the year of
devaluation and only small
or
random residuals in subsequent years.
The large positive residuals indicate a large positive change in the
trade balance that is not explained by government monetary or con-
sumption policy or by growth rates. The subsequent small residuals
would indicate little change in the trade balance in the future that is
not due to the two policies or growth rates.
The monetary approach suggests that there should be only a tem-
porary improvement in the trade balance as real cash balances return
to the desired level.
A
temporary improvement ~vould be indicated by
positive residuals at or near the year of devaluation and negative
residuals in subsecluent years. This pattern of residuals would indicate
a positive change in the trade balance not explained 11y the stan-
dardized variables, followed by eventual negative changes as the trade
balance returns to its original level. If the trade balance is to return to
its original level, the sum of the positive residuals should approximate
the sum of the negative residuals.
A
third possible path of' behavior is the so-called J-curve. Under this
hypothesis, devaluation causes the trade balance to worsen initially,
due to price effects, but eventually to improve as demand for the
countr-y's goods increases. This hypothesis would be consistent with
initially large negative residuals followed by large positive residuals.
If
This paper reports only the results of the seemingly unrelated regression equations.
However, a comparison of the results for both OL.Ss and seeminglv unrelated regres-
sions is reported in Miles
(1978).
The primary effect of using the seemingly unrelated
technique is to increase the frequency of significant coefficients of the expected sign.
608
JOURNAL
OF
POLITICAL
ECONOMY
the trade balance eventually improves, the sum of the positive re-
siduals must exceed the sum of the negative residuals.
The residuaIs for each country are divided
bx
the standard error of
the seemingly urlrelated regreosion for that country. This procecture
prevents the residuals of countries with large
1
ariame in the residuals
from having a disproportionate
n
eight when residuals are averaged
across countries."
In each country, the year of devaluation is called !,ear
t.
Residuals
(divided by the standard errors) are collected for each country for the
7
years
t
-
3
tot
+
3.
The residuals of similar periods (~vith respect to
devaluations) are then summed across countries, and average residu-
als are created by dividing by the number of countries in the group.
The resulting number represents the average residual as a fraction of
the standard error for all the countries in the year of devaluation. The
procedure is repeated for the other six time periods, permitting
comparison of the averages from
3
years before until
3
years after
devaluation. If devaluation improves the trade balance or balance of
payments, the improvement will surely occur within
3
years.
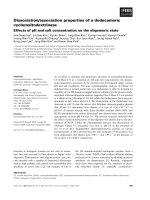
The results of this procedure are shown for the trade balance in
table
1
and for the balance of payments in table
2.
Both tables contain
the residuals for
16
devaluations of the
14
countries, as well as the
average values. Examine first the results for the trade balance. The
average residuals are snlall but positive in the
2
years prior to devalu-
ation. This result suggests that any deterioration of the trade balance
in those years appears, on the average, to be caused by government
policies and grolvth. In the year of devaluation, however, there is a
very large negative residual. The residual is larger
in
absolute size
than the residual in any of the other 6 years. In the following
3
years,
there is a positive residual only in year
t
+
1.
But this positive residual
is
only about three-fifths the absolute size of the negative residual in
the year of devaluation. In other words, there
is
no evidence of
devaluation improving the trade balance even temporarily. Devalua-
tion has a large negative effect in year
t
and continues to have a net
negative effect in the follo~ving
3
years.
In
fact, the trade balance
deteriorates even more follolving year
i
+
1.
"
The purpose of dividing the residual\ b) the standard error of the corresponding
equation is to include deviations that are
not
due to just a poorl) fittecl regression
equation. The procedure is an attempt to tackle the problern of weighting outl)ing
observations. However, an alternative vielv might be that the residuals should not be
weighted.
Tlle residuals test has been performed on both seemingly unrelated and
OLSs for (i) residuals ~eighted
hy
the inverse of the standard errors. (ii) un\ieighted
residuals, and (iii) unweighted residuals, but excluding countries ~\.ith "large" or outly-
ing residuals. In each case, the results are esentiallv the same for both the trade balance
and the balance of payments. The results, therefore, do not appear
sensitive
to either
the weighting wheme or the tvpe
of
regression analysis. For thc I-esults using un-
weighted residuals of the
OLSs
equatiom, see hIiles
(1078).
m~?-bcm~q~,m,ma-bbmq'cm,
mmamrnc~~~~pbmcb~a~qb~
P~lr,r:cqf+cq~5!xq-D!Lyq-CI!D~cc:-
-
I
i-i
I
1x1
I
I
l
., ,.
4
-1?1'
I I l l I l l
THE
EFFECTS
OF
DEVALUATION
61
1
The pattern of the I-esiduals for the trade balance contrasts sharply
with the pattern for the balance of payments. The average balance of
payments residuals are negative for the
3
years prior to devaluation,
peaking in
t
-
1,
the year before devaluation. However, in the year of
devaluation, the average residual suddenly beco~nes positive. In year
t
+
1,
the residual is again positive and even larger in value. In year
t
+
2,
the residual again becomes negative, but since none of the im-
provement in the balance of payments
is
offset for at least
2
years,
devaluation has clearly inlproved the balance of payments.
The contrasting pattern of response to devaluation for the trade
balance and the balance of payments is also apparent within the
individual countries. In five of the
16
devaluations, the residuals of
the balance of payments equation in the year of devaluation are
positive and at least one standard error in size. None of the negative
residuals are that large. In contrast, for the trade balance only one
residual is positive and one standard error in size, while five nega-
tive residuals are that large. Even in
t
+
1,
the trade balance equa-
tions have only three positive residuals of one standard error in size,
compared with four for the balance of payments.
Furthermore, the improvement in the balance of payments
in years
t
and
t
+
1,
followed by a deterioration in year t
+
2,
is consistent with
the pattern of behavior associated with a "stock adjustnlent of the
money supply following devaluation. While the negative value in
t
+
2
does not completely offset the combined improvements oft and
t
+
1,
a sizable proportion is offset. The remaining improvement may rep-
resent the continued return of capital that fled in the years prior to
devaluation. In any case, the failure of the trade balance to display
similar behavior indicates that it probably does not play a significant
role in such an adj~stment.~
A
Direct Test of the Exchange Rate
An alternative method of testing the effects of devaluation is to enter
the exchange rate directly into the trade balance and balance of
payments equations, as in equations
(1)
and
(2).
The statistical
significance
and
sign of the exchange-rate coefficient then gives an
Ten of the 16 devaluations occurred in 1967. This simultaneity of devaluation coulcl
possibly affect the results since some of the 10 countries may have actually revalued
against each other in that >-ear. However, the results do not seem to he sensitive
to
the
inclusion
of
these 10 cases. From table 1 the average non-1967 residuals fnr the trade
balance are .399,
223, 118, a55
(yeart),
,822,
769, and
,242.
From table
2
the
average non-1967 residuals for the balance of payments are
-0.082,
-0.197, 660,
,233
(vear
t),
,650,
583,
and
,158.
The patterns of the average residuals of the
non-1967 devaluations are essentially the same as the patterns when the 10 1967
devaluations are included. The conclusions of the paper are therefore unaffected.
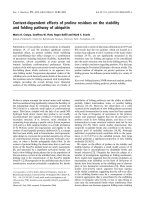
612
JOURNAL
OF POLITICAL ECONOMY
TABLE
3
TRADE
SEPSIISGLY
REGKESSIOSS
BAL~SLE:
UNKELAI-ED
Country
(1
o
0
1
a
a
0
4
United
Kingdom
Denmark
France
Finland
Icela~lcl
Ireland
Spain
New Zealand
Costa
Rira
Ecuador
Guyana
Israel
Sri 1,anka
Philippines
NOIE
4 f
=
12:
'35.5
percent
(one-tnilcd)
=
?
li9:
93.0
percenr lone-ra~ltd)
=
i.iX'?.
i10
O
perrcnt
lonr-tcilled)
=
1.356.
indication of the importance atid direction of changes in the
exchange-rate variable in affecting the accounts.
The results of this test are shobvn in tables
3
and
4.
Since the
exchange-rate variable is the units of domestic currency per unit of
foreign currency,
a
significant effect in improving one of the accounts
~vould be indicated by a positive, significant coefficient. Using this
criteria, the exchange rate is significant at the
95
percent level (one-
tailed test) for three of the
14
countries with respect to the trade
balance and five countries with respect to the balance of payments.
Furthermore, there are two countries whose trade balance equations
have a negative, significant exchange-rate coefficient, versus only one
for the balance of payments.
So
while neither table provides evidence
of an o\~er~vhelming
positive effect of' devaluation on the accounts, the
balance of payments equations have a much higher ratio of positive,
significant coefficients
to
negative, significant coefficients than do the
trade balance equations.
THE
EFFECTS
OF
DEVALUATION
6
13
TABLE
4
BALANCE SEEMINGLY REGRESSIONS
OF
P.AI~\IENTS: UXRELATED
Country
h,,
11
1
hs
63
United
Kingdorn
De~lmark
Frarlce
Finland
Iceland
Ireland
Spain
Neb7 Zealalld
Chsta
Kica
Ecuador
GUT
ana
1 sracl
ST-i
I.anka
Philippines
No~r
4 1
=
12:
!I7
5
pcrcnit
(onc-tnllrd)
=
2.179:
95.0
prricnt
(or~r-raiictli
=
1
782:
90
O
perreni (onr-tailed)
=
13.56
It
is interesting at this point to examine the effects of the other
independent variables. In table
3
eight of the
14
trade balance
equations have negative (expected sign), significant (one-tailed test)
gro~vth-rate coefficients, while only four of the monetary coefficients
and six of the government-consumption coefficients are negative and
significant.
In
the balance of payments equations, four gro~vth-rate
coefficients are positive and significant, while nine of the
14
monetary
coefficients are negative and significant. Therefore, the only relation-
ships firmly established here are the negative ones between the trade
balance and growth and between increases in the money supply and
the balance
of'
payments.
As a further attempt to test the importance of the variables. the
coefficients of the variables are constrained to be the same in all
614
JOURNAL OF POLITICAL ECONOMY
countries. The procedure involves performing a pooled cross-section
time-series regression on the
14
countries. The pooled cross-section
time-series technique is useful because, if the pooling is valid, it
greatly increases the degrees of freedom of the regression equation
and thus the efficiency of the estimate.
The particular model used in the analysis is an error-components
model which accounts for the existence of country-specific residuals,
residuals tvithin a country over time, as well as autoregression. First,
each country's data are transformed using the estimates of
p
obtained
from the individual country equations. Next, mean values for specific
countries and mean values over all countries are calculated for each
variable. Regressions are performed for all countries on the dif-
ference hettveen the overall mean and country mean and between the
country mean and individual observations. The results of these re-
gressions are used to obtain estimates of the variance of the countrv-
-
specific and within-country errors. These estimates are then used to
weight the data of individual countries in order to eliminate hetero-
scedasticity of errors across countries.
This procedure is used first for the trade balance. At first, all
14
countries are included in the sample. However. the test for aggrega-
tion of the sample fails. The aggregation test is an F-test that asks
whether constraining the coefficients to be the same in all countries
significantly raises the sum of squared residuals. This test is equivalent
to testing the null hypothesis that the coefficients are in fact the same
across all countries. With all countries included, the value of the F-test
is
F(52,182)
=
2.98,
tvhich call be rejected at even the
99.9
percent
level. However, when the four countries with the largest residuals are
eliminated, the null hypothesis can be accepted. The four countries
eliminated are Iceland, Guyana, Israel, and Sri Lanka. The F-test is
notv
F(36,130)
=
1.315,
which cannot be rejected at even the
90
percent level.
The estimated coefficierlts foi- the variables in this regression are
G
=
-
.078 (1.77);
M
=
-
.I63 (2.55);
GC
=
-
.318 (1.88);
ER
=
-
.058
(.36);
and
.06,
where
G,
M,
GC,
and
ER
represent the same
growth rate, monetary, government consumption, and exchange-rate
variables referred to previously and values in parentheses are the
t-statistics. The growth-rate, monetary. and government-consumption
variables all have the predicted negative sign
and are significant at the
95
percent level (one-tailed test). The exchange-rate variable, how-
ever, has the wrong sign and is not significant. There is still no
evidence of a significant positive effect of devaluation on the trade
balance.
The attempts
to
pool the balance of payments equations are less
successful. Eliminating even six of the countries did not produce a
THE
EFFECTS
OF
DEVALUATION
615
sufficiently small F-statistic for the aggregation to be valid. With only
eight countries remaining, the F-statistic is F(21,112)
=
2.85, a value
which can be rejected at even the 99.9 percent level. But although the
aggregation test fails, the results of the pooled balance of payments
equation may still be illustrative. The estimated coefficients for the
follo~~ingvariables are
G
=
.0
19 (.73);
M
=
-
.129 (2.68);
ER
=
.I74
(2.19); and
R2
=
.09 (t-statistics in parentheses). The monetary and
growth-rate variables have the predicted sign as before. Also as be-
fore, the monetary variable is significant while the growth-rate vari-
able is not. However, the most interesting result is for the exchange
rate. While the exchange-rate coefficient of the pooled trade balance
equation has the wrong sign and is not significant, the exchange-rate
coefficient of the balance of payments equation is positive and
significant at the 95 percent level. Again, there is additional evidence
that devaluation does not improve the trade balance but improves the
balance of payments.
Leads and Lags
In the final procedure, lag and lead values of the exchange rate are
introduced. While the constrained contemporaneous exchange-rate
variable has an insignificant effect on the trade balance,
it
is still
possible that either lagged or future values do have a significant
effect. Significant lead values would indicate that traders anticipate
the devaluation and adjust trade flows accordingly. Significant lagged
values would be consistent with the position of J-curve proponents
that it takes
time for traders to adjust fi~lly to the effects of devalua-
tion.
The test is performed by constraining the exchange-rate coefficient
to be the same in all countries,
but allowing all other coefficients
including constants to differ. Again the F-test is used to test the null
hypothesis that the exchange-rate coefficient is the same in all coun-
tries.
The trade balance equation with exchange-rate lags and leads con-
tains eight countries. Iceland, Ireland, New
Zealand, Guyana, Israel,
and Sri Lanka have been eliminated from the sample. The F-statistic
for the constraint is F(7,128)
=
0.7423, which cannot be rejected at
even the 90 percent level. The coefficients and t-statistics for the
lagged, lead, and contemporaneous exchange-rate terms are given
for the time periods from 2 years prior to devaluation until 2 years
after: -2
=
I55 (.43);
-
1
=
.018 (.07); 0
=
I41 (.73); 1
=
.372
(1.22); and 2
=
061 (.25). The time period zero is the year of
devaluation, while the negative numbers refer to leads and the posi-
tive ones lags. Notice that none of the coefficients is significant at even
6
16
JOURNAL
OF
POLITICAL ECONOMY
the 80 percent level (two-tailed test). Thus, even including leads and
lags does not provide evidence of a positive effect of devaluation on
the trade balance.
The results for the balance of payments, however, are quite differ-
ent. The balance of payments equation contains 10 countries. Iceland,
Ireland, Guyana, and Israel are excluded from the sample. The
F-statistic for the constraint
is
F(9,160)
=
0.8251, which cannot be
rejected at even the 90 percent level. The values of the coefficients and
t-statistics for time periods
-2
to
2
are
-2
=
301 (1.50);
-
1
=
227 (1.37); 0
=
.053 (.37); 1
=
,311 (1.62); and
2
=
398 (2.51).
The two lead terms are both significant at the 80 percent level (two-
tailed test), the first lag term is significant at about the 90 percent
level, and the second lag term is significant at the 99 percent level.
Only the contemporaneous tern1 is insignificant. The negative signs of
the lead terms indicate outflows of rnoney as individuals anticipate the
devaluation. The positive coefficient of the first lag term indicates an
improvement in the balance of payments in the year following de-
valuation. The negative sign of the second lag, however, indicates that
the balance of payments then moves toward its old level. In fact, if the
coefficients of the contemporaneous and two lag terms are summed,
they equal 034, which is very close to zero.
Therefore, including lag and lead exchange-rate terms in the bal-
ance of payments equation provides evidence of an improvement in
the account. As in the residuals test, the improvement is consistent
with the predictions of the monetary approach that devaluation will
produce a stock adjustment of the money supply. On the other hand,
there continues to be no evidence of devaluation producing even a
temporary improvement in the trade balance.
IV.
Summary
and Conclusion
While the preceding tests imply informatior1 about the effects of
several variables, this section will be confined primarily to the impli-
cations about devaluation. This article began with a summary of
previous empirical observations about the effects of devaluation.
These authors all based their conclusions on the raw account figures,
making no attempt to standardize for other variables that rnay affect
the accounts. Where this present study departs frorn the previous
ones is by incorporating exogenous variables other than devaluation
into the analysis. The effects of devaluation are then analjzed after
standardizing for government monetary ancl consumptiorl policies, as
well as growth rates.
The effects of devaluation are explored through several statistical
techniques. Testing the exchange rate directly through
seeminglv
617
THE
EFFECTS
OF DEVALUATION
unrelated regressions provides no overwhelming evidence of an im-
provement in either account. Examining the residuals of the equation
without the exchange rate, however, provides a different result. The
residuals indicate a small improvement in the trade balance in the
year following devaluation. But this improvement is small compared
with the deterioration of the trade balance in the year of devaluation
or succeeding years. On the other hand, there is clear evidence of the
balance of payments improving following devaluation. This pattern
of contrasting behavior is reinforced by the succeeding tests. Pooling
the data across time and countries does not create a significant
exchange-rate coefficient for the trade balance, but it does create
a significant positive coefficient for the balance of payments. Finally,
constraining only the exchange-rate coefficient across countries and
introducing lead and lag values further reinforces the pattern.
Neither the
two leads, the contemporaneous term, nor the two lags of
the exchange rate are significant for the trade balance. The balance of
payments, however, has a clear, significant pattern, worsening in the
years preceding devaluation and then improving in the year following
devaluation. The improvement is a temporary stock adjustment,
lasting about
2
years.
These results have at least two implications. First, they generally
support the position of Laffer
(1976)
and Salant
(1976)
that devalua-
tion does not improve the trade balance but improves the balance of
payments. There is evidence of Cooper's
(1971a,
1971b)
impact
effect, but it shows
why
Cooper's results can be misleading. The
residuals of the trade balance equations excluding the exchange rate
are on average positive in the year following devaluation. In isolation
this result implies that the trade balance "improves." But the positive
residuals in that year are smaller in magnitude than the negative
residuals of the year of devaluation. In other words, the improvement
is not sufficient to offset the initial worsening and there is no short-
run net improvement. Since the residuals in the next
2
years are also
negative on average, there is no long-run improvement either. Simi-
larly, where lagged and lead values of the exchange rate are intro-
duced, the first lagged term has a positive sign. But the coefficient is
not significantly different from zero. which allows rejection of the
hypothesis of a significant positive effect. Thus, while Cooper may
have correctly noted the direction of change in the trade balance
following devaluation, he fails to measure the significance of the
change or to note that it is only during this period that positive
changes tend to occur.
The second implication is the essentially monetary nature of the
adjustment to devaluation. While many have suggested that devalua-
tion will be accompanied by changes in real variables such as the trade
618
JOURNAL
OF
POLITICAL
ECONOMY
balance, the present tests can find little evidence of such changes. In
particular. the behavior of the trade balance, combined with the tests
on the monetary variable, provide little evidence of a real balance
effect affecting trade. This result can be explained either
by
the
assumption that fiat money is not perceived as net wealth, that nomi-
nal money balances are only a small fraction of total wealth, or that
there are only small reactions to changes in the value of monetary
wealth. In any case, since devaluation does not improve the trade
balance but improves the balance of payments, by definition the
capital account must be improving. Devaluation therefore seems to
cause
only a simple portfolio adjustment. Rather than affecting the
size of the portfolio, and thus net wealth, devaluation causes a simple
excess demand for money and excess supply of bonds. The ratio of
money to bond holdings is then returned to its desired level through a
capital account-balance of payments surplus.
Appendix
Uuta soul-ces All data are yearly observations frorn the International Finan-
cial Statistics taDes of the International Monetarv Fund. The exact line num-
bers of the variables appear in each of the following variable descriptions.
Trade ba1ante In each country the trade balance is measured as the dif-
ference between f.o.b, exports of goods and c.i.f. imports. In most countries
the domestic currency values (lines 70 and 71) are used. But due to data
l~mitationsthe dollar values of these variables (lines 7D0 and
7D1)
are used in
Spain and Ecuador.
Income and
grozuth rates The GNP variable used to compute ratios is the
nominal GNP of the 5pecific country measured in domestic currenc) (line
99a). The growth rate of the country is computed by taking the change in the
natural loearithm of this number.
0
Balarzca ofpajments The official settlements definition is used to measure
the balance of payments. The annual change in the level of international
reserves (line
1)
is computed, and the annual allocation of SDRs to the
country (line
78W)
is then subtracted.
:Zlonqr The money-supply variable is the average level of high-powered
money, where any changes occur from actions of the domestic central bank.
To the level of currency outside banks and bank reserves (lines 14a and 20) at
the beginning of' the year are added one-half the annual change in these
numbers minus the annual balance of payments. The only exception is in the
United
Kingdom, where the level of high-powered money is measured by
claims on government and discount houses (lines 12a and 12c).
Government consurnptior~ This variable is measured directly as line
91F.
Exchange rate This is the end-of-period value (line A). This value is then
taken as a fraction of a weighted average of exchange rates in the rest of the
world. The first difference of this fraction is used in the estimation.
Constructing
ratios The trade balance, balance of payments, money, and
government-consumution variables are taken as a fraction of
GNP.
A
similar
"
fraction for the rest of the world is subtracted from the money, government-
consumption, and growth-rate variables. The rest-of-world variables are con-
619
THE EFFECTS OF DEVALUATION
structed using a nominal GNP-weighted average of the variable in vari-
ous countries. The countries used in the sample are the United States, the
United Kingdom, Austria, Denmark, France, Germany, Italy, the Nether-
lands, Sweden, Switzerland, Canada, Japan, Finland, and Spain. Not every
country is included in each rest-of-world variable due to data limitations in
some countries. For example, the growth-rate variable for the rest of the
world is a weighted average of the growth rates of all the above countries
except Spain and Sweden. The monetary variable excludes Italy and
SH'
'itzer-
land. The final variables used in the equations are the first differences of the
trade balance and balance of payments ratios and the first differences of the
difference between the domestic and foreign ratios for the other variables.
References
Alexander, Sidney
S.
"The Effects of a Devaluation on a Trade Balance."
1.1M.F. Staff Papers
2, no. 2 (April 1952): 263-78.
Connolly, Michael, and Taylor, Dean. "Devaluation in Less Developed
Countries." Prepared for a conference on devaluation sponsored by the
Board of Governors, Federal Reserve System, Washington, December
14-15, 1972.
Cooper, Richard
N.
"An Assessment of Currency Devaluation in Developing
Countries." In
Gozlernment and Economic Development,
edited by Gustav
Ranis. New Haven, Conn.: Yale Univ. Press (for Yale Univ., Econ. Growth
Center), 1971.
(a)
.
Currency Dezialuation in D~zleloping Countries.
Essays in International
Finance, no. 86. Princeton, N.J.: Princeton Univ., Internat. Finance Sec.,
1971.
(b)
Dornbusch, Rudiger. "Currency Depreciation, Hoarding and Relative
Prices."/.P.E. 8
1,
no.
4
(JulyIAugust 1973): 893-9 15.
(a)
.
"Devaluation, Money, and Nontraded Goods."
A.E.R.
63, no. 5
(December 1973): 871-80. (b)
.
"A Portfolio Balance Model of the Open Economy."
J.
Monetaq
Ecorl.
1 (January 1975): 3-20.
Fama, Eugene F.: Fisher, Lawrence; Jensen, Michael C.; and Roll, Richard.
"The Adjustment of Stock Prices to New Information."
Internat. Econ. Rev.
10, no.
1
(February 1969): 1-21.
Frenkel, Jacob A,, and Rodriguez, Carlos. "Portfolio Equilibrium and the
Balance of Payments: A Monetary Approach." A.E.R. 65, no.
4
(Sep-
tember 1975): 674-88.
Johnson, Harry G. "Towards a General Theory of the Balance of Payments."
In
International Trade and Econonlic Growth: Studies in Pure Theoq.
Cam-
bridge, Mass.: Harvard Univ. Press, 1967.
.
"The Monetary Approach to Balance-of-Payments Theory."
J.
Finan-
cial and Quantitative Analysis
7 (March 1972): 1355-7 1.
Kmenta, Jan.
Elemerats of Econometrics.
New York: Macmillan, 197 1.
Laffer, Arthur B. "An Anti-Traditional Theorv of the Balance-of-Payments
under Fixed Exchange Rates."
~imeo~ra~hed.
Univ. Chicago, ~ebruar~
1969.
.
"The Economic Consequences of Devaluation of a Reserve Currency
Country." Mimeographed. Univ. Chicago, May 1974.
.
"The Trade Balance and Economic Activity." Mimeographed. Univ.
Chicago, May 1975.
620
JOURNAL
OF
POLITICAL
ECOSOMY
.
"Exchange Rates, the Terms of Trade, and the Trade Balance." In
Effects of Exchange Rate Adjustments.
Washington: Treasury Dept., OAS1.4
Res., 1976.
Laffer, Arthur B., and Miles, Marc A.
Interrlational
economic.^
in an Integrated
fl'orld.
Santa Monica, Calif.: Goodyear, 1980, in press.
Laffer, Arthur B., and Ranson,
R.
David. "Canada, the United States and the
Rest
of
the Developed World: A Study in the Integration of Markets." In
Policg Formation
in
Canada,
edited by R. A. Mundell and B. E. Van Snellen-
berg. M:aterloo: Univ. Waterloo, Ontario, 1975.
hfetrler, Lloyd. "The Theorv of' International Trade." In
A
Suwev of Corztem-
pornry Economzcs,
edited by Howard S. Ellis. Vol.
1.
philadelphi;: ~lakiston,
1948.
Miles, Marc A. "A Quarterly Model of the
U.S.
Merchandise Trade Balance:
Theory and Evidence." Mimeographed. Rutgers Univ., 1977.
.
Dezjalz~ation, the Trade Balance, and th~ Balalzce of Paywzents.
New York:
Marcel Dekker, 1978.
blundell, Robert
A.
International Economics.
New York: Macmillan, 1968.
.
Monetary Theory: Irlflation, Interest, and Growth irz
the
World Economny.
Pacific Palisades, Calif.: Goodyear,
197
1.
Robinson, Joan. "The Foreign Exchanges." In
Essa~s in the Theory
of
Eazploy-
ment.
Oxford: Black\vell, 1947.
Salant, Michael. "Devaluations Improve the Balance of Payments Even If Not
the Trade Balance." In
Efects
of
Exchange Rate Adjustments.
Washington:
Treasury Dept., OASIA Res., 1976.
Zellner, Arnold. "An Efficient Method of Estimating Seemingly Unrelated
Regressions and Tests of Aggregation Bias."
,/.
American Stafis. Assoc.
57
(June 1962):
348-68.