Graph practice phần 4 pps
Bạn đang xem bản rút gọn của tài liệu. Xem và tải ngay bản đầy đủ của tài liệu tại đây (66.04 KB, 12 trang )
050100150200250300350400
January
February
March
April
Amount of candies/dollars
Allowance [dollars ]
Number of candies
The distribution of candies over the
4 months
period
Lollipop
20%
Jelly
10%
Tim-Tum
30%
Strawberry
40%
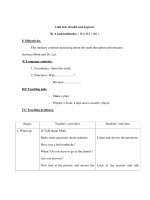
Timmy has a very nice and generous grandmother. Every month, she gave little
Timmy candies and allowance. The following chart describes the distribution of
grandmother’s gifts to Timmy for a period of 4 months.
The chart should be attached here.
1. What is the average amount of candies that Timmy got each month?
A. 75.
B. 100.
C. 125.
D. 150.
E. 200.
The best answer is D.
Familiar you’re self with the chart.
You can see that the right bars are those of candies, add them up and divide by the
number of months. The sum of the candies is 600 and therefore the average is 150
candies per month.
2. What is the average amount of money that Timmy got each month?
A. 75.
B. 100.
C. 125.
D. 150.
E. 200.
The best answer is B.
Familiar you’re self with the chart.
You can see that the left bars are those of allowance in dollars, add them up and
divide by the number of months. The sum of the money is 400 and therefore the
average is 100 dollars per month.
3. On the first month that the number of candies increased relative to the previous
month, what was the ratio between the candies and the money?
A. 2:1.
B. 2:3.
C. 3:2.
D. 1:1.
E. 6:7.
The best answer D.
You can easily see that on the first two months the number of candies stayed the same
and on March it increased and thus the question is about March.
The ratio between the number of candies to the amount of money that month is
175:175 or 1:1.
4. On the month with the largest amount of money given to Timmy, what percent of
the total are the candies?
A. 25%.
B. 50%.
C. 66%.
D. 75%.
E. There isn’t enough data.
The best answer is B.
The month with the biggest allowance is March. That month Timmy received 175
candies out of 350 in total, which is 50%.
5. How many strawberry candies did Timmy receive over the 4 months period?
A. 150.
B. 240.
C. 350.
D. 400.
E. There isn’t enough data.
The best answer is B.
We know that Timmy received 600 candies during the 4-month period (adding the
bars). We also know that 40% of the candies during that period were strawberry
candies and therefore 40% of 600 are 240 candies.
6. If up to March (inclusive), Timmy got 160 Tim-Tums’s candies, how much did he
get on April?
A. 5.
B. 15.
C. 20.
D. 30.
E. There isn’t enough data.
The best answer is C.
During the 4 months period Timmy got 600 candies. 30% of those candies were Tim-
Tums’s, which are 180 candies. If in the first three months he received 160 Tim-
Tums’s then on the fourth month (April) he must have gotten 20.
7. If in the first two month Timmy received 120 Lollipops, how many did he receive
in April?
A. 0.
B. 10.
C. 15.
D. 20.
E. There isn’t enough data.
The best answer is A.
During the 4 months period Timmy got 600 candies. 20% of those candies were
Lollipops, which is 120 candies. By the data in the question we can conclude that he
received all of his Lollipops in the first two month and therefore he received none on
March and April. The answer must be zero candies.
8. How many Jelly Candies did Timmy receive during February?
A. 10.
B. 20.
C. 35.
D. 80.
E. There isn’t enough data.
The best answer is E.
We know that Timmy received (600 x 10% = 60) Jelly candies during the entire 4
months period but we don’t know how they divide among the months.
There isn’t enough data to determine the answer.
9. What percent are the Jelly candies out of the total amount of gifts that Timmy
received during the entire period?
A. 1%.
B. 6%.
C. 10%.
D. 12%.
E. There isn’t enough data.
The best answer is B.
We know that Timmy received (600 x 10% = 60) Jelly candies during the entire 4
months period. Sum up the entire gifts, there are 600 candies and 400 dollars, 1000
altogether. 60 out of 1000 are 6%.
10. If Timmy didn’t receive any Lollipops on the last two months, how many
Lollipops did he receive on January?
A. 60.
B. 100.
C. 120.
D. 240.
E. There isn’t enough data.
The best answer is E.
During the 4 months period Timmy got 600 candies. 20% of those candies were
Lollipops, which is 120 candies. Therefore he received all of them during January and
February, but we don’t know how many he received on January alone.
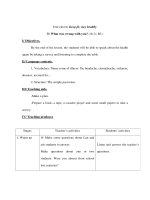
Perception of specific income
The following chart presents the average perception of the personal income status.
Perception of specific income
0
20
40
60
80
100
120
Low incomeAverage
income
High incomevery high
income
Percent
Spare money
Just right
Not enough
1. What percent of the average income population perceive themselves have just
enough money?
A. 5%.
B. 15%.
C. 25%.
D. 35%.
E. 70%.
The best answer is C.
Familiar you’re self with the bar graph.
Go the second bar from the right and find out what percent of this population are
satisfied with their income and think they just enough money. The answer would be
approximately 25%.
2. The members of which of the four groups have the wrong perception of their
income in a way that they can be presumed to be greedy?
A. Low income.
B. Average income.
C. High income.
D. Very high income.
E. There isn’t enough data.
The best answer is D.
As you go over the chart, you’ll notice a pattern: the more you make, the more
satisfied you are. We can see that the population, which earns a very high income, is
not satisfied with their income. This may come as a surprise in a way that it breaks the
previous pattern and so these are the exceptional.
3. If 50% of the low income population start to earn more money and move to the
average income population, what would be the percent of people in that category who
perceive themselves to have spare money?
A. 5%.
B. 10%.
C. 18%.
D. 25%.
E. There isn’t enough data.
The best answer is E.
We don’t know the amount of people in each group and therefore when people change
groups we don’t know anything anymore about those groups with out sufficient
information. For example, the average income population could contain 1 million
people while the low-income population could include only 7,000 people.
4. In the group with the largest percent of people who perceive to have just enough
money, what is the ratio between the people who perceive to have spare money to
those who perceive themselves to have a lack in money?
A. 1:2.
B. 3:2.
C. 4:1.
D. 2:3.
E. 1:4.
The best answer is E.
Look at the chart and look for the biggest “diagonal lines” bar (just right bar), you
will find it in the high-income population.
In that same group there are 10% people with spare money and 40% with not enough
and therefore the ratio is 10:40 or 1:4.
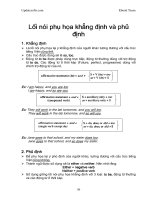
The following chart describes the average working hours of people in different age
groups. The horizontal lines represent the minimum criteria of hours per week in
order to receive a certain privilege. For example, all the employees that work at least
12.5 hours a week receive a holiday bonus.
1. Which of the following age groups are most likely to receive a free cellular phone?
A. Less than 14.
B. 22-26.
C. 21-23.
D. Over 50 years of age.
E. Answers B, C and D are correct.
The best answer is E.
We can see that all the employees who work at least 27 hours are titled to receive a
free cellular phone, that would include ages 18 and up, which makes answer E the
best answer.
2. An employee’s “Bonus free hours” are defined to be the total hours needed in order
to be entitled for a certain bonus minus the expected working hours per week of its
age group. What is the “Bonus free hours” of a 22 years old employee relative to the
free cellular bonus?
A. 8.
B. 5.
C. –8.
D. –5.
Hours of average woking time per week Vs.
Age group
0
10
20
30
40
50
60
Less
than
14
14-1616-1818-2020-2424-3030-40
and
over
Ages
Hours of work
Holiday Bonus
12.5 hours
Company Car
48 hours
Executive Monthly
Bonus. 38 hours
Free Cellular
phone
E. 22.5.
The best answer is C.
As defined in the question, the “Bonus free hours” of an employee who is 22 years of
age is 27 (the level of the bonus) minus 35 (the expected working time per week),
which is –8, thus answer C is good.
3. What is the ratio between the sums of the expected working hours of employees
who are entitled to receive at least 3 bonuses to those who are entitled to only one?
A. 99:92.
B. 63:92.
C. 92:63.
D. 92:99.
E. 92:191.
The best answer is D.
Sum up the hours of all the age groups who cross at least three lines (30-40, 24-30);
the sum is 92 hours. Do the same to all the groups who are over one line, which
includes all the groups except for the first one. The second sum includes the first one
in it and its 191 hours. The ratio is 92:191.
You could have answered right away with out the chart since you know that the
second sum should include the first one and much more hours.
4. If employees under the age of 20 receive 8 dollars per hour and employees over
that age receive 50% more, what is the ratio between the weekly-expected salary of
two employees, 18 years old and 26 years old?
A. 4:3.
B. 3:4.
C. 7:15.
D. 15:7.
E. 6:11.
The best answer is C.
The expected weekly salary of a 18 years old employee is 28 hours times 8 dollars per
hour, which is 224 dollars while a 26 years old employee makes (1.5 x 8 = 12) 40
hours times 12, which is 480 dollars per week.
The ratio is 224:480 or 7:15.
Consumption of water in the suburbs of St. Louis
0
100
200
300
400
500
600
700
800
900
1000
19911992199319941995199619971998
Consumtion
Winter time
Summer time
1. What is the ratio between the water consumption during the winter of 1994 to the
summer of 1998?
A. 25:92.
B. 4:9.
C. 13:72.
D. 1:5.
E. 3:2.
The best answer is A.
Familiar you’re self with the graph. You can see that during the winter of 1994 250
mega-liters of water were consumed and during the summer of 1998 approx. 920
mega-liters of water were consumed and therefore the ratio is 250:920 or 25:92.
2. In which of the following years, was the ratio between the winter consumption to
the summer consumption the closest?
A. 1991.
B. 1993.
C. 1996.
D. 1997.
E. 1998.
The best answer is C.
There is no escape from it, find out approximately all the ratios.
A. 80 to 420 or 4 to 21.
B. 110 to 500 or 55 to 250.
C. 300 to 520 or 15 to 26.
D. 280 to 560 or 1:2.
E. 510 to 920 or 51 to 92.
C and E are the closest, which one is the answer. Let’s see which fraction is bigger:
92*26
1326
92*26
26*51
92
51
92*26
1380
92*26
92*15
26
15
The closer ratio is C since the numerator is bigger.
3. In which of the following years was the greatest increase in consumption between
the winter to the summer? (In percent terms).
A. 1991.
B. 1993.
C. 1995.
D. 1996.
E. 1998.
The best answer is A.
The greatest increase should be measured in percent relative to the winter of a certain
year. Check the percent increase of each of the years.
1991- From 80 to 420, more than 400% increase.
1993- From 110 to 500, more than 350% increase.
1995- From 150 to 440, a little less than 200% increase.
1996- From 300 to 520, less than a 100% increase.
1998- From 510 to 920, less than a 100% increase.
We can see that the largest increase was during 1991.
4. If one mega-liter of water cost 30$ in 1995, approximately how much would the
entire water consumption of 1998 cost assuming that there was an increase of 50% in
the cost of water between 1995 and 1998?
A. $32,000.
B. $45,000.
C. $50,000.
D. $64,000.
E. $80,000.
The best answer is D.
The cost of mega-liter of water in 1998 is (30 x 1.5 = $45).
(920 + 510 = 1430 mega-liters) of water were consumed in 1998.
(1430 x 45 = $64,350) is the entire cost of water in 1998 and therefore answer D is the
closest and the only one in the nearby region.
Recruitment for a large catering company
05101520253035
cooks
hosts
waiters
bartenders
Number of new employees
Female
Male
1. In the profession where the least number of new female employees are being
recruited, what is the ratio between the male recruitments to the female recruitments?
A. 4:3.
B. 3:2.
C. 3:4.
D. 2:3.
E. 7:6.
The best answer is B.
Find the color, which represents the female recruitments, and look for the shortest
one, thus the least number of new female employees (the bartenders bar).
You can see that there are 12 male and 8 female and therefore the ratio is 3:2.
2. In which category is the ratio between the female recruitments to the male
recruitments the closest?
A. Cooks.
B. Bartenders.
C. Waiters.
D. Hosts.
E. Answers C and D.
The best answer is E.
Find the ratio for each of the categories.
Cooks- 9 to 22.
Bartenders- 8 to 12.
Waiters- 25 to 30, which is 5 to 6.
Hosts- 5 to 6.
We can see that both the waiters and the hosts have a ratio of 5:6, which is the closest
and therefore answer E is the best answer.
3. Of all the new catering company recruitments, how many more males than females
were recruited?
A. 6.
B. 8.
C. 11.
D. 15.
E. 22.
The best answer is C.
Sum up the male bars and the female bars and find the difference between them.
There are 64 new male and 53 female employees, thus the difference is 11 people.
4. Approximately what is the percent of new male employees that were not recruited
to a waiters and a cook’s job out of the total male and female recruitments?
A. 8%.
B. 15%.
C. 22%.
D. 32%.
E. 45%.
The best answer is B.
If the male were not recruited to a cook’s job or a waiter job, they were recruited to a
host or a bartender job, which is (5 + 12) 17 males’ employees in total.
The total number of new recruitments (female and male) is 117.
17 out of 117 are approximately 15% and therefore B is the answer.