English in the Southern United States phần 6 pdf
Bạn đang xem bản rút gọn của tài liệu. Xem và tải ngay bản đầy đủ của tài liệu tại đây (295.33 KB, 27 trang )
Vowel shifting in the southern states 127
iy
ey
e
i
ay
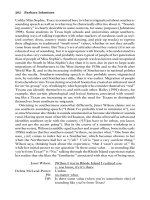
Figure 8.1 Southern Vowel Shift (Labov 1994: 209)
Moreover, Labov and his team have conducted a telephone survey of the entire
South as part of their larger Telsur project, a massive telephone surv
ey of the
United States and English-speaking Canada, resulting in the Atlas of North
American English (Labov, Ash, and Boberg, forthcoming).
Other work in which vowel shifting is only a part of wider-ranging investi-
gations include a number of
studies based on data from Texas (Thomas and
Bailey 1998; Bailey and Thomas 1998), North Carolina (Wolfram and Schilling-
Estes 1996; Schilling-Estes
1997), and Maryland (Schilling-Estes 1997), and of
African Americans (Bailey 1997b; Thomas 1997). Since the focus of these studies
is more on the
shifting of particular vowels (generally /ay/ or /aw/) or on the
direction (or existence) of their glides, these studies will enter the discussion only
marginally.
Separate mention must be made of Thomas (2001) which presents vowel
charts for 116 speakers across the South, plus thirty-three African Americans.
1
Extensive references to work connected with all these varieties accompany the
vowel charts, as well as some remarks concerning vowel shifting. Thomas’
inventory of vowels across the South undoubtedly will provide data for many
more general analyses in the future, but is not intended to address the specific
topic of vowel shifts. For that reason it will not be mentioned further with the
exception of its material on African-American vowels – the most extensive study
of African-American vowels to date.
First, Iwill discuss the place of African-American vowels in thesestudies. Then
I will present the overview of the South pro
vided by Labov et al. (forthcoming).
Next I willdiscuss Baranowski’sand Fridland’sworkin Charleston and Memphis,
and then my own work in Alabama. Lastly, I will discuss the interrelations of these
various projects, especially their differing methodologies, including selection of
speakers.
2 African-American vowel shifting
African Americans across the South, like their counterparts in the rest of the US
(Labov 1991, 2001: 506–8), show a limited influence from whites of the same
128 Crawford Feagin
community (see Bailey and Thomas (1998), and Thomas and Bailey (1998)).
Thomas’ (2001) thirty-three vowel charts from African Americans come mainly
from Texas (fourteen) and North Carolina (thirteen). In general, African
Americans avoid the sound changes observed in the white community, so it
should not be surprising that the Southern Shift is not taking place in the black
community. On the other hand, the shifting of back vowels to the front can be
observed both in Thomas’ North Carolina and Texas speakers.
Because of this distinction, none of the following studies have included African
Americans, though Fridland is currently exploring the vowels of the black com-
munity in Memphis (Fridland in progress). In her early analyses, she has found
some fronting of back vowels among her speakers (personal communication,
July, 2001).
3 The Atlas of North American English: the South
In
presenting an overview of vowels in the southern states
, Labov, Ash and
Boberg define the South linguistically as that area which monophthongizes /ay/
before v
oiced segments and in
final positio
n
– the vow
el of
sigh, sign, side. This
encompasses geographically most of the South, excluding, however, (east to west)
most of Florida except Jacksonville; Charleston, SC; most of the eastern coastal
areas; the area north of Richmond, Virginia; the area north of Charleston, West
Virginia; the area north of Lexington and Louisville, Kentucky (i.e. north of the
Ohio River); and the area north of Springfield, Missouri. Moving west, the line
excludes Tulsa and Oklahoma City, Oklahoma. It includes Amarillo, Lubbock,
and Odessa, Texas, but excludes El Paso.
Within this area, Labov et al. describe the defining features of southern speech
as found in the “active rotation of vowels termed the Southern Shift.” The
original view of the Southern Shift (Labov, Yaeger, and Steiner 1972; Labov 1991)
presented a combination of three common vowel shift patterns: the chain shift of
back vowels upwards before /r/; the fronting of back upgliding vowels; and the
chain shift of front vowels in which the long or peripheral vowels centralize and
fall, while the short vowels move toward the front and rise.
2
This last shift alone is
what is now called the Southern Shift by Labov (Labov 1994; Labov et al. 2001).
Within the South, as defined by the monophthongization of /ay/, are two
core areas, the Inland South and Inland Texas. The Inland South – defined
by the reversal of /e/
2
, /ey/, and /i/, /iy/; back gliding /oh/, in addition
to the monophthongization of /ay/ – focuses on three cities: Knoxville and
Chattanooga, Tennessee; and Birmingham, Alabama. This area extends fromeast
Tennessee to western North Carolina and northern Alabama. To a lesser extent it
includes Charlotte, NC, and Greenville, SC, and extends north to northwest West
Virginia and Kentucky, and south to Linden and Montgomery, Alabama. For
Inland Texas these features are most characteristic of Dallas, Lubbock, and
Odessa. However, it appears that large-scale immigration of Northerners to
Atlanta and Dallas may be influencing the speech there, so they may no longer
Vowel shifting in the southern states 129
share the features of their nearby core areas. (On Dallas as well as other metropoli-
tan areas in Texas, see Thomas 1997.)
The data of the Atlas come exclusively from a telephone survey (Telsur)
carried out between 1992 and 2000. The complete sample consists of almost 800
speakers, selected to represent the urbanized areas of English-speaking North
America, particularly those speakers who are the most advanced in regard to
phonological change. This has resulted in interviews with speakers from 161
urbanized areas, most with a population
of over 200,000, with a few smaller cities
selected in areas of sparse population (see Ash 2001). In the South, the speakers
number over 100, from forty-one cities. The speakers were chosen to represent
the dominant national ancestry groups of each area, with names selected from
telephone books or their website equivalent after research on national ancestry
figures from the 1990 census.
The telephone interview itself (recorded with permission) was carefully
scripted to elicit phonological contrasts or vowel shifts of interest, resulting
in up to an hour of recorded speech. Interviewers included Southerners, non-
Southerners; men and women. A letter followed with a word list; the speaker
was contacted soon after and asked to read the word list over the telephone. All
interviews were impressionistically coded for all variables elicited on mergers
and near mergers, as well as syntactic and lexical variables. The resulting phono-
logical data were then submitted to vowel analysis (using the Kay Elemetrics’
Computerized Speech Laboratory), with normalization, and added to the pool
of speakers to be charted via PLOTNIK, a vowel-plotting program.
3
This study
is likely to become highly influential, the benchmark of all subsequent work on
southern speech.
In contrast, those other studies which concentrate on single cities provide
more detail than would be possible – or desirable – in the massive Atlas. These
three quite different cities –Charleston, SC; Memphis, Tennessee; and Anniston,
Alabama, contrast sharply in history, economics, demography, and size. To begin
with, neither Charleston nor Memphis is located in core areas, linguistically.
Vowel shifting in these two places has been examined in detail by Baranowski
(2000) and Fridland (1998, 1999, 2001, in progress). A third, smaller city,
Anniston, Alabama, is located in what the Atlas calls the Inland South; this has
been the locale of my own research on vowel shifting (Feagin 1986, forthcoming.).
4 Charleston
In his study of change over time in Charleston, SC, Baranowski (2000) bases his
work on four speakers: the older speaker is a sheriff from Beaufort, SC, not far
from Charleston, interviewed by William Labov in 1965 (no age indicated, but
the man was probably born around 1905). This was a conversational sociolin-
guistic interview of the sort pioneered by Labov. The younger speakers are three
women, ages twelve, thirty-four, and forty, all interviewed in 1996 by Christine
Moisett as part of the Telsur (telephone survey) project at the University of
130 Crawford Feagin
Pennsylvania. These younger speakers, selected randomly from the urbanized
Charleston area, were interviewed by telephone in accord with the Telsur (now
Atlas of North American English) project format – continuous speech, elicited
items, and minimal-pair tests. All four recordings were analyzed using the Kay
Elemetrics’ LPC routine of the Computerized Speech Laboratory as well as being
examined by ear.
While all three women were born and raised in Charleston, the twelve-year-old
girl is a N
ative American, her father from Charleston, her mother from Canada.
The forty-year-old woman moved to Columbia, SC, after high school where she
was living at the time of the interview. Her mother was from Charleston, her
father from New York. The thirty-four-year-old was born and raised in Mount
Pleasant, a suburb of Charleston, with both parents from Charleston.
Regardless of age, none of these speakers have /ay/ monophthongization,
which has never been part of Charleston speech, setting it apart from the rest of
the South. Furthermore, the older male speaker has monophthongal or possibly
ingliding /ey/ with only a few upglides out of twenty-seven tokens; monophthon-
gal /iy/, back monophthongal /ow/, and fronted, but monophthongal /uw/ –
all characteristic of traditional Charleston speech as reported by Primer (1888),
McDavid (1955), and Kurath and McDavid (1961). In the younger female
speakers, the /ey/ and /ow/ are no longer monophthongs. Moreover, /ow/ and
/uw/ have fronted considerably, /ow/ more so than any other variety in America
today (Baranowski 2000: 29). However, in regard to the front vowels, Charleston
still does not appear to be engaged in the Southern Shift. Furthermore, there is
no laxing or monophthongization of /ay/.
Consequently, it can be said, based on these data, that Charleston has lost its
distinctiveness so far as the vowel system is concerned, but still does not share
most of the features characteristic of the South, making it a marginal southern
city, like Savannah and New Orleans, so far as its speech is concerned.
5 Memphis
Using data from twenty-five speakers from Memphis, Tennessee, Fridland (1998,
1999, 2001), has found that vowel shifting in Memphis does not follow the typical
pattern described by Labov (Labov et al. 1972; Labov 1994) for southern vowel
shifting. This should not be surprising, since, in the Atlas data, Memphis, while
southern, does not lie in the Inland South core linguistic area, and so cannot
be expected to participate in every shift found in the core area. Since Fridland
did not find certain vowel shifts, she has questioned particular aspects of vowel
shifting in the South, both the ordering of the changes and whether chain shifting
is the mechanism taking place at all here.
What she found was that while the back movements were in place, the front
shift was much less in evidence than she had expected. In fact, the only shifting
she found in the front had to do with the interchange of /e/ and /ey/, with no
evidence of change in /i/ and /iy/.
Vowel shifting in the southern states 131
Looking at the social dimension of vowel shifting in Memphis, Fridland (2001)
found that for the Southern Shift (i.e. the front vowels) mid-middle-class males
had the shift in the mid-front vowel classes /ey/ and /e/, while the mid-middle-
class women strongly disfavor it. On the other hand, lower-middle-class and
upper-working-class women tend to shift /ey/ and /e/ more than either their
male counterparts or mid-middle-class women. The only Memphis speakers
who shift /iy/ and /i/ – even slightly – are lower-middle-class and upper-
working-class males. Fridland attributes this pattern of social distribution in
regard to the front vowels to the conflict between southern rural speech norms
which represent local identity and non-local, non-southern prestige forms. Local
identity norms prove to be more attractive to the men while mid-middle-class
women tend to follow the prestige forms which are non-local. This fits in with
previous studies showing that men tend to favor less polished forms as being
more masculine, while middle-class women prefer the more elegant prestige
forms (Trudgill 1972). Fridland suggests that the lack of /iy/ or /i/ shifting
comes from an attempt to separate the Memphis region from the neighboring
southern areas where that shift occurs.
In regard to the back vowels, Fridland found that males fronted the /uw/
class much more than females, regardless of age group, suggesting that men
initiate and disseminate this shift in Memphis. It begins in the lower middle class
then spreads to the rest of the male community. Unlike the /uw/ shift, which
is led by the lower middle class, the fronting of /u/ and /ow/ is a mid-middle-
class phenomenon. While this, too, is more of a male shift, there is a greater
participation of women in the forward movement of /u/, and even more so with
/ow/.
What is interesting about Fridland’s findings is her suggestion that the front
shifts (the Southern Vowel Shift) are motivated by local identity connected with
the rural South, while the fronting of the back vowels has a different social
motivation, perhaps related to national norms.
6 Alabama vowels
In contrast to the studies of Charleston and Memphis, my own work
on change
in progress among whites in Anniston, a small city in Alabama,
not only con
firms
Labov’s earlier hypotheses, but adds time depth to detailed attention to sex and
social class differences in regard to the rate and direction of those changes. It is
interesting to note that Anniston lies in what Labov has termed the Inland South,
the core area of southern speech.
My work is based on data from twenty individuals, two per category of age,
sex, and social class. For each of those twenty people, between 100 and 150 vowels
per person were extracted from tape-recorded interviews, analyzed, and plotted,
for a total of between 2,000 and 3,000 vowels. Speakers range from the generation
born in the 1880s to the generation born in the 1950s; social backgrounds vary
from urban lawyers and bankers and their children, to rural sharecroppers and
132 Crawford Feagin
urban millworkers and their children. Distribution by gender was equal for both
age and social class; all speakers were European Americans native to the area.
The results are astounding, in that they conform in detail to Labov’s original
description of vowel change in the South. While this appeared to be the case
when I presented early results some years ago (Feagin 1985), adding a second
speaker per category as well as the local upper class confirms my own earlier
work, giving more solidity to my conclusions.
We will first devote our attention to the bac
k vowels moving to the front, then
to the chain shift in the front vowels.
7 Back vowels to the front
For all working-class speakers,
4
(iw) as in dew or tune is the highest, most fronted
vowel, across the generations. The movement of the back vowels to the front
refers to the vowels of (uw) as in boot or school and (ow) as in coat or sew. Looking
at the earlier movement of the back vowels to the front, the most conservative
system for the working class is found in a rural man born in 1881 (see figure 8.2).
Although his system is the “earliest,” his (uw) is located in the high central area,
in front of the other back vowels – (ow) and (oy) (as in boy) – so it has already
begun to move. Meanwhile
(ow) is still a back vowel, but forward of (oy).
In a
rural woman, born 1887, (uw) is slightly forward of the 1881 rural man’s; (ow) is
Figure 8.2 Anniston working-class rural man, age ninety-two (born 1881)
Vowel shifting in the southern states 133
Figure 8.3 Anniston working-class urban woman, age sixteen (born 1957)
still a back vowel. While the rural speakers show that (uw) fronting has definitely
begun in the country for speakers born after 1881, the urban working-class older
speakers have yet more fronting of (uw). Here (uw) is coming up behind (iw) and
(iy). For the urban man, born 1892, (ow) has moved forward, while for the urban
woman (born 1899) (ow) is still in the back.
Skipping forward more than fifty years, the back vowels of the working-class
urban young man (born 1955) show (uw) as in about the same location as for the
older generation, while (ow) is back, but moving toward the front. In contrast,
the most advanced speakers in regard to the movement of back vowels to the front
are two urban young women born in 1953 and 1957, roughly the same age as the
young man (see figure 8.3 for one). In both speakers, (uw) is now a high front
vowel. Similarly, both women (teenagers at the time
of their interviews) have
fronted (ow) just behind (ey) for the one bor
n in 1957. So here, the two young
women are leading the two young men, especially in regard to the fronting of (ow).
What about the local upper class? Do they share in these vowel changes? After
all, their ages are similar to the working-class speakers. As in the working class,
there is a difference of more than fifty years in the ages of the generations. In
the speakers discussed here
5
, there are two cross-generational comparisons: one
grandfather/granddaughter (figures 8.4 and 8.5), one grandmother/grandson.
Even for the upper-class man born in 1882, the movement of (uw) toward the
front can be observed (see figure 8.4). The other back vowels, however, are still
134 Crawford Feagin
Figure 8.4 Anniston upper-class urban man, age eighty-six (born 1882)
Figure 8.5 Anniston upper-class urban woman, age fifteen (born 1953)
Vowel shifting in the southern states 135
in the “normal” places. The woman born in 1890 shows (uw) as a high central
vowel, but (ow) is in a solid back position. The grandchildren’s generation has
definitely progressed in the shift. The young man (born 1956) has fronted (uw),
not far behind (iy); (ow) has moved forward, nearly to central postion. The young
woman displays yet more progression of the back shift, with (uw) just behind the
front vowels, while (ow) is behind the front vowels almost overlapping central
(
) (see figure 8.5). In general, it seems that this old shift is not
moving so rapidly
in the upper class as in the working class.
8 Front shift
Beginning with the older rural working-class man (born 1881), only the earliest
stages of the front shift can be observed, with the (ey) located just forward of
(e) (see figure 8.2). Otherwise, the front vowels are in their expected places. It is
now clear that at that time, women led change in the front vowels of the working
class. The older rural woman (born 1887) not only has completed the exchange
of (e) and (ey), but (i) has already moved behind (iy), in almost as high a position.
Meanwhile, the urban men (born 1892, 1899) are behind the urban women (both
born 1899) in this shift, with (ey) in its “normal” location. The two urban women
show interesting individual differences, though they are both “ahead” of the men
in regard to the front shift. For one, the flip flop is just beginning: (e) is forward
of, but below (ey). In contrast, the other woman has (i) below, but almost equally
fronted in regard to (iy), while (ey) is below and behind (e).
What is most remarkable here is the tremendous change over the following
fifty years. For each of the four urban working-class speakers born in the 1950s,
the front shift has gone to completion, though the resulting configuration of
vowels is more extreme for the two boys (born 1955) than for the two girls (born
1953, 1957). That is, for all four, short (i) is definitely a high front vowel; (e) is
a mid-front vowel; while (iy) and (ey) are central vowels (see figure 8.3). So, for
the boys (iy) is now behind (e), while (ey) is behind (ae). Meanwhile, for the girls
(iy) is below and behind (i), while (ey) is behind (ae).
In regard to the front shift in the upper class, no change from the “normal”
positions of (iy), (i), (ey), (e) can be observed in the older upper-class man (born
1882) (see figure 8.4). As in the working class, women are leading this change at
the early stages. One woman (born 1890) shows the movement of (ey) to the non-
peripheral track, to a slightly more central position, while (e) is in the peripheral
track, more fronted. This is only just beginning, since the (ey) and (e) almost
overlap. (i) has moved to a higher position just barely below and behind (iy). The
other woman (born 1897) shows a similar pattern.
In the grandchildren’s generation, the grandson (born 1956) of the older
woman (born 1890) shows a clear progression in the loweringand centralization of
(ey). (i) is raised to the level of (iy), but is definitely behind it. The granddaughter
(born 1953) of the older man (born 1882) and another young woman (born 1954)
are the most advanced of their social class in the front shift (see figure 8.5). For
136 Crawford Feagin
both, the (e) and (ey) have exchanged places, while the (i) is now behind (iy). In
this respect, their front vowels resemble those of working-class women born in
the 1880s and 1890s, whether urban or rural.
As one might expect, the working class is leading the upper class in regard to
vowel shifting. What is interesting, however, is that the upper class does indeed
share the shifts, though they are not as advanced as – and therefore less colorful
than – those of the working class.
9 Ordering
The ordering among the Anniston speakers appears to be the following:
For the back shift:
1. Back (uw) moves forward, followed by short (u) and (
).
2. Later, (ow) moves forward, becoming a central vowel, nearly overlapping
shifted (ey).
For the fro
nt shift:
1. Short (e) moves forward and up.
2. Long (ey) drops down and back to a central position.
3. Shor
t (i) rises to a position behind (iy).
4. Long (iy) backs and falls, leaving (i) in high front position.
The vowel charts of the men born in 1881 (figure 8.2) and 1882 (figure 8.4)
and the women born in the 1950s (figures 8.3 and 8.5) show the earliest and latest
stages of those changes by social class among the speakers I analyzed.
What is intriguing to me is that, contrary to Labov’s suggestion, there does not
appear to be any connection between the position of the vowels in (ay) and (ae)
and the front shift, nor between the parallel fronting of the back vowels and the
front shift. The peaks of (ay) and (ae) stay in approximately the same location,
regardless of the other changes going on.
The only relationship that I can determine is a possible association between
vowel breaking or gliding (as in man [
mæ
i
yən]) and the front shift. That is a very
interesting topic which warrants a separate study in its own right.
10 Comparison to Labov, Fridland, and Baranowski
Now that I have reported on my own results, where does that leave us in compari-
son to the work of Labov and his team, Fridland, and Baranowski? One advantage
I have over their work is time depth and social range in a single community.
Since the patterning of my data matches what Labov and his team have found,
both in the 1972 study and for the Atlas’s Inland South, though some of my
tentative conclusions do not, I will not discuss their work further. Instead, the
question I will address here is this: why is the vowel shifting data from Memphis,
Vowel shifting in the southern states 137
Charleston, and the Telsur project outside the Inland South so different from
my work and that of Labov, Yaeger and Steiner (1972)?
Several explanations can be offered for the differences in the various results.
First is dialect geography; a second explanation concerns methodology which
encompasses the comparability of speaking style (conversation vs. reading pas-
sages and word lists), speaker selection, and interviewer effect. A last explanation
involves the size of cities and the directionality of such changes between smaller
and larger places.
First and foremost, is dialect geography. Charleston, SC, has always prided
itself on being different from the rest of the South. The speech of the white
community has always shared Caribbean features (influenced by Gullah) which
included lack of gliding for (iy), (ey), (uw), (ow), and a glided (ay). Change over
time appears tobe eliminating some of the distinctiveness; nevertheless,the newer
phonology is not aligning itself with the rest of the South. Similarly, Memphis
differs from many places in the South because of its position on the Mississippi
River, opening it to influences both from the north and from the south. (New
Orleans is also an anomaly in its speech, so far as the South is concerned.) In
fact, neither Carver in his mapping of vocabulary nor the Labov team in their
mapping of phonology place Memphis and Birmingham (or Anniston, which
is not far from Birmingham) in the same dialect area (cf. Carver 1987; Labov
et al. 1999). So it should not be surprising that vowel shifting would pattern
differently in Memphis from what was found in Alabama and other points in the
South examined by Labov and his team.
Secondly, the material used for both the Memphis study and the Telsur work
(which formed the data base for Baranowski as well as for the Atlas) consisted
of reading passages (for Memphis) and word lists (for both), though the earlier
Charleston speaker data are conversational, as are some of the data from the
younger speakers. Such attention to language is well known to have an effect
on speech, moving the whole situation to a more formal status, and perhaps
producing less advanced vowel variants (cf. Yaeger 1975; Labov 1986; Ash 1999).
My own data were entirely from conversational interviews, often two speakers
and myself, a native speaker from the town. The Labov, Yaeger and Steiner work
(1972) was also based on conversational interviews.
Another methodological point to address concerns the question of interviewer
effect. A similar
discrepancy has appeared in the work of Nancy Niedzielski
(1997) in
regard to (ae) raising in the northern cities. She has f
ound that many
people have almost no (aeh) raising, in contrast to the results first discussed
by Labov, Yaeger and Steiner in 1972, and found in recent years by Ash to
be expanding. Malcah Yaeger-Dror (personal communication) reports that this
(ae)-raising exists in most middle-class, middle-age speakers from, say, Buffalo.
Yaeger-Dror attributes the difference between the Niedzielski results and that of
others to interviewer styles and consequently to the extent of accommodation to
the interviewer. That may also be the case in regard to Fridland’s, Baranowski’s,
and the Telsur results.
6
138 Crawford Feagin
In yet another aspect of differing methodologies, the speakers in the various
studies are not altogether comparable: two of Baranowski’s three 1990s speakers
have one parent who is not from the South. Payne (1980) has shown that the
effect of a non-native parent can reduce the ability of children to learn the local
dialect in all its complexity. In addition, one of Baranowski’s female speakers
is a Native American. In North Carolina a number of studies have shown that
Native Americans pattern differently from the rest of the community, whether
white or black (e.g. Wolfram and Dannenberg
1999; Schilling-Estes 2000b). The
background of the many Phonological Atlas speakers is mainly middle class
and middle aged in the 1990s, therefore comparable to the Anniston speakers
born in the 1950s. While Fridland gives ranges of ages and general labeling of
social class, without more detail it leaves us unable to say whether what she
calls “upper working class” is comparable to the Anniston working class, and
what she calls “lower middle class” is comparable to the Birmingham lower
middle class. Since she carried out the interviews in 1996, her “middle-aged
people” – those aged thirty-two to forty-eight – are about the same age as my
“teenage” speakers who were born in the 1950s. Understandably, she does not
have any people as old as my oldest generation. And until I analyze the data
I have gathered from Anniston speakers born in the 1970s, there is no way to
compare her results from the younger group (those under twenty-five) to mine.
So in the end, two of her speakers are roughly comparable in age to eight of
mine, the working- and upper-class younger speakers who were born in the
1950s. The rest simply don’t match up. Actually, the vowel charts of those two
Memphis speakers look very much like those of my two younger upper-class
speakers, whose vowels resemble those of the Anniston working class born in the
1890s!
Aside from questions of dialect geography and methodology, perhaps this is a
question of the directionality of change. We can guess that the Memphis speakers
are simply behind the Alabama speakers in these changes, so that the shifting of
the position of vowels in vowel space is going from smaller places to larger places.
Charleston is certainly larger than Anniston, while Memphis is a much larger
city than Anniston or even Birmingham. (It is about one and a half times the
size of Birmingham, in fact.) I would therefore speculate that these vowel shifts,
as well as vowel breaking, are changes from below – certainly below the level
of consciousness and to some extent from below in the social hierarchy. Suc
ha
change from below might include the size of cities – with smaller cities and rural
areas ranking below larger cities – as well as social class within those cities. This
certainly appears to be the case in Texas, according to Thomas (1997).
On the other hand, it is also possib
le that the diphthongization and vowel
shifts are perceived negatively as “country” or small town – or maybe just old
fashioned – so perhaps big cities such as Memphis and Atlanta, and smaller cities
such as Charleston, will continue to reject them, maintaining both lesser breaking
(diphthongization) and very moderate vowel shifts. This in fact was suggested to
me by James Sledd (personal communication 1988) in his comment that breaking
Vowel shifting in the southern states 139
(diphthongization) was more a characteristic of speakers from small towns rather
than an urban phenomenon. Informal comments of upper-class Atlanta teenage
girls concerning the speech of relatives in smaller cities in Alabama reinforce this
(Ruth and Margaret Baldwin 1985, personal communication). More recently,
Fridland (2001) suggests that the front shift might be associated with the rural
South, an evaluation which plays a part in its place in Memphis speech. Along
the same lines, Thomas (1997) shows that a contrast between metropolitan areas
in Texas (such as Dallas–Fort Worth) and smaller towns and ru
ral areas has
developed, displayed in the contrasting distribution of gliding in (ay) and in
lowering of (ey). It is, of course, a matter of speculation as to whether the greater
urban areas will dominate the development of phonology in the South, or whether
the more rural and small towns will influence the metropolitan areas. If the
South resembles other areas, it is likely that the metropolitan variety will become
dominant. However, it is not clear how much that dynamic will play out in the
South, which has managed to keep its culture separate from the rest of the nation
up to this point.
11 Conclusion
While attention to location of vowel peaks
in phonological space and the move-
ment in regard to those locations across time and space is essential, the results of
such studies present only half the story. The other equally important part is the
breaking and gliding (or diphthongization) of the vowels or their monophthon-
gization. The patterns of diphthongization in the American South are in many
ways quite distinct from such patterns in many or perhaps most other varieties
of English. (See Feagin 1996 for distinctive (ae) gliding; Thomas 2001 provides
many examples of glides across the South.) Consequently, the combination of
vowel shifting and diphthongization results in an extremely complex phonology,
marking off the region from the rest of the United States.
On the other hand, over time, the rise of cities in the South – with the cross-
currents of southern speech from various locales mixed with non-southern vari-
eties and with the social mobility which cities promote – suggests a coming homo-
genization and consolidation within the South: not an assimilatio
n to northern
patterns but the development of a modified southern speech, a koin
´
e of sorts,
with some of the distinctiveness filtered out. This is clearly what has happened
in Charleston and Memphis from the reports of Baranowski and Fridland, as
well as the more general findings of Labov et al. This, too, is what C J. Bailey
has predicted (1996: 259) – that a mixture of several varieties of a language will
generally produce leveling, an outcome confirmed in work of Kerswill (Kerswill
1994; Kerswill and Williams 2000) in both Norway and England, and in the
research of Trudgill (Trudgill et al. 1998) in New Zealand. This indeed seems
to be the direction in which Southern States English is headed, with its growing
metropolitan centers. Such a development, however, has yet to be fully realized,
but should provide plentiful material for future research.
140 Crawford Feagin
Notes
1. The 116 Southerners are distributed as follows: 36 from the Southeast (Maryland
1, Virginia 4, South Carolina 1, Georgia 1, Alabama 4, Tennessee 1, North Carolina
24), 47 from the south central states (New Orleans 1, Arkansas 1, Oklahoma 4, Texas
41). The thirty-three African Americans are from Texas (14), North Carolina (13),
Tennessee (2), Ohio (1), Alabama (1), Virginia (1), and Georgia (1).
2. The selection of slants (for phonemes) versus parentheses (for variables) is a theoret-
ically loaded statement concerning the nature of the item under consideration (see
Feagin 1998).
The vowels in my own da
ta are treated as variables
, not phonemes.
3. PLOTNIK, developed by William Labov in 1992, and continuously updated since
then, can be obtained through the United States Regional Survey, Linguistics
Laboratory, University of Pennsylvania, 3550 Market Street Suite 201, Philadelphia,
PA 19104.
4. Total working-class sample: twelve speakers: six men, six women. Rural speakers born
in 1881 (m), 1887 (f); 1906 (m), 1911 (f ). Urban speakers born in 1892, 1899 (m); 1899,
1899 (f ); 1955, 1955 (m);
1953, 1957 (f ). Ages mentioned
refer to age at the time of
the interview.
5. Total upper-class sample: eight speakers born in 1882 (m), 1894 (m); 1890 (f ), 1897
(f); 1955 (m), 1956 (m); 1953 (f), 1954 (f ).
6. See also the discussion in Weldon (1998: 267) concerning the different outcomes of
her interviews in the black community of rural Kershaw County, SC, as an insider
and those of the North Carolina State University team in rural North Carolina, all
outsiders and/or white.
9
Enclave dialect communities in the
South
1 Introduction
Contrary to the popular stereotype, there is great dialect diversity within the
speech folkways of the regional South. No
situation is more reflective of this
diversity than the so-called dialect enclave, in which a speech community has
been historically disco
nnected from the wider sociospatial, dominant population
groups in the region. There are a number of these situations in the Mid-Atlantic
and South, located in areas that range from the islands off
of the Atlantic coast
to the inland highland regions of Appalachia. Although such dialect situations
have always been of interest to dialectologists, their significance seems to have
heightened over the past couple of decades.
Dialect enclaves have now been considered as a primary database for the re-
construction of prominent vernacular varieties in the United States, based on
the assumption that linguistic change will be conservative and that these dialects
will remain relatively immune to changes diffusing throughout the wider pop-
ulation. Enclave varieties of English might thus provide a window into the ear-
lier structure of evolving vernacular varieties such as Appalachian Vernacular
English (Montgomery 1989b; Montgomery and Hall forthcoming) and African-
American Vernacular English (AAVE) (Poplack 1999; Poplack and Sankoff 1987;
Poplack and Tagliamonte 1989, 1991, 2000). In fact, transplant enclave commu-
nities of African Americans have provided essential spoken-language evidence for
revising the historical reconstruction of AAVE over the past couple of decades.
Another reason for the recent interest in dialect enclaves is related to the
moribund status of some of these varieties. In some cases, historically isolated
communities have been undergoing rapid economic and social transformation
due to the changing demographics of American society and the increased ac-
cessibility of these communities to outsiders. As historical sociocultural and
linguistic traditions have been subjected to increasing external influence, the
dynamics of dialect change and maintenance in so-called endangered dialect
communities (Wolfram and Schilling-Estes 1995; Schilling-Estes and Wolfram
1999) has come under greater scrutiny. Accordingly, there has been increasing
141
142 Walt Wolfram
concern for documenting the traditional form of these dialects before they are
lost, or at least restructured to accommodate more recent language influences.
In the following sections, I describe some of the dialect traits of enclave dialect
communities by surveying some representative situations in the eastern region of
the Mid-Atlantic and southeastern United States in order to examine the histor-
ical dialect base, or founder effect (Mufwene 1996b) that provided input into the
early establishment of these dialect communities, the historical language-contact
situations that helped define them, and the independent language development
that has taken place within these communities over time. Before doing so, how-
ever, it is necessary to examine the notion enclave dialect as a sociolinguistic
construct, since it has sometimes been used in imprecise and inconsistent ways
in the sociolinguistic literature (Montgomery 2000b).
2 The sociolinguistic construction of dialect enclaves
Although practically all studies of enclave dialect situations provide the spe-
cific details of historical
settlement, migration, and development that have led to
the disconnection of particular communities from more widespread, dominant
populations, few have attempted to propose a general set of physical, demo-
graphic, historical, sociocultural, and sociolinguistic conditions associated with
such communities. On the one hand, it might be assumed that the circumstances
defining these situations are self-evident and that there is no need to describe the
general attributes of a dialect enclave. On the other hand, it might be assumed
that each situation is so particularized that, in fact, there are no common condi-
tions that unite different situations. Both of these assumptions seem unjustified.
Montgomery (2000b: 45–6) points out the inconsistencies and imprecision in
the current application of the term “historical isolation” and the corresponding
delimitation of the dialect enclave community.
While often invoking the concept of isolation, linguists have yet to define
it in a way that is sociologically respectable (based on valid, measurable
criteria), or anthropologically sensitive (involving analysis of the commu-
nity on its own terms and based on community perceptions and behavior –
what is remoteness for the investigator may not be perceived as such by
residents) . . . In sum, we can see that American linguists have recognized
several types of isolation, but have done little to examine it critically or
explore its many dimensions.
In Wolfram (forthcoming) and Wolfram and Schilling-Estes (forthcoming), we
have attempted to set forth some of the physical, sociocultural, and sociopsycho-
logical attributes that are implicated in the definition of the notion of historical
isolation and dialect enclave. These may be summarized as follows:
Geographic: Geographical remoteness often plays a significant role in cases
of historical isolation and enclave dialect communities because bodies of
Enclave dialect communities in the South 143
water, mountains, and other features of the topography may serve to foster
separation and hence create communication discontinuities.
Economic: Economic self-sufficiency is necessary for a community to maintain
insular status over an extended period of time; in fact, one of the reasons that
fishing communities are implicated so often in historically isolated situations
is because of the combination of geographic location and their potential for
economic self-sufficiency.
Historical continuity: There must be sufficient time depth and historical conti-
nuity for the establishment of linguistic divergence from wider sociospatial
population groups; in many cases, residents can trace their genealogies back
to the earliest inhabitants of the area.
Migration: Although some communities may undergo considerable out-
migration at various periods in their histories, there is limited in-migration.
Some periods of in-migration may be tolerated, but sustained periods of
in-migration would typically end the insular status of the community.
Interactional: High-density, multiplex social networks (Milroy 1987) are more
likely to be found in enclave dialect communities than in larger, more densely
populated areas. However, there are a number of social network constella-
tions that may be found in such communities, from concentrations of entire
communities within a small geographic locale to the dispersion of subcom-
munities or families living in locales quite remote from other units within
the community.
Status: Enclave dialect communities are usually socially subordinate to “main-
stream” regional and national groups. Even when such groups have control
of local governing institutions and enjoy some measure of economic pros-
perity, they remain vulnerable to more powerful regional, state, and national
institutions that have ascribed them “non-mainstream” status.
Identity: Social distinctions between “insiders” and “outsiders” are endemic
to enclave communities. The local construction of “us” versus “them” often
results in indexical labeling that embodies important distinctions extending
beyond physical, social, and historical conditions per se.
Norms: Focus on community-internal social and linguistic norms often com-
petes with external norms, thus setting up sociopsychological (and often
linguistic) barriers against the encroachment of the outside world.
While it may be possible to set up an inventory of characteristic traits such as
those identified here, there are many qualifications that need to be made about
these attributes. It thus seems theoretically and methodologically questionable to
establish an invariant set of physical, social, and psychological attributes char-
acterizing an enclave community. As observe
d in Wolfram and Schilling-Estes
(forthcoming), particular situations represent different configurations of these
traits. Perhaps the most constant attributes are those related to identity and
norming, but they, in turn, are connected to various historical circumstances and
physical conditions. It might be possible to objectify these traits and arrive at a
144 Walt Wolfram
quantitative “index of insularity” but subjective evaluations by community mem-
bers and investigators would ultimately serve as the basis for such a quantitative
index. At its base, historical isolation and enclave speech community are socially con-
structed notions, negotiated by those within and outside the community. This
constructed identity appears to play an important role in the development and
maintenance of the community’s language, as witnessed by the fact these com-
munities may reshape and perpetuate dialect distinctiveness during less insular
periods, just as they maintain dialect distinctiveness during periods of greater
isolation. As a part of this construction, enclave communities often develop a
strong, positive sense of group identity related to the phenomenological no-
tion of “place.” Johnstone (forthcoming) notes, “Identification with a region is
identification with one kind of ‘imaged community.’ ” If nothing else, all of the
communities that we include here have a strong sense of localized place that
has at various points in their history been symbolically manifested in dialect
traits.
It is also essential to recognize that insularity is a relative notion and that,
accordingly, the conception of an enclave community is “more of a popular –
and social science – fiction than a historical fact” (Schilling-Estes 2000b: 144).
Contact and connections pervade society, and cultures do not come in neatly
packaged, independent entities. Similarly, so-called enclave dialect communities
have linkages and interrelationships with other communities, and their interrelat-
edness is reflected in their dialect configurations. As we shall see, it is not unique
dialect structures per se that typically define enclave dialect communities, but a
constellation of structures. Very few of the dialect structures found in a given
enclave community are unique to that variety; the vast majority of structures are
found in other dialects as well, so that it is the combination of structures rather
than individual structures that sets enclave communities apart.
3 Structural traits of enclave dialects
There is a range of enclave dialect situations that might be catalogued for the
Mid-Atlantic and the southern United States, highlighting various physical
and social attributes delineated in the previous discussion. Our cur
rent stud-
ies have investigated representative island communities
on the Outer Banks
of North Carolina (Wolfram and Schilling-Estes 1995, 1997; Wolfram, Hazen,
and Schilling-Estes 1999, 2000a) and the Chesapeake Bay area of Maryland and
Virginia (Schilling-Estes 1997; Schilling-Estes and Wolfram 1999), mainland
mono-ethnic communities (Gantt 2000), bi-ethnic enclaves (Wolfram forthcom-
ing; Wolfram, Thomas, and Green 2000; Wolfram and Thomas 2002), and one
tri-ethnic situation involving Lumbee Native American Indians (Wolfram 1996;
Wolfram and Dannenberg 1999; Dannenberg 1999). Earlier investigations in-
cluded highland regions of Appalachia (Wolfram and Christian 1976) and some
of its dialect extensions (Christian, Wolfram, and Dube 1989). More current
descriptions of southern Appalachia, the Smoky Mountain region in particular,
Enclave dialect communities in the South 145
Southern Appalachia
Beech Bottom
Smoky
Mts.
Robeson
Co.
Smith Is.
Tangier Is.
Banks
Ocracoke
Outer
Hyde Co.
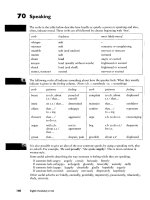
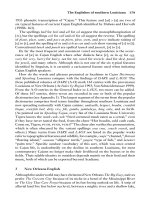
Figure 9.1 Map of representative enclave dialect communities
are found in Montgomery (1989b; Montgomery and Hall forthcoming). The
location of these communities is given in the map in figure 9.1.
These representative situations serve as the empirical basis for the compara-
tive overview and observations about the patterning of dialect maintenance and
change. Notably absent in this presentation are creole situations, such as that of
Gullah, spoken alo
ng the coastal islands of South Carolina and Georgia. These
situations involve a quite different dimension in terms of dialect
comparison and
are
deserving of descriptive attention in their own right.
In the following sections, we consider the sample of enc
lave dialect varieties
in terms of grammatical, phonological, and lexical
items. Our focus is on the
ways in which these varieties compare with each other rather than on providing a
comprehensive description of particular enclave communities as such. The goal
is to illustrate their unity and diversity and to understand the kinds of general
sociolinguistic principles that might account for their dialect maintenance and
development.
3.1 Grammatical structures
A comparison of representative enclave dialect communities indicates several
distinct types of grammatical patterning. First, there is a set of structures that
unite these dialect communities not only with each other but also with a relatively
146 Walt Wolfram
wide range of vernacular dialects. For example, most of the enclave dialect com-
munities examined here share a generalized core of structures with vernacular
dialects of English throughout the United States (Wolfram and Schilling-Estes
1998) and elsewhere (Cheshire 1991). For example,traits suchas negativeconcord
or multiple negation (e.g. They didn’t do nothing about nobody), past-tense be reg-
ularization (e.g. We was there yesterday), regularized plurals (e.g. sheeps, oxes), and
irregular-verb restructuring (e.g. past for perfect as in They had went there, par-
ticiple for past as in They seen it, or regularized past as in They knowed it), objective
demonstrative forms (e.g. them shoes), and so forth occur in socially subordinate
varieties of English wherever they are found throughout the world. A combina-
tion of linguistic and sociolinguistic principles may be invoked to account for such
cross-dialectal uniformity. Given the disfavored social status of such communi-
ties, there will be reduced social pressure to preserve socially marked, linguistic
irregularities within English, thus opening the pathway for the application of
natural principles of language change such as analogical leveling, regularization,
and rule generalization. The end result of this language change leads to parallel
dialect configurations in quite disparate vernacular dialect communities, includ-
ing historically unrelated enclave dialects and vernacular dialects in general.
Two principles seem to be operative here, the
and the
(Wolfram forthcoming). The former principle relates to the system-internal pres-
sure that preordains certain natural linguistic changes because they involve struc-
tural exceptions or patterns susceptible to structural generalization. The latter
principle relates to the social status of most enclave dialect communities, rele-
gating them to non-mainstream, marginalized subordinate sociolinguistic status.
In this asymmetrical social relationship, natural language changes taking place
within these varieties will therefore be socially disfavored and resisted by speakers
of socially favored, mainstream varieties.
A second set of grammatical structures shared by many enclave dialect com-
munities involves structural traits that were once fairly widespread in colonial
America but have since receded among broader sociospatial populations. One
might assume that communities manifesting these structural traits have simply
resisted the changes that they have undergone in other populations, reflecting
conservative language change. Such forms have often been labeled
in dialectology. For example, the use of a-prefixing in structures such as She was
a-huntin’ or They make money a-fishin’ has been documented not only in the en-
clave communities of the Mid-Atlantic and South considered in this description
but also in outlying rural contexts in New England (Kurath 1939–43) and the
midwestern United States as
well (Allen 1973–6). Further, it was widely dis-
tributed in the earlier English of the British Isles (Trudgill 1990: 80), including
Irish English. Complements such as for to as in He’s looking for to stop now or
I want for him to quit and perfective be structures such as I’m been there “I’ve been
there” or You’re lost some weight “You’ve lost some weight” also would seem to
fit into this category.
Enclave dialect communities in the South 147
While we recognize that such forms reflect the persistence of structures once
widespread throughout colonial America, thus indicating a kind of linguistic
conservatism, it is important to understand that these structures have not simply
been retained in an unmodified, static state. Enclave dialect communities may, in
fact, selectively retain and develop putative dialect structures in ways that result
in structural divergence even when the varieties are the product of a common
founder effect (Mufwene 1996b). Although such dialects may, in fact, show con-
servatism in change for some dialect structures, they may simultaneously reveal
progressive change for others, in accordance with the
(Wolfram forthcoming). For example, many enclave dialects
in English have perfective be alternating with the auxiliary have, reflecting the
fact that there was widespread fluctuation with perfective be and have well into
the seventeenth century (Ryd
´
en and Brorstr
¨
om 1987). However, while perfective
be is now relatively infrequent in most enclave dialects in the United States, the
use of perfective be remains a robust, productive form in one of the varieties ex-
amined, Lumbee Vernacular English – even among younger Lumbee speakers.
Furthermore, its development in this variety distinguishes it from other vari-
eties (Sabban 1984; Kallen 1989; Tagliamonte 1997). Perfective be is structurally
restricted to contracted finite forms (e.g. I know I’m been here but not
∗
?Iknow
I am been here), and it has expanded semantically to apply to some simple past
constructions (e.g. I’m forgot the food yesterday). Though enclave dialects may
retain structures found in earlier stages of English, the trajectory of change and
structural composition for such items may be markedly different for particular
enclave communities.
Finally, there are regionalisms reflected in enclave dialect communities, that
is, forms that have come to typify enclave communities in a particular region
or even a single enclave community. These structures may reflect distinctive
dialect traits in the putative founder dialects for the development of English in
the United States or they may reflect the independent development of forms in
particular communities. For example, the attachment of -s to verbs co-occurring
with third-person-plural subjects, particularly if the subject is a noun (e.g. The
dogs barks) as opposed to a pronoun (e.g. They barks), can be traced to regional
patterns of distribution in the dialects of England. In colonial American English,
these patterns might have shown regional distribution as well, as groups from
particular regions of the British Isles tended to settle in particular locales within
America. For example, the concord pattern attaching -s to verbs occurring with
plural noun-phrase subjects has been attributed to varieties in northern England,
including the dialects of the Ulster Scots-Irish immigrants who were a domi-
nant popula
tion in the highland areas of Appalachia (Fischer 1989; Montgomery
1989b). The assumed regional origin of such features in the British Isles does,
however, raise important questions about the occurrence of these features in
the enclave dialects of southern and mid-Atlantic coastal dialects in the United
States, where Ulster Scots immigrants and speakers from northern England,
though certainly part of the overall mix, were not nearly as concentrated in the
148 Walt Wolfram
historical population as they were in other areas such as the highland South.
One possibility is that some of the earlier varieties of English in colonial America
diffused well beyond the areas of their original concentration. It is also possible
that some of these regional features of the British Isles may have become part of
an early American English koin
´
e that subsequently retracted into regional vari-
eties within North America. If this was the case, then the dialect features would
be expected to persist in varieties that have had no significant contact with each
other for a couple of centuries, such a
s the highland South and the southeastern
coastal islands. The question of donorship with respect to the traits of enclave
dialect communities involves not only the identification of dialect traits brought
originally from particular regions of the British Isles, but also the subsequent
development of general American English and its formative regional varieties.
The dialect traits of various settlement groups from the British Isles, the develop-
ment of an earlier general American English variety, and the subsequent regional
developments within American English must all be kept in mind in sorting out
questions of donorship in enclave dialect communities in North America.
Issues of migration and the formation of earlier regional varieties become more
apparent with respect to features showing a common regional distribution among
enclave dialects. The most prominent example of this type of regionalism in our
survey is the case of the regularization of past be to weren’t (e.g. It weren’t me; she
weren’t there) as discussed in Schilling-Estes and Wolfram (1994), Wolfram and
Sellers (1999), and Wolfram and Thomas (2002). In most vernacular varieties in
the United States, past be is regularized to was,asinWe was home or You wasn’t
there (Wolfram and Schilling-Estes 1998). However, in a subset of the dialect
communities considered here, we find an alternate pattern in which past be is
leveled to was in positive contexts (e.g. We was there) but to weren’t in negative
sentences (e.g. I weren’t home). This pattern represents a restructuring of the
two past be stems, such that was is now used as a marker of affirmative rather
than singular meaning, and the were-stem is now used as a marker of negativity
rather than plurality. Within our sample, the was/weren’t pattern is robust among
groups as geographically and culturally disparate as the European Americans
of Smith Island in the Chesapeake Bay (Schilling-Estes 1997, 2000a) and the
Lumbee Indians of the Coastal Plain of North Carolina (Wolfram and Sellers
1999). At the same time, there is little indication that the polarity-based pattern
is found to any extent among current cohort rural communities in the neighbor-
ing Coastal Plain region or enclave dialect communities in the highland South.
Perhaps even more striking is the fact that it is not generally found elsewhere in
transported dialects of English around the world (Cheshire 1991), although level-
ing to were(n’t) has been amply documented in cur
rent and past vernacular vari-
eties of English spoken in the British Isles (Cheshire 1982; Trudgill 1990; Britain
2002).
Where might this form have come from, and why is it so robust in the particular
enclave communities considered here? Although one can only speculate, it does
not seem likely that regularization to weren’t is due to a simple, direct effect
Enclave dialect communities in the South 149
from a founder dialect in the British Isles. The feature was present in some of
the varieties brought to regions of the eastern seaboard of America, including
those varieties that originally came from southwest England (Orton, Sanderson,
and Widdowson 1978). From that point, it probably developed into a regional
feature of the coastal Delmarva dialect region (Shores 2000). As people from
the Delmarva region moved to various coastal sites, including islands in the
Chesapeake and Outer Banks, the was/weren’t pattern was perhaps diffused along
the mid-Atlantic and southern coasts. Thus, an important aspect of regularization
to weren’t is its apparent development in an earlier regional variety of American
English and its subsequent diffusion to other areas through migration by speakers
who subsequently became disconnected from more broadly based populations.
A similar type of regionalism has developed with respect to the use of per-
sonal pronouns in non-attributive position, such as That’s how he made hisn and
It’s yourn. Along with this is the use of second-person-plural youns, which dis-
tinguishes the Smoky Mountain and some other southern Appalachian dialect
communities from those that have adopted the general southern y’all form for
second plural. A more specific type of grammatical regionalism is the use of
finite be (e.g. That’s how it bes, They be taken them away). This form is found only
among groups in the southeastern Coastal Plain of North and South Carolina
(Dannenberg and Wolfram 1998; Montgomery and Mishoe 1999). The region
saw a concentrated influx of Scots-English during its formative European settle-
ment period in the mid 1700s, as well as some Scots-Irish, and it may well be that
a founder effect from this input dialect heritage is responsible for this distinctive
dialect structure. Whereas one cannot be certain of its origin, there is evidence
that it is quite regionally restricted among some enclave dialect communities.
Different configurations of grammatical structures for the enclave dialect
communities considered here are summarized in table 9.1. The list is selective and
somewhat oversimplified, and does not take into account some of the quantita-
tive differences among varieties, but it does reflect the different kinds of affinities
among the representative communities. Included in the list are island communi-
ties such as those on the Outer Banks and Chesapeake Bay, highland communities
of southern Appalachia, and mainland ethnic enclave varieties that coexist with
their cohort European-American varieties, in particular, mainland coastal Hyde
County African-American speech and Lumbee Vernacular English of Robeson
County, NC. A check
indicates the presence of the structural feature and (
)
indicates infrequent or “vestigial” usage. Table 9.1 demonstrates that
enclave
dialects, like other dialects of American English, are typified for the most part
by the constellation of dialect structures rather than distinctive dialect forms.
Many of the structures are shared by vernacular dialects in general, others are
shared by other enclave dialect communities; and still others are regionally re-
stricted to a subset of enclav
e dialect communities. While there are occasional
distinctive structures for particular enclave communities, it is the differential sel-
ection processes and varying rates of change and development that account for
the major grammatical differences observed among the representative dialects.
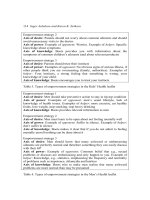
Table 9.1 Comparative dialect profile of selective grammatical variables
Mainland Mainland
Grammatical Outer Chesapeake coastal coastal Lumbee Southern
structure Banks Bay Euro. Am. African Am. English Appalachia
negative concord
e.g. We didn’t like nothing
irregular verb
(1) generalized past/part.
e.g. She had came here
(2) generalized part./past
e.g. She done it
(3) bare root as past
e.g. She give him a dog
(4) regularization
e.g. She knowed him
(5) different irregular (
)(
)
e.g. He retch up the roof
double modals
e.g. He might could come
for to complement (
)(
)
e.g. I want for to get it
was/regularization
e.g. We was there
weren’t regularization
(
)
e.g. It weren’t me
regularized plural
e.g. sheeps, oxes
a-prefixing (
)
(
)(
)
e.g. He was a-fishin’
3rd plural -s marking
e.g. The dogs barks
perfective be (
)(
)(
)(
)
(
)
e.g. I’m been there
I might be done it
measurement noun -s abs.
e.g. twenty mile
−
3rd plural -s agreement
(
)
e.g. The dogs gets upset
General plural absence
e.g. Lots of bird
Possessive -s absence
e.g. Walt hat
Copula absence
(
)
e.g. They nice, She nice
finite bes
e.g. She bes there
3rd singular absence
e.g. She like
−
cats
2nd plural youns
e.g. How youns doing?
Non-attributive -n
e.g. It’s hisn
Enclave dialect communities in the South 151
3.2 Phonological structures
The phonological structures of enclave dialect communities show the same
distribution patterns as those found for grammatical structures. As with the
grammatical features, there is a set of structures that unites these varieties with
a wide array of vernacular varieties in the United States and elsewhere because
of the operation of parallel, independent processes. Thus, the phonetic weaken-
ing of interdental fricatives such as [
ð] and [θ] to their corresponding stops in
syllable-onset position (e.g. [d
s] “this”[tn] “thin”) is a general trait of vernacular
English dialects around the world. Interdental fricatives are also quite vulnerable
to variant phonetic productions in other syllab
le positions as well, but there
is
more variation in terms of their phonetic form and their social distribution. For
example, in syllable-final position and in intervocalic position within a word, a
labiodental fricative [f ] or [v] may be used for the standard English interdentals,
as in toof for tooth, aufor for author, smoov for smooth, and brover for brother.At
the same time, a corresponding stop may also be used in some varieties, as in oder
for other or broder for brother. Similarly, the fronting of [
ŋ] to [n] in unstressed
syllables such as swimmin’ for swimming or comin’ for coming is quite widespread
in virtually all enclave dialect communities, as it is in other vernacular dialect
communities around the world. The levels of usage may be higher than those
found in other vernacular dialect settings, however, reflecting the fact that final
[n] seems to represent the retention of an earlier variant in English rather than a
contemporary process in which [
ŋ] becomes [n] in unstressed syllables.
Conservative language change in enclave dialects is reflected in the fact that
there are a number of phonological patterns found in these dialects that have
receded in the varieties spoken by wider population groups. Thus, the retention
of the initial h in (h)it and (h)ain’t appears in most of the enclave communities
surveyed here, as does the lowered production of the vowel of there or bear (closer
to that of thar and bar). The rate of change in different dialect enclaves, however,
may be quite varied. For example, some communities surveyed retain an older
backed and raised vowel nucleus in the /a
/oftide [tɑd] and time [tɑm], whereas
other varieties
have moved away from this pronunciation. For some
areas of the
Outer Banks of North Carolina, this retention has assumed iconic status, so
that speakers are referred to as hoi toiders, an approximate (but not phonetically
accurate) mimicry of their pronunciation of high tiders. In other enclave varieties,
this older pronunciation has receded completely, often being replaced by the
newer, unglided production (e.g. [a] as in [tad] for tide and [tam] for time)now
found throughout a large area of the South, or the [ai] production of tide found in
other areas of the South. Similarly, the retention of the t with final s or f in items
such as oncet, twicet, and clifft in a number of enclave communities is obviously
related to the retention of a dialect
trait transplanted from the British Isles that
has now disappeared from other varieties.
At the same time, we must recognize that enclave varieties may engage in
localized changes that intensify the use of certain traits. For example, among older