Korea in Africa: A Missing Piece of the Puzzle
Bạn đang xem bản rút gọn của tài liệu. Xem và tải ngay bản đầy đủ của tài liệu tại đây (1.61 MB, 16 trang )
51
Korea in Africa:
A Missing Piece of the Puzzle?
1
Soyeun Kim
T
he paper explores the relatively little studied Korea-Africa relations via development
cooperation in order to better appreciate Africa’s changing development landscape. It
examines various stages of Korea’s Africa strategy in the post-Korean War era in exploring
its three key motivations: achieving resource security, gaining political clout in UN voting and
promoting soft power through ‘contributive’ diplomacy. In the early days of its diplomatic
relationship with Africa, Korea received criticism for advancing a limited and short sighted
strategy aimed at securing African votes at the UN for its formal membership. Since the mid-
2000s, Seoul’s Africa policy has become more formalised and institutionalised via various
forums and initiatives. This has implications not only for the diversification of objectives of
South Korea in Africa, but also for the fast-changing landscape of development cooperation.
An analysis of both historical and recent data of South Korean Official Development A
s
sistance
(ODA), trade flows and FDI flows into Africa suggests that South Korea places a strategic
value on African resources and markets, and that a possible link exists between ODA flows
and trade priorities, especially FDI for resource development.
Korean Air launched a new route between the Seoul/Incheon and Nairobi on 21 June 2012. With flights
operating three days a week at a capacity of 253 passengers, Korean Air advertises itself as the first
airline in east Asia to run regular direct services to an African destination.
2
This bold exemplifies Korea’s
recent ‘African rush’. Yet, despite burgeoning economic and political ties between African countries
and Korea, very few studies have touched upon this emerging relationship.
Studies of Africa’s emerging partners have thus far placed a great emphasis on China. However, this
‘Sino-centric’ approach runs the risk of limiting efforts to fully understand the changes in African
development. Not surprisingly, the 2011 African Economic Outlook report highlights the importance of
other key emerging partners such as Brazil, India, Korea and Turkey, which together comprise a larger
share of many dealings (see Figure 1 and Table 1).
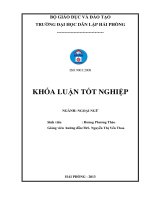
Given that Korea accounts for 7.2 percent of Africa’s total trade with emerging partners and ranks third
among these partners, what does this mean for the changing landscape of African development? How
and why do flows matter for Korea’s development cooperation with Africa, and vice versa? This paper
addresses these questions by shedding light on the motivations behind Seoul’s Africa policy, focusing
in particular on its ODA flows.
1 I am grateful for the constructive comments of Laura Savage and Kevin Gray. All errors remain my own.
2 Korean Air, ‘Korean Air to Introduce Direct Flights to Nairobi Starting June,’ 2012
/>52
Figure 1. Distribution of Africa’s total trade with emerging partners (2009, in percentage)
3
Source: Adapted from AfDB et al. (2011, 103)
Table 1. Number of African countries in which emerging partners have significant trade
(at least 10 million USD a year)
Source: Adapted from AfDB et al. (2011, 104)
3 UNDP, ‘African Economic Outlook: Africa and its Emerging Partners,’ 2011, />Africa-2011-Economic-Outlook.pdf.
Exports by Africa Imports by Africa
2000 2009 2000 2009
China 22 34 30 41
India 19 31 28 38
Korea 13 15 22 29
Brazil 11 10 12 28
Turkey 13 13 9 24
Thailand 15 14 19 25
Russia 6 13 12 15
China, 38.5%
Korea, 7.2%
Other
countries,
26.7%
Turkey, 6.5%
Brazil, 7.1%
India, 14.1%
53
Although sparse, academic literature on Korea-Africa relations (both old and new) points to three key motivations
conditioned by the post-Korean War political economy.
4
All three are closely linked to how Korea has (or has
not) balanced its national interests, international standing and sense of ‘global responsibility’ in recent years.
5
The first motivation, which largely dominates both international and Korean media, relates to economic
interests.
6
Like many other emerging actors rushing to Africa, Seoul’s aims to diversify and secure supplies of
raw materials and resource supplies, and to expand its export markets. The second motivation seeks political
influence in Africa through diplomacy. The third motivation combines the first two motivations and relates to
the more recent issue of the role of emerging actors in development cooperation. Korea promotes its global
standing and exerts its ‘soft power’ as a bridge between developing and developed countries through the
provision of ODA and as an OECD DAC member.
In exploring these motivations, the first section of this paper contextualises the recent phenomenon of Korea’s
‘Africa rush’ within its diplomatic history and position in the international political economy since the 1960s.
The second section explores the state of Korea’s development cooperation with Africa, while relating ODA
flows with other economic activities including trade and FDI.
HISTORY OF KOREA-AFRICA RELATIONS
Seoul’s relations with Africa date back to the Korean War. The two divided Koreas have since sought to win
diplomatic recognition and political legitimacy, especially vis-à-vis African countries.
7
Until quite recently, Seoul
has had a rather limited engagement with Africa that is dependent on its relationship with the major powers,
in particular with the US.
8
Various elements contributed to this limited diplomacy, including geographical
distance, insufficient availability of information and, consequently, a mutual lack of interest. In contrast to
Chinese officials’ numerous official visits to Africa, a Korean president made only one such visit in the first five
decades after the Korean War (Chun Doo-hwan in 1982). Presidential visits did not become more frequent
until recently (Roh Moo-hyun in 2006 and Lee Myung-bak in 2011).
Inter-Korean Tension and the Road to the UN membership
Seoul’s initial interest in Africa, based on its aim of political recognition, dates back to the 1960s. North
Korea’s already significant ties with many decolonised African nations spurred South Korea’s recognition
campaign.
9
In the 1970s, North Korea had 23 embassies in Africa whilst South Korea had only ten.
10
Thus,
Seoul’s motivation in the early years focused on establishing diplomatic ties to compete with North Korea.
These ties ultimately helped Seoul secure its membership in the UN.
Three consecutive presidents implemented various diplomatic strategies to this end. In 1973, President Park
Chung-hee abandoned the ‘ideological’ Hallstein Doctrine, which refused relations with any country that
recognised North Korea.
11
Park subsequently adopted a more ‘practical’ diplomatic strategy of a simultaneous
4 This is by no means an exhaustive list of literature on Korea-Africa relations.
5 Thomas Kalinowski and Hyekyung Cho, ‘Korea’s Search for a Global Role between Hard Economic Interests and Soft Power,’ European Journal of
Development Research, 24/2 (2009), 242-260.
6 In particular, Daewoo’s land deal in Madagascar. See Ryall Julian and Pflanz Mike, ‘Land Rental Deal Collapses After Backlash Against Colonialism,’ The
Telegraph, 14 January, 2009.
7 Yoon-dho Ra, ‘The Perspective of Cooperation between Korea and Africa in 1990’s,’ Africa Research, 4 (1988), 93-113.; Ui-sup Shi and Je-gyeong Park,
‘The Direction of Korea’s Foreign Policy towards Africa,’ Journal of Africa Studies Association Korea 4/2 (1989), 145-155.
8 Gyudeuk Hwang, ‘Korea’s Diplomacy towards Africa: Evaluation and Proposal,’ in Eunsook Chung, ed., Korea’s Diplomacy with Developing Countries
(Seoul: Hanwool Academy, 2009), 157-189.
9 Young-tae Chung, ‘The Stage of Inter-state Relationship Development between Korea and Africa,’ Africa Research 4 (1988), 49-72.
10 As of 2012, South Korea has 19 embassies and North Korea has ten; see
/>11 Barry K. Gills, Korea versus Korea: A Case of Contested Legitimacy (London: Routledge, 1996), 105.
54
and separate entry of North and South Korean to the UN.
12
In the early 1980s, President Chun Doo-hwan
advanced Park’s policy by promoting South-South diplomacy. Chun invited two African heads of state to
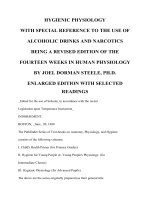
Korea to this end (Liberia and Zaire, see Figure 2). He became the first Korean head of state in history to
make a presidential visit to Africa after receiving official invitations from Nigeria, Gabon, Senegal and Kenya.
His strategy paid off as the Cold War came to an end. Seoul normalised diplomatic ties with the countries
of the former Soviet Union in 1990 and with China in 1992. President Roh Tae-woo’s strategy, touted as
‘Nordpolitik’, promoted commercial relations whilst reducing military tensions with North Korea.
13
The two
Koreas finally entered the UN together in September 1991 amidst these policy changes and diplomatic efforts.
Figure 2. Six stamps issued to commemorate the state visits to and from Africa in 1982
14
12 Ho-Young Lee, ‘Korea’s Foreign Policy toward Africa: Re-estimation and New Direction,’ The Korean Political Science Association Journal 33/3 (1999),
371-390.
13 Robert Bedeski, The Transformation of South Korea: Reform and Reconstitution in the Sixth Republic Under Roh Tae Woo, 1987-1992 (London:
Routledge, 1994).
14 Regards to the Korea Post and K-stamp for their permission to use the images of stamps in Figure 2.
Kenya
Gabon
Liberia
Nigeria
Senegal
Zaire
55
Seoul’s goal of securing formal recognition from African nations to support its entry to the UN required spontaneity
mattered as it needed to respond swiftly to the requests of African leaders in order to gain their favour.
15
This
narrow aim (alongside the various constraints mentioned above) meant that Seoul lacked a systematic and
sustainable approach to its relations with Africa. It received criticism for its limitations and short-sightedness.
Global Korea: From Resource Diplomacy to Soft Power and Global Responsibility
Seoul’s relations with Africa stagnated after it gained entry to the UN in 1991. Since that year, the number of
Korean embassies and consulates in Africa fell from 18 to 13 (8.3 percent of Korean diplomatic missions). Its
limited diplomacy began to change around the mid-2000s. Two successive administrations played a significant
role in putting Africa firmly on Seoul’s foreign policy agenda. In the Roh Moo-hyun administration, Foreign
Minster Ban Ki-moon (who later became UN Security-General) led changes to Korea’s trade and aid policies.
16
In 2006, he set in motion several prominent Korea-Africa initiatives: Roh’s official visit to Africa; the Africa
Initiative, which pledged to triple Korea’s ODA to Africa between 2006 and 2009; the launch of two Korea
Africa forums.
17
Ban’s efforts to put Africa back on Seoul’s agenda simultaneously aided his campaign for
the UNSG position. He was the first Korean foreign minister to visit Africa. Amongst the countries he visited
(Algeria, Congo, Ghana, Kenya, Liby, and Tanzania), four were then non-permanent members of the UN
Security Council.
18
Roh’s 2006 visit to Africa essentially launched Korea’s ‘resources diplomacy’. This new diplomacy followed
the ‘Asian formula’ of offering a ‘mutually beneficial’ package deal, which contrasted with the resource
diplomacy of the Lee Myung-bak administration. Key figures from the Korea Electric Power Corporation,
the Korea National Oil Corporation (KNOC) and major construction companies accompanied Roh.
19
The
visit targeted Africa’s leading economies and oil producers, including Algeria, Egypt and Nigeria, and led to
several package deals linking ODA-funded projects to resource concessions or large scale infrastructure bids.
20
For example, the KNOC-led Korean consortium’s production sharing contracts with the Nigerian National
Petroleum Corporation.
21
During the visit, Roh also announced the ‘Korea Initiative for Africa’s Development’, which set out to put
forth a comprehensive framework for Korea’s cooperation with African countries. Two items addressed in the
initiative have served as the backbone of the institutional structure of Korea-Africa relations (see Table 2): the
pledge to treble ODA to Africa, upheld by the subsequent Lee administration (see Figure 3); the initiation of
two Korea-Africa forms in 2006 — the triennial Korea-Africa Forum led by the Ministry of Foreign Affairs and
Trade (MOFAT) and the biennial Korea Africa Economic Cooperation Conference (KOAFEC) led by the Ministry
of Strategy and Finance (MOSF). The initiative thus helped to systematically formalise and institutionalise
Korea-Africa relations.
15 Ho-Young Lee, 1999. 145
16 Colum Lynch, ‘S. Korean Contender for U.N. Post Has an Edge; Ban Ki Moon’s Rivals Complain About His Role in Foreign Aid and Trade Policy,’ The
Washington Post, 29 September, 2006.
17 ‘Ban Ki-moon, Regrettable to See Lack of Interest in Korea Africa Forum,’ Yonhap News, 8 November, 2006.
18 ‘Ban Ki-moon began Election Campaign?’ Minjung-ui-sori, 14 March, 2006.; John Bolton, Surrender Is Not an Option: Defending America at the United
Nations And Abroad (New York: Threshold Editions, 2007).
19 Ministry of Foreign Affairs and Trade Korea, 2005, />&seqno=290617&c=&t=&tableName=TYPE_DATABOARD&px=&dc=&wc=&lu=&vu=&iu=&du.
20 Ui-sup Shim, ‘Korea Initiative for Africa Development,’ Journal of Africa Studies Association Korea 24, 115-140.
21 The consortium holds 60 percent share of the two off-shore deep water blocks, of which KNOC owns 43.88 percent, Korea Electric Power Corporation 8.78
percent, Daewoo Shipbuilding & Marine Engineering 5.85 percent and GT&R 1.5 percent.
56
Table 2. Selected points from the 2006 Korea Initiative for Africa’s Development
The third forum and the fourth KOAFEC deserve particular attention as they clearly highlight all three motivations
behind Seoul’s Africa strategy. The two meetings convened during the official ‘Korea-Africa Cooperation
Week’ to promote public interest in Africa and in Seoul’s cooperation with Africa.
22
This coordinated effort
by the Lee administration proved a success, and the meetings provided a useful campaign ground for the
bid to host the Green Climate Fund (GCF) secretariat in Songdo, Korea.
23
In return for African votes, Seoul
announced a $60 million comprehensive assistance plan at the KOAFEC meeting.
24
During the GCF bidding
process, Korea consistently emphasised three points. First, it highlighted its role as a bridge (mediator) between
developed and developing countries in forming a global partnership for climate change action. Second, it
promoted Korea’s own development experience and the green growth strategy — the Lee administration’s
driving initiative from the start. Third, it critiqued the geographical bias of the environment-related international
organisations, which have headquarters heavily concentrated in Europe. Korea put forward a case for an
Asian location, which contains half of world’s population.
25
Seoul’s strategy to become an active and respected player in international relations with Africa involved hosting
various important international meetings (for example, the G20, the 4
th
High Level Forum on Aid Effectiveness
and the Seoul Nuclear Summit), joining the OECD DAC and promoting an ‘aggressive’ use of ODA for business
and resource diplomacy.
26
ODA has become the key instrument for securing resources from African nations
and for strengthening ‘soft power’ by promoting the ‘Korean model of development’.
27
Moreover, it provides
important opportunities for Korea to further embed and extend its approach.
22 African Development Bank, Strengthening Partnerships for Development and Inclusive Growth, 2012,
/>23 Ministry of Strategy and Finance, White paper on hosting of Green Climate Fund (Seoul: Ministry of Strategy and Finance, 2013), 65-66.
24 Jinhyung Kim, ‘A Match between David and Goliath: The Story of Successful Hosting of GCF,’ Money Today, 20 October, 2012.
25 Ministry of Strategy and Finance, 2013, 84.
26 Hangyu Lee, ‘A Study on the Meaning of Korea-Africa Forum & President Lee’s Adminstration’s Policy toward Africa,’ Journal of Africa Studies Association
Korea 33 (2011), 43-77.
27 Tosin Sulaiman and Jon Herskovitz, ‘Africa Money: Africa Studies “Made in Korea” Model to Push Growth,’ Reuters, 19 October, 2012.
Increase the ODA volume
• tripling ODA to Africa by 2008
Sharing Korea’s development experience
• by 2009, inviting 1000 African officials for capacity building
• dispatching of Korean experts and volunteers
• assisting African governments to devise national development plans
via holding workshops
Setting up Korea-Africa cooperation fora
• establishing ‘the Korea Africa Economic Cooperation Forum’ as
a tripartite (business/ government/ academia) committee
Promoting Africa’s ownership
• Supporting NEPAD’s efforts to promote social and
economic development
57
What does Korea’s ODA to Africa look like in practice? How has Korea’s ODA to Africa developed and evolved?
Has Korea effectively implemented its pledges and policies? Answering the question requires a closer look
into the state of Korea’s development cooperation with Africa, relating the ODA flows with other economic
activities including trade and FDI.
ODA TO AFRICA IN NUMBERS
ODA is the resource flow from one government to another and thus signals the relationship between donor
and recipient countries. The political economy of both countries matters in understanding the effect of the
flows. The present section focuses on the donor side.
Korea’s ODA has increased rapidly since the early 2000s (see Figure 3). Between 2006 and2010, ODA flow
increased by an average of 29 percent each year.
28
In2011, ODA flow reached $1.32billion, a nearly six
percent increase from the previous year. Korea’s ODA to Africa in particular (both its volume and ratio) has
also steadily moved upwards since 2006.
Korea’s ODA is often referred to as a ‘two-pillar system’ as, in principle, two ministries manage ODA. The
Ministry of Foreign Affairs and Trade (MOFAT) oversees ODA grants through the Korea International Cooperation
Agency (KOICA). The Ministry of Strategy and Finance (MOSF) manages ODA loans through the Economic
Development Cooperation Fund (EDCF). The ODA system is highly fragmented both in policymaking and
delivery. The tension between the two ministries has intensified over the years over issues relating to
Figure 3. Korea’s Total ODA and ODA to Africa 1987 - 2010 (Commitment-Base)
29
28 OECD, 2012.
29 Adapted from Korea EXIM Bank. 2013. Online ODA statistics. N.B. The reason for analysing the
commitment-based data here is that it better reflects how the pledges are translated into actual decision made by Korean’ government. Actually disbursement
takes time and often gets delayed so neither gross or net disbursement is suitable here.
base)
0
200
400
600
800
1000
1200
1400
1600
1800
2000
1987 1989 1991 1993
1995 1997 1999 2001 2003 2005 2007 2009
USD Millions
0%
5%
10%
15%
20%
25%
30%
35%
40%
Total ODA
ODA to Africa ratio of ODA to Africa
58
compliance with the DAC aid norms (for example, over increasing the volume of grants and proportion
of ODA), and the idea of reforming the current system to establish a single ODA agency under the
(MOFAT-led) KOICA umbrella. Their separate arrangements for the Africa Forum demonstrates this tension.
One must thus look into both types of ODA flows (actual disbursements) separately to better understand the
nature of Korea’s engagement with Africa.
Figure 4. Grants and Loan disbursements in Africa
30
Figure 5. KOICA’s grants disbursements to Africa
31
Grants vs. Loans in Africa
Despite the media hype about the link between large scale development projects and ODA loans, Figure 4
tells a different story. Although both flows have increased steadily since 2006, the total grant disbursement
has overtaken loan disbursements.
KOICA’s grants have shown similar trends with Korea’s overall ODA flows over the years — in particular,
the sharp increase after a series of events in 2006 (see Figure 5).
30 Adapted from the OECD.StatExtracts. 2013. Aid (ODA) disbursements to countries and regions [DAC2a]. Data extracted February 27.
/>31 KOICA Online Grants Statistics, 2013, />0
20
40
60
80
100
120
1989 1991 1993 1995 1997 1999 2001 2003 2005 2007 2009 2011
ODA Loans
Grants
0
10
20
30
40
50
60
70
1991 1993 1995 1997 1999 2001 2003 2005 2007 2009 2011
USD Million
USD Million
59
In 2011, KOICA’s grants to Africa totalled $65.6 million, or 16.1 percent of Korea’s total ODA.
32
In terms of
sector expenditure, KOICA spent the largest share of its grants on education, followed by public administration,
fishery and forestry, agriculture and health (see Figure 6).
Figure 6. KOICA’s 2011 activity by sector (disbursement based)
33
KOICA’s top five recipients in 2011 — Tanzania, Ethiopia, Morocco, Kenya and Rwanda (Table 3) — accounted
for 8.4 percent of KOICA’s total disbursement and 51.8 percent of its disbursement in Africa. Asia still took
the largest share of KOICA’s activities at 45.5 percent.
Table 3. Top five KOICA recipients in Africa (disbursement based)
34
On the other hand, EDCF loan disbursements to Africa accounted for 13.1 percent of total flows in 2011.
Asia again dominated Korea’s loan assistance at 79.8 percent, but the proportion of its share surpassed that
of KOICA. Here, the business-oriented EDCF still seems to prioritise the rapidly growing Asian economies
over Africa.
32 ibid.
33 ibid.
34 KOICA, KOICA Annual Report 2011 (Seoul: KOICA, 2011).
Education
29%
Health
13%
Public Administration
25%
Agriculture, fishery
and forestry
16%
Industrial energy
11%
Emergency relief
2%
Others
4%
Table 3. Top five KOICA recipients in Africa (disbursement based)
7
Rank County Amount
USD
Ratio (%)
KOICA's total
disbursement
Total disbursement in
Africa
1 Tanzania 8,864,806 2.2 13.5
2 Ethiopia 8,079,111 2 12.3
3 Morocco 7,070,351 1.7 10.8
4 Kenya 5,152,172 1.3 7.8
5 Rwanda 4,868,599 1.2 7.4
60
Table 4. Approved ODA loan projects from 1987 to 2011 (as of December 31, 2011)
35
35 Source: Adapted from EDCF. 2013. ODA statistics. Last modified January 31. />
USD millions Project details
1987 Nigeria 10 Modernisation of railcar modernisation
1990 Ghana 13 Construction of a storage building for refined oil products
1991
Nigeria 15 Railcar modernisation
Uganda 7.5 1
st
phase project for waste water treatment system
1992 Kenya 14.4 Skill training centre construction
1994 Ghana 8 LPG container production factory construction
2000 Ghana 38.2 Buipe-Bolgatanga oil pipeline (265Km) construction
2004
Kenya 25 Road work equipment replacement
Tanzania 28 Skill training centre construction
2005
Angola 31.44 Agricultural modernisation
Equatorial Guinea 20 Bata Water Supply Project,
2006
Angola 35 Construction of National Information Processing Centre
2007
Madagascar 14.12
Toliara Province Road Rehabilitation Project of RN 35
– co-financed with AfDB
Senegal 25 Government ICT Infrastructure Project
Angola 49
Rural development for food security (chicken farming modernisation +
farmer capacity building)
Kenya 10.74 Skill training centre expansion and improvement
Tanzania 25 Construction of Malagarasi Bridge and access roads
2008
Madagascar 30 National disaster management centre construction
Mozambique 45 Construction of Quelimane General Hospital
Cameroon 35 Establishment of Vocational Training Centre
2009
Mali 21.58
Irrigation development programme Phase 1
– co-financed with AfDB
Mali 39.65 Government ICT Infrastructure Project
Mozambique 20
Rehabilitation of Nacala road corridor Phase 1
– co-financed with AfDB
Mozambique 49.08
Rural Electrification in Gaza Province
Tanzania 49.62 Improvement of Water Supply System in Dodoma Town
Tanzania 49.5 Muhimbili University hospital construction
2010
Ghana 55.5 Wa Water Supply Rehabilitation and Expansion Project
Mozambique 35 Construction of solar power station
Mozambique 25 Emergency Management Information System Project
Angola 18.5 Agricultural modernisation
Angola 34.83 Establishment of Advanced Technology Center
Angola 44.04 Public Security Innovation Project
Uganda 26.8 Education IV Project
Tanzania 36.42
IRINGA
-
SHINYANGA BACKBONE TRANSMISSION INVESTMENT
PROJECT
Tanzania 27 Muhimbili University hospital medical equipment supply project
2011
Ghana 67.23
Prestea
-
Kumasi
Transmission Enhancement Project
– linked to KOICA
Mali 25.03 Markala Sugar Project – cofinanced with AfDB
Mozambique 18.1 Education project
Ethiopia 78.4 Sululta-Gebregurach Power Transmission Project
DRC 67.91 Remba Imbu Water Project
Tanzania 50 Construction of Zanzibar Irrigation Infrastructure Project
Africa only
14 countries (Angola, Cameroon, DRC, Equatorial Guinea, Ethiopia, Ghana, Kenya,
Madagascar, Mali, Mozambique, Nigeria, Senegal, Tanzania, Uganda) and 41 projects
1318.59
total 49 countries and 277 projects 7291.15
61
The scale and speed of growth in EDCF’s loan assistance to Africa has changed in recent years. According to
loan approval data (see Table 4), between 1987 and 2006, 12 projects in seven countries received approval
with a total of $245.54 million. Between 2007 and 2011, 29 projects in 12 countries received approval with
a total of $1073.05 million — nearly four times the value of loans approved during the previous 19 years.
As Table 4 highlights, ECDF loans to Africa mainly focused on economic and social infrastructure projects.
The top five recipients of the EDCF loans included Angola, Mozambique, Ghana, Mali and Senegal (see Table 5.)
Mutually Beneficial?: Current Korea-Africa Economic Relations in Numbers
There has been much emphasis so far on the ‘mutually beneficial’ partnership between Korea and Africa.
What, then, links ODA flows to strategic business deals by the Korean private sector? This comparison does
not aim to suggest a concrete causal relationship between ODA flows and private sector engagement, but
rather to gauge a trend that may suggest a possible (and complex) relationship between governmental and
private flows. This aim is important given the recent paradigm shift from aid effectiveness to wider development
effectiveness, which includes debates ‘beyond aid’ and the utility of ‘policy coherence’
36
in the midst of aid
scepticism, financial crises and the subsequent political pressure.
37
Table 5. Accumulated total ODA loan disbursements from 1987 to 2011 (as of 31 January 2013)
38
36 Helen Clark, ‘The Future of Development Co-operation: from Aid to Coherence?’ (presentation, Belgian Development Days, Brussels, Belgium, 8 May 2012).
/>37 S. Bilal and F. Rampa, ‘Emerging Economies in Africa and the Development Effectiveness Debate,’ Discussion Paper 107, (Maastricht: ECDPM, 2011).
38 Adapted from EDCF. 2013. EDCF assistance data by country (as of 31 January 2013). Last modified January 31.
/>(as of )
Disbursement Number of
projects
KRW million (%)
Angola 146,347 3.90% 5
Mozambique 31,173 0.80% 5
Ghana 77,729 2.00% 4
Mali 13,538 0.40% 1
Senegal 55,334 1.40% 2
Tunisia 24,874 0.60% 1
Madagascar 11,071 0.30% 1
Kenya 45,708 1.20% 3
Cameroon 5,406 0.10% 1
Uganda 5,406 0.10% 1
Nigeria 18,981 0.50% 2
Tanzania 71,250 1.90% 7
Africa total 513,939 13.40% 33
World total 3,835,842 100.00% 239
62
With a nominal GDP of $1.116 trillion in 2011, South Korea is the world’s 15
th
largest economy, the seventh
largest exporter ($555 billion) of merchandise trade volume and the ninth largest importer ($524 billion).
Korea’s FDI inflow ranks 26
th
($4.661 billion) and its outflow ranks 15
th
($20.355 billion) in the world.
39
Relative
to Korea’s other global economic relations, trade with Africa remains rather small — 1.85 percent of Korea’s
total trade in 2011.
40
Still, as Figure 7 shows, Korea-Africa trade has increased rapidly since the early 2000s,
which shows similarly steady growth as ODA flows.
Figure 8. Korea Africa trade trends (1972 -2011)
41
Korea’s imports mostly resource or raw materials goods from Africa (see Figure 9).
42
Oil and gas, mineral and
metals accounted for over 80 percent of imports in 2009.
Figure 10 shows that, consistent with previous years, Korea’s major export items in 2009 mainly included
capital goods: transport vessels (59.3 percent), automobiles (6.8 percent), ethylenepropylene (4.2 percent)
and mobile phones (2.7 percent).
39 The World Bank Group, GDP Ranking Table, 2012, WTO, Prospects for 2012, 2012,
OECD, FDI in Figures, 2013, />40 KOTRA, Recent Trends in Export and Import, 2013, />41 Adapted from KOTRA. 2013. Statistics of Korea’s Trade : Export/Import. Last modified January 31.
/>42 Adapted from Korea Customs Service. 2010. Korea Africa Trade Trends. Last modified March 3.
0
1000
2000
3000
4000
5000
6000
7000
8000
9000
10000
11000
12000
13000
14000
15000
USD Million
Export to Africa
Import from Africa
63
Figure 9. Korea’s top five import destinations and major import items
43
Figure 10. Korea’s top five export destinations and major export items
44
43 Adapted from Korea Customs Service. 2010. Korea Africa Trade Trends. Last modified March 3.
and The Korea Chamber of Commerce
and Industry. 2012. Africa: Country Profile. />44 ibid.
South Africa
(minerals)
38%
Equatorial Guinea
(natural gas, oil
and woods)
22%
Zambia (copper)
11%
Nigeria (natural gas,
copper and LPG)
7%
Gabon
(oil and other metal
mineral)
6%
Others
16%
Liberia (marine
and ship structures
and ship equipment parts)
58%
South Africa (automobile
and petroleum
products)
13%
Nigeria (synthetic resins,
automobile, othre
petrochemical products)
9%
Angola (rotary electric
machinery, automobile
and cement)
4%
Kenya (synthetic resins,
other petrochemical
products and steel plate)
2%
Others
14%
64
Yet, such increases in trade do not necessarily benefit African partners due to their trade deficit with Korea
(see Table 6). Korea-Africa trade weighs heavily in favour of Korean exporters. Korea’s balance of trade with
African countries has risen consistently since 2005. Compared with the 2005 record, the trade value in 2009
increased by 28 percent (with a six percent increase in volume and a 62 percent increase in the trade surplus).
Furthermore, the trade surplus with African countries accounts for 13 percent of Korea’s total international
trade surplus.
Table 6. Korea’s trade balance with Africa (2005-2009)
45
Figure 11. Korea’s FDI to Africa
46
As shown in Figure 11, Korean business made significant investments in manufacturing in Africa in the
1990s, including Hyundai Motor’s assembly factory in Botswana ($50 million) and Daewoo Group companies
(approximately $149 million) in Sudan. Yet, both operations proved short lived as they closed by early 2000.
47
45 Adapted from Korea Customs Service. 2010. Korea Africa Trade Trends. Last modified March 3.
/>46 Adapted from Korea Exim Bank. 2012. Overseas Investment Statistics.
47 Hyundai shut down the operation in February 2000, and most of Daewoo’s operations also closed after the collapse of the Daewoo
Group in 1999 (apart from the General Medicine Company). See Ministry of Foreign Affairs and Trade Korea, Republic of Botswana, 2007,
The Embassy of Republic of Korea in Sudan, The Current Status of Korea-Sudan Investment, 26
August, 2010, />
Table 6. Korea’s trade balance with Africa (2005-2009)
13
USD
Million
Export to
Africa
% of
Korea's
total
world
trade
Import
from
Africa
% of
Korea's
total
world
trade
Trade
Balance
% of
Korea's
total
world
trade
2005 6,202 2.2 2,946 1.1 3,256 14
2006 7,729 2.4 4,372 1.4 3,357 20.9
2007 8,253 2.2 4,316 1.2 3,937 26.9
2008 9,384 2.2 4,052 0.9 5,332 N/A
2009 8,445 2.3 3,185 1 5,270 13
Figure 11. Korea’s FDI to Africa
14
0
50
100
150
200
250
300
350
400
1981
1983 1985 1987
1989
1991
1993 1995
1997
1999
2001
2003
2005
2007 2009 2011
Current Price
s
(USD millions)
FDI Total
Resource development
Manufacturing
65
Since 2005, similar to ODA flows, Korea’s FDI to Africa has dramatically increased. In particular, FDI for resource
development has risen rapidly, reflecting what Korea seeks from Africa (as demonstrated above via the major
import items). Thus, the average share of FDI for resource development against total FDI from 2001 to 2011
was 83.4 percent. Historically, Madagascar has been by far the largest recipient of Korea’s FDI for resource
development (solely in mineral resource sector including the recent investment in nickel mining), along with
Libya, Nigeria and Egypt (see Table 7 and Figure 12). Since the collapse of the Gaddafi regime, FDI to Libya
has dropped drastically. Instead, for the past few years resource development FDI to countries like Equatorial
Guinea, South Africa, and Cameroon has visibly increased.
Table 7 . Resource development FDI – accumulated from 1981-2011 (USD 1,000)
48
* - rapid increase since 2010
When comparing all four flows — ODA grants, ODA loans, trade and resource development FDI — the data
suggests a possible link between ODA flows with trade and especially resource development FDI. For example,
apart from Ethiopia and Rwanda, all three KOICA recipients are found in the flows of ODA loans (Kenya and
Tanzania), trade (Kenya) and resource FDI (Morocco, Tanzania). Nine ODA loan recipients (apart from Ghana,
Kenya, Mozambique, and Uganda) are also the destinations of resource FDI. Two (Angola and Kenya) were
export, and one (Nigeria) was import. Apart from Kenya, all major export and import destinations were major
resource FDI destinations.
African resources and market thus comprise one of the key motivations behind Korea’s strategy. This is in large
part due to Korea’s resource scarcity, which has led to heavy dependency (in particular, on energy imports
from the Middle East). Korea’s overall energy import dependency rose from 87.9 percent in 1990 to 97.2
percent in 2000 and slightly decreased to 96.2 percent in 2010. It clearly needs to diversify its supply from
the increasingly unstable Middle East region, which represents the largest source of Korea oil import
(74.3 percent in 1990, 76.8 percent in 2000 and 81.8 percent in 2010).
49
This trend drives Seoul’s emphasis
on energy and resource diplomacy.
50
48 Adapted from Korea Exim Bank. 2012. Overseas Investment Statistics. />49 Korea Energy Management Corporation, Energy and Climate Change Handbook 2011 (Seoul: KEMCO, 2011).
50 See Ho-young Lee, ‘The Change of Korea’s Foreign Policy toward Africa: Energy and Resource Diplomacy,’ Journal of International Politics 16/2 (2011),
137-163.
1 Madagascar 2039759 15 Chad 662
2 Libya 265300 16 Central African republic 627
3 Nigeria 152225 17 Senegal 431
4 Egypt 145805 18 Tanzania 389
5 Equator Guinea* 79,815 19 Angola 218
6 Côte d'Ivoire 55349 20 Gabon 152
7 Sudan 34445 21 Zimbabwe 120
8 Benin 27,398 22 Liberia 110
9 South Africa* 16705 23 Zambia 70
10 Mali 5035 24 Guinea-Bissau 69
11 Cameroon* 1484 25 DRC 66
12 Swaziland 1207 26 Congo 60
13 Morocco 1158 27 Tunisia 40
14 Ghana 824 28 Zambia 36
66
Figure 12. Top five resource development FDI destination between 2006 and 2011
51
CONCLUSION
Three key factors have motivated Korea’s Africa strategy: achieving resource security, gaining political clout
through the UN voting system and promoting soft power via contributive diplomacy.
The early years of Korea’s Africa diplomacy focused on securing formal support from African nations for
Seoul’s entry to the UN. This has changed drastically since the mid-2000s, as Africa became Seoul’s battle
ground for conducting resource diplomacy and promoting soft power by propagating a Korean model of
development. The renewed interest in Africa also provided a space to formalise and institutionalise hitherto
limited Korea-Africa relations.
Past and current ODA data, trade flows and FDI flows suggest that African resources and markets are key
to Korea’s strategy. These flows have increased sharply since the mid-2000s — and in favour of Korean
exporters. In terms of trade, Korea imports mostly oil and gas, minerals and metals, and exports high-end
capital goods like transport vessels, automobile and mobile devices.
In regard to Korea’s much heralded resource diplomacy, FDI directed at resource development in Africa has
increased rapidly since 2006. This has in large part resulted from Korea’s resource scarcity. The analysis suggests
a possible link between ODA flows and trade, especially resource development FDI. ■
51 Adapted from Korea Exim Bank. 2012. Overseas Investment Statistics.
0
25,000
50,000
75,000
100,000
125,000
150,000
175,000
200,000
225,000
250,000
275,000
300,000
2006 200
7
2008
2009 2010 2011
USD 1,000
Nigeria
Madagascar
Libya
Egypt
Côte d'Ivoire