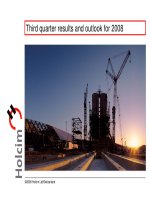
Third quarter results and outlook for 2006 holcim
Bạn đang xem bản rút gọn của tài liệu. Xem và tải ngay bản đầy đủ của tài liệu tại đây (1.8 MB, 45 trang )
Third quarter results and outlook for 2006
1
3
rd
Quarter 2006
Key facts at a glance
Higher sales in all Group regions and segments
Price increases, efficiency gains and expanded
scope of consolidation strengthen results
Higher energy costs and competitive pressure in
some markets have been largely offset
Internal and external growth produce record results
Holcim again "Leader of the Industry" in the Dow
Jones Sustainability Index 2006/07
2
3
rd
Quarter 2006
Dynamic growth in key Group markets enables
capacity expansion in cement
Million t * 2007 2008 2009 Total
Europe 1.2 1.5 2.7
North America 0.5 4.0 4.5
Latin America
Africa Middle East 1.7 0.6 2.3
Asia Pacific 5.6 3.7 9.3
Total Group 9.0 5.8 4.0 18.8
* Approved projects of Group companies; partly under construction
3
3
rd
Quarter 2006
Robust economy supports
construction industry
Encouraging order situation in
western and southeastern Europe
Europe
4
3
rd
Quarter 2006
Positions in Europe
Cement plant
Grinding plant/terminal
Aggregates
Participation:
Cement plant
1
Under construction
1
1
1
5
3
rd
Quarter 2006
Facts on Europe
Higher volumes in all segments
Cement sales rising, in particular in France, Benelux, and
southeastern Europe
Aggregate Industries UK lifts sales of aggregates and ready-
mix concrete
Group companies showed significant improvement in results
Operating EBITDA up by 16.8 percent to CHF 1.464 billion
Internal operating EBITDA growth at 9.5 percent
6
3
rd
Quarter 2006
Economic environment largely
sound
Housing construction cooling
visibly
North America
7
3
rd
Quarter 2006
Positions in North America
1
Cement plant
Grinding plant/terminal
Aggregates
1
Under construction
1
8
3
rd
Quarter 2006
Facts on North America
Slight increase in cement sales
Cement, clinker and granulated blast furnace slag again had to
be imported to cover demand
Sales of aggregates and ready-mix concrete higher thanks to
additions to the scope of consolidation
Better prices in all market regions
Operating EBITDA up by 15.1 percent to CHF 776 million
Internal operating EBITDA growth at 14.6 percent
9
3
rd
Quarter 2006
Economic upswing continues
unbroken
Housing construction robust and
infrastructure expanded further
Latin America
10
3
rd
Quarter 2006
Positions in Latin America
Cement plant
Grinding plant/terminal
Aggregates
Participation:
Cement plant
Grinding plant/terminal
11
3
rd
Quarter 2006
Facts on Latin America
Higher sales in all segments
Strong volume increases at Holcim Apasco in Mexico
and Holcim Brazil
Strong results increase in Mexico, El Salvador, Ecuador and
Colombia/Venezuela
Operating EBITDA up by 13 percent to CHF 955 million
Internal operating EBITDA growth at 10.5 percent
12
3
rd
Quarter 2006
Africa Middle East
Construction activity robust in
Morocco and South Africa
Building activity recovered fast in
Lebanon after end of hostilities
13
3
rd
Quarter 2006
Positions in Africa Middle East
1
1
1
Cement plant
Grinding plant/terminal
Aggregates
Participation:
Grinding plant/terminal
Under construction
1
14
3
rd
Quarter 2006
Facts on Africa Middle East
With the exception of Holcim Lebanon, all Group
companies lifted domestic sales
Morocco and South Africa reported very good sales
trend
With the exception of Holcim Lebanon, all Group
companies contributed to the improved financial result
Significant 8 percent increase in operating EBITDA to
CHF 512 million
Internal operating EBITDA growth at 10.5 percent
15
3
rd
Quarter 2006
Strong growth of Indian construction
industry
Restrained building activity in
Thailand, the Philippines and
Indonesia
Asia Pacific
16
3
rd
Quarter 2006
Positions in Asia Pacific
1
1
1
Cement plant
Grinding plant/terminal
Aggregates
Participation:
Grinding plant/terminal
Under construction
1
17
3
rd
Quarter 2006
Facts on Asia Pacific
Group region strengthened by acquisitions in India
Cement sales volumes increasing in India, Sri Lanka,
Bangladesh, Malaysia and Singapore
Sales down in Vietnam and Indonesia
The inclusion of India and a stronger presence in
major urban centers bolsters ready-mix concrete
sales
Operating EBITDA up by 121.6 percent to CHF 933
million on generally stable prices
Internal operating EBITDA growth at 0.2 percent
18
3
rd
Quarter 2006
2005
2005
1
2006
LFL CIS FX in CHF
Net sales 18,468 13,425 17,514 9.0% 18.9% 2.6% 30.5%
Operating EBITDA 4,627 3,501 4,489 10.9% 15.1% 2.2% 28.2%
Operating profit 3,316 2,576 3,281 13.0% 12.3% 2.1% 27.4%
Net income 1,818 1,362 1,950 4.4% 43.2%
Cash flow from
operating activities 3,405 1,864 2,348 20.3% 4.8% 0.9% 26.0%
EPS in CHF 6.73 5.04 6.28 4.7% 24.6%
Cash EPS
2
in CHF
7.02 5.23 6.64 4.5% 27.0%
Million CHF
9 Months +/-Full Year
1
adjusted in line with IAS 21 amended
2
excludes the amortization of other intangible assets
Key financial figures
19
3
rd
Quarter 2006
Major changes in the scope of consolidation
Effective as at
+ Aggregate Industries, UK/US March 21, 2005
+ Ambuja Cement Eastern, India April 11, 2005
+ ACC Limited, India January 24, 2006
+ Gujarat Ambuja Cements, India May 3, 2006
+ Meyer Material Company, US July 21, 2006
+ Foster Yeoman, UK September 7, 2006
+/– Various smaller companies
20
3
rd
Quarter 2006
Exchange rates
Statement of income
avera
g
e exchan
g
e rates in CHF
9M 04 9M 05 9M 06 +/-
1 EUR 1.55 1.55 1.57 1.3%
1 GBP 2.30 2.26 2.29 1.3%
1 USD 1.27 1.23 1.26 2.4%
1 LATAM Basket (MXN, BRL, ARS, CLP)
1
0.97 1.00 1.05 5.0%
1 African Basket (EGP, ZAR, MAD)
1
0.99 1.00 1.00 0.0%
1 Asian Basket (AUD, IDR, INR, THB, PHP)
1
1.03 1.00 1.05 5.0%
Balance sheet
exchan
g
e rates in CHF
30/09/05 31/12/05 30/09/06 +/-
1 EUR 1.56 1.56 1.59 1.9%
1 GBP 2.28 2.26 2.34 3.5%
1 USD 1.29 1.32 1.25 -5.3%
1 LATAM Basket (MXN, BRL, ARS, CLP)
2
0.98 1.00 0.93 -7.0%
1 African Basket (EGP, ZAR, MAD)
2
0.98 1.00 0.86 -14.0%
1 Asian Basket (AUD, IDR, INR, THB, PHP)
2
0.99 1.00 0.99 -1.0%
1
weighted by net sales 9M 2005
2
weighted by net sales full year 2005
21
3
rd
Quarter 2006
Sales of cement by region
Δ
9M 05/9M 06 LFL Change in
structure
Total
Europe 2.9% 0.0% 2.9%
North America 1.5% 0.0% 1.5%
Latin America 10.8% 0.0% 10.8%
Africa Middle East 3.8% -2.9% 0.9%
Asia Pacific -5.1% 85.0% 79.9%
Total 3.0% 22.1% 25.1%
13.7
13.5
13.2
24.7
24.0
23.6
39.4
21.9
19.1
11.311.2
10.6
19.5
15.4
17.6
Total Group
9M 2004 77.3
9M 2005 83.0
9M 2006 103.8
Million t
22
3
rd
Quarter 2006
Sales of aggregates by region
Δ
9M 05/9M 06 LFL Change in
structure
Total
Europe 4.0% 14.4% 18.4%
North America -11.1% 18.0% 6.9%
Latin America 9.0% 0.0% 9.0%
Africa Middle East 15.1% 0.0% 15.1%
Asia Pacific -8.2% 4.0% -4.2%
Total -0.9% 13.7% 12.8%
48.0
44.9
15.3
69.6
58.8
43.9
2.32.4
3.3
8.4
7.3
6.8
9.7
9.2
8.9
Total Group
9M 2004 78.5
9M 2005 122.3
9M 2006 138.0
Million t
23
3
rd
Quarter 2006
Sales of ready-mix concrete and asphalt
9.0
11.1
21.9
28.1
32.8
0.2
9M 2004 9M 2005 9M 2006
+23.9%
+23.3%
+28.3%
Ready-mix concrete in million m
3
Asphalt in million t
n/a
+16.7%
+11.2%
n/a: not applicable
24
3
rd
Quarter 2006
17,514
13,425
10,017
9M 2004 9M 2005 9M 2006
Net sales
Like-for-Like (LFL) 732 7.8% 921 9.2% 1,209 9.0%
Change in structure 98 1.0% 2,616 26.1% 2,536 18.9%
Forex movements -208 -2.2% -129 -1.3% 344 2.6%
Total change 622 6.6% 3,408 34.0% 4,089 30.5%
Million CHF