Bank of america merrill lynch buildings conference 2009 bernhard a fuchs head investor relations october 13 14 2009 holcim ltd 2009
Bạn đang xem bản rút gọn của tài liệu. Xem và tải ngay bản đầy đủ của tài liệu tại đây (884.81 KB, 25 trang )
© Holcim Ltd 2009
Bank of America Merrill Lynch – Buildings
Conference 2009
Bernhard A. Fuchs – Head Investor Relations
October 13 / 14, 2009
2
October 2009Bank of America Merrill Lynch – Buildings Conference 2009
© Holcim Ltd 2009
Agenda
1
Holcim strategy and positioning
2
Attractiveness of Holcim’s business
3
Value creative expansion in Asia Pacific
4
Half-year 2009 results
5
Conclusions
3
October 2009Bank of America Merrill Lynch – Buildings Conference 2009
© Holcim Ltd 2009
Holcim strategy - based on three pillars
Product Focus
Geographic
Diversification
Local Management
Global Standards
Cementitious
materials
Aggregates
Other construction
materials & services
(OCMS)
Value creation – paramount objective of the strategy
Global presence
Balanced between
mature and emer-
ging markets
Balanced between
and within regions
Global business –
strongly anchored
in local markets
Supported by
global standards
Policies &
directives
Exchange of
know how &
best practices
4
October 2009Bank of America Merrill Lynch – Buildings Conference 2009
© Holcim Ltd 2009
Holcim Value Chain
Transactional
Mortars
Ready-mix
Concrete
Asphalt
Concrete
Products
Direct Sales
Direct Sales
Traders
Wholesalers
Retailers
Traders
Wholesalers
Retailers
End-users
General
Contractors
Civil
Engineering
Channels
Transformational
Masons
Self - builders
Cementitious
Materials
(cement,
mineral
components)
Supply
Basic Materials
Processing
Aggregates
(sand, gravel,
stone, recycled
aggregates)
Infrastructure
Commercial /
Industrial
Building
Housing
Demand
A
p
p
l
i
c
a
t
i
o
n
s
Applications and
Construction Fields
5
October 2009Bank of America Merrill Lynch – Buildings Conference 2009
© Holcim Ltd 2009
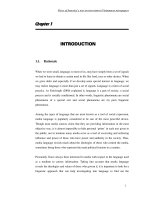
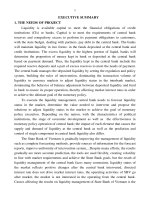
Positioning – Holcim’s cement market portfolio
-4%
-2%
0%
2%
4%
6%
8%
10%
12%
-1%0%1%2%3%4%5%6%7%8%9%10%
1
100% Cement Australia incl. capacity expansion to be commissioned in H2 2009
Sources: Holcim, US Census Bureau, Datastream - Economist Intelligence Unit, June 2009
GDP per capita (at PPP) CAGR 08-13E
Cumulated population
growth 2008 - 2013E
Mature markets Emerging markets
Size of circles represents influenced capacity 2008
Western
Europe
25.9 Mt
Eastern
Europe
23.1 Mt
Africa
Middle East
23.6 Mt
North
America
21.3 Mt
India
44.6 Mt
China
38.5 Mt
Asia Pacific
excl. India,
Australia, China
47.4 Mt
Latin
America
39.0 Mt
Demand
growth
Australia
5.1 Mt
1
6
October 2009Bank of America Merrill Lynch – Buildings Conference 2009
© Holcim Ltd 2009
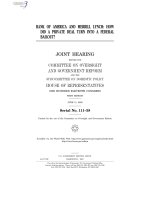
Holcim’s aggregate market portfolio
-4%
-2%
0%
2%
4%
6%
8%
10%
12%
-1%0%1%2%3%4%5%6%7%8%9%10%
Cumulated population
growth 2008 - 2013E
Western Europe
86.1 Mt
Africa
Middle East
2.7 Mt
Latin
America
13.4 Mt
North
America
49.3 Mt
Asia
4.7 Mt
GDP per capita (at PPP) CAGR 08-13E
Mature markets Emerging markets
Size of circles represents consolidated sales volumes 2008
Eastern
Europe
11.5 Mt
Demand
growth
1
represents 100% Cemex Australia
Sources: Holcim, US Census Bureau, Datastream - Economist Intelligence Unit, June 2009
Australia
30.0 Mt
1
7
October 2009Bank of America Merrill Lynch – Buildings Conference 2009
© Holcim Ltd 2009
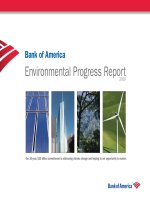
-1.7%
-2.9%
-0.1%
-0.4%
-2.3%
2.3%
GDP Growth [%] (excl. China)
World
Mature
Market
Emerging
Market
2009
Holcim World
Mature
Market
Emerging
Market
GDP Growth weighted with Holcim EBITDA 2008 per country [%] (excl. China)
1.3%
0.1%
2.7%
2.0%
0.1%
4.4%
3.7%
2.9%
4.9%
4.6%
3.3%
6.4%
5.2%
4.2%
6.3%
6.1%
4.5%
8.1%
2010 2011 2012
Holcim generates its EBITDA in countries with
GDP growth above average
Holcim
EBITDA 2008
split:
Mature: 32%
Emerging: 68%
Source: Nominal GDP per Capita (at PPP) in USD: International Monetary Fund - World Economic Outlook Database (April 2009), US Census Bureau
8
October 2009Bank of America Merrill Lynch – Buildings Conference 2009
© Holcim Ltd 2009
1
Holcim strategy and positioning
2
Attractiveness of Holcim’s business
3
Value creative expansion in Asia Pacific
4
Half-year 2009 results
5
Conclusions
Agenda
9
October 2009Bank of America Merrill Lynch – Buildings Conference 2009
© Holcim Ltd 2009
Attractiveness of the heavy-side building materials
Housing and infrastructure are basic needs
Diverse customer base include private and public sector
Sustainable Development is our “license to operate”
The demand drivers and characteristics of our products
provide for continued growth and profitability
10
October 2009Bank of America Merrill Lynch – Buildings Conference 2009
© Holcim Ltd 2009
The industry invests in physical assets
Own raw material reserves
Inflation hedge (real value)
Limited substitution potential
Products are not affected by short-term life-cycles
No process obsolescence risk
Plant and distribution network
Investments in real assets offer long term value
11
October 2009Bank of America Merrill Lynch – Buildings Conference 2009
© Holcim Ltd 2009
Cost saving measures start to bear fruit
Capacity adjustments in all
segments and across all regions
~10.5 m tonnes of cement capacity
closed or mothballed
> 100 aggregates and ready-mix
operations closed
Workforce reduction at operating
companies and headquarters
Technical optimization
Energy efficiency
Procurement
0.0
0.2
0.4
0.6
0.8
1.0
Inital target for
2009
Realized 6M
2009
New target for
2009
+60%
In CHF bn
CHF 381 million achieved per half-year 2009 – target increased
to CHF 600 million
Further optimization of logistics and distribution
12
October 2009Bank of America Merrill Lynch – Buildings Conference 2009
© Holcim Ltd 2009
Infrastructure projects announced will generate
future demand
Globally, more than USD 2.5 trillion of
stimulus programs announced – approx.
USD 1 trillion reserved for infrastructure
In Europe and the US, while initial funding
has made its way into the economy,
programs will have gradual impact on
demand over the next year
Impact on demand for building materials
is seen in China
India’s estimated budget of USD 500
billion on infrastructure to be spent over
five years is showing signs
13
October 2009Bank of America Merrill Lynch – Buildings Conference 2009
© Holcim Ltd 2009
1
Holcim strategy and positioning
2
Attractiveness of Holcim’s business
3
Value creative expansion in Asia Pacific
4
Half-year 2009 results
5
Conclusions
Agenda
14
October 2009Bank of America Merrill Lynch – Buildings Conference 2009
© Holcim Ltd 2009
Australia – an attractive opportunity to execute on
our core strategy in a growing mature market
Expand our business by creating a fully integrated position
in a growing market for cement, aggregate, ready-mix and
concrete products
Country with one of the strongest GDP growth rates among
mature markets
High population growth and rich in natural resources
Strengthen our “twin-leg” strategy
Acquire operations located in the fast growing regions of
Australia with long term reserves
Build a regional cluster in combination with Holcim’s existing
positions in New Zealand
Transaction completed and consolidated as of October 1
st
2009
15
October 2009Bank of America Merrill Lynch – Buildings Conference 2009
© Holcim Ltd 2009
Attractive opportunities – The new setup of Holcim
in Australia
Holcim Australia
83 Agg plants
249 RMX plants
16 Pipe and
precast plants
Cement Australia
1
4 cement plants
1 grinding station
2 terminals
·
µ
Cement Australia
Holcim Australia
1
Cement Australia is 75% owned by Holcim and 25% by HeidelbergCement
16
October 2009Bank of America Merrill Lynch – Buildings Conference 2009
© Holcim Ltd 2009
China – Holcim’s successful partnership with
Huaxin Cement
Huaxin is a leading supplier of
Clinker & cement
Ready-mix & aggregates
Environmental solutions
Cement plant manufacturing equipment
Sustainable cement capacity growth of 26% p.a. over the
last few years
Vertical integration into the ready-mix segment is growing
Alternative fuels program initiated
Focus on operational performance and energy efficiency
including product differentiation
Implementation of Holcim standard programs in the area
of accounting including SAP
Timing of the transaction depends on the response of
authorities involved
17
October 2009Bank of America Merrill Lynch – Buildings Conference 2009
© Holcim Ltd 2009
A
nhui
Henan
Hubei
Hunan
Jiangsu
Jiangxi
Shaanxi
Shanghai
Sichuan
Zhejiang
Shanghai
Wuhan
Positions in China
Y
a
n
g
t
ze
R
i
ve
r
Participation:
Plant
Grinding station /
Terminal
City
18
October 2009Bank of America Merrill Lynch – Buildings Conference 2009
© Holcim Ltd 2009
1
Holcim strategy and positioning
2
Attractiveness of Holcim’s business
3
Value creative expansion in Asia Pacific
4
Half-year 2009 results
5
Conclusions
Agenda
19
October 2009Bank of America Merrill Lynch – Buildings Conference 2009
© Holcim Ltd 2009
Highlights Half-Year 2009
Due to its strong presence in growth markets, Holcim performed
well in a difficult economic market environment and significantly
increased its cash flow
Robust organic growth in Asia Pacific, Latin America and Africa
Middle East in the second quarter
At 24.8 percent in the second quarter, operating EBITDA margin
exceeds previous year’s 23.8 percent
Strong balance sheet and sound liquidity
Based on the successful cost management, the reduction target
for fixed costs in 2009 has been increased from CHF 375 million
to CHF 600 million
Asia will continue to grow and Latin America and Africa Middle East
are also likely to follow favorable trends; in Europe and North Ameri-
ca, the stimuli programs will have a positive impact on demand
building up gradually over the next year
20
October 2009Bank of America Merrill Lynch – Buildings Conference 2009
© Holcim Ltd 2009
Key financial figures
2008 2008 2009
Q1 Q2 H1
Sales volumes
Cement (mt) 143.4 72.5 65.1 -11.1% -6.3% -8.6%
Aggregates (mt) 167.7 79.7 62.5 -26.0% -22.3% -23.8%
RMX (mm3)
48.5 23.6 19.3 -20.0% -21.4% -20.8%
Net sales 25,157 12,434 10,082 -8.5% -13.2% -11.2%
Operating EBITDA 5,333 2,802 2,143 -23.0% -8.4% -14.4%
Operating profit 3,360 1,964 1,306 -41.5% -13.0% -23.7%
Net income 2,226 1,338 787 -55.9% -20.1% -33.9%
Cash flow from
operating activities
3,703 664 805 7.0% 29.4% 38.1%
+/-6M
Million CHF
12M
LFL
21
October 2009Bank of America Merrill Lynch – Buildings Conference 2009
© Holcim Ltd 2009
Operating EBITDA by region
Δ
6M 08/6M 09 LFL Change in
structure
FX Total
Europe -44.8% -0.1% -5.0% -49.9%
North America -57.3% 1.0% -1.0% -57.3%
Latin America 6.6% -8.4% -8.7% -10.5%
Africa Middle East -1.5% -6.3% -1.9% -9.7%
Asia Pacific 22.5% 0.5% -11.5% 11.5%
Total -14.4% -1.9% -7.2% -23.5%
85343
199
543
607608
559
1135
1115
186206
389
873
783
940
6M 2007
6M 2008
6M 2009
Million CHF
22
October 2009Bank of America Merrill Lynch – Buildings Conference 2009
© Holcim Ltd 2009
1
Holcim strategy and positioning
2
Attractiveness of Holcim’s business
3
Value creative expansion in Asia Pacific
4
Half-year 2009 results
5
Conclusions
Agenda
23
October 2009Bank of America Merrill Lynch – Buildings Conference 2009
© Holcim Ltd 2009
Conclusions
The heavyside building materials industry is attractive for
investments
Large-scale, real value investments
Basic needs with limited substitution
Not all of Holcim’s markets are affected equally by the
economic crisis
Cost saving measures that have been implemented bear fruit
Stimulus programs will gradually generate demand over the
next year
Holcim is well positioned to weather the current challenging
business environment, which also offers opportunities (e.g.
Australia and China)
Balance sheet strength continues to be an enabling factor
24
October 2009Bank of America Merrill Lynch – Buildings Conference 2009
© Holcim Ltd 2009
Disclaimer
Cautionary statement regarding forward-looking statements
This presentation may contain certain forward-looking statements
relating to the Group’s future business, development and economic
performance.
Such statements may be subject to a number of risks, uncertainties
and other important factors, such as but not limited to (1) competitive
pressures; (2) legislative and regulatory developments; (3) global,
macroeconomic and political trends; (4) fluctuations in currency
exchange rates and general financial market conditions; (5) delay or
inability in obtaining approvals from authorities; (6) technical
developments; (7) litigation; (8) adverse publicity and news
coverage, which could cause actual development and results to differ
materially from the statements made in this presentation. Holcim
assumes no obligation to update or alter forward-looking statements
whether as a result of new information, future events or otherwise.
25
October 2009Bank of America Merrill Lynch – Buildings Conference 2009
© Holcim Ltd 2009
Contact information and event calendar
Event calendar
November 11, 2009 Press and analyst conference for
the third quarter 2009
March 3, 2010 Press and analyst conference for
the annual results 2009
May 5, 2010 Results for the first quarter 2010
May 6, 2010 General meeting of shareholders
August 19, 2010 Half-year results for 2010
November 10, 2010 Press and analyst conference for
the third quarter 2010
Contact information
Bernhard A. Fuchs
Marco Knuchel
Binit Sanghvi
Investor Relations
Phone +41 58 858 87 87
Fax +41 58 858 80 09
www.holcim.com/investors
Mailing list:
www.holcim.com/subscribe