Results 2009 and outlook for 2010 2010 holcim ltd switzerland
Bạn đang xem bản rút gọn của tài liệu. Xem và tải ngay bản đầy đủ của tài liệu tại đây (2 MB, 42 trang )
© 2010 Holcim Ltd/Switzerland
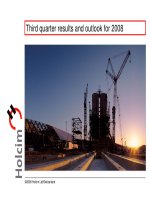
Phu My Bridge, Vietnam
Results 2009 and outlook for 2010
1
Results 2009
© 2010 Holcim Ltd/Switzerland
Challenging economic environment
y Decreasing demand for building materials in Europe and
North America
y Growing or stable demand for building materials in most
of the Emerging Markets
y No significant trend change visible in the fourth
quarter of 2009
2
Results 2009
© 2010 Holcim Ltd/Switzerland
Holcim reacts swiftly and increases its efficiency
y Reduction of fixed costs reached CHF 857 million on a
like-for-like basis
y Higher operating EBITDA margin in all segments in the
second half of the year
y Cement capacity scaled back by more than 10 million t
y More than 100 aggregates and ready-mix concrete plants
closed
y Strategic capacity expansion program continued
y Acquisition in Australia strengthens the Group
3
Results 2009
© 2010 Holcim Ltd/Switzerland
Strong liquidity, lower net debt
y Beginning of 2009, high priority was given to securing
liquidity
y Capital market transactions strengthened balance sheet
and extended the average maturity of existing debt
y Higher cash flow from operating activities
y Unchanged dividend payout ratio; proposed cash dividend
of CHF 1.50 per registered share
y Non-binding advisory vote on the compensation report
y Executive Committee to be enlarged
4
Results 2009
© 2010 Holcim Ltd/Switzerland
Difficult economic situation in Europe
y Decreasing construction activity in the eurozone, but solid
order book in Switzerland
y Aggravated market conditions in Spain, the UK, Italy,
Eastern Europe and Russia
y Volume decline in all segments
y Capacity adjustments and extensive cost-cutting programs
eased the pressure on the income statement
y Lower operating EBITDA as a result of market conditions
and currency factors
5
Results 2009
© 2010 Holcim Ltd/Switzerland
North America hit by the crisis
y Difficult situation on the US construction market persists;
US government’s stimulus programs with no significant
impact
y Situation in Canada slightly better
y Declining sales volumes in all segments
y Rigorous cost management and plant closures
y Market environment adversely impacted results
of Holcim US
y Aggregate Industries US achieved better results
y Slightly higher operating margins
6
Results 2009
© 2010 Holcim Ltd/Switzerland
Resilient Latin America
y Government programs supported construction activity
y Declining construction activity in Mexico and Central
America
y Only moderate sales declines on a like-for-like basis
y Results improved especially in Ecuador, Brazil and
Argentina
y Organic growth in operating EBITDA
7
Results 2009
© 2010 Holcim Ltd/Switzerland
Solid business activity in Africa Middle East
y Sales volumes remained on high levels
y Strong demand for construction materials in Morocco and
the Lebanon
y Decrease in cement deliveries in the Indian Ocean region
y Higher operating EBITDA and organic growth
8
Results 2009
© 2010 Holcim Ltd/Switzerland
Growing demand in Asia Pacific
y Construction industry still on the up, especially in India
y Higher sales volumes in all segments
y Acquisition in Australia strengthens the Group
y Above-average increase of operating EBITDA
y Remarkable performance improvement in India, the
Philippines and Indonesia
9
Results 2009
© 2010 Holcim Ltd/Switzerland
Key financial figures – Full year 2009
1
Includes a capital gain on the sale of a stake in Holcim South Africa of CHF 1,110 million and a special dividend of CHF 150 million, net
2
Includes a special dividend of CHF 150 million, net related to the sale of a stake in Holcim South Africa
3
Calculated on the weighted average number of shares outstanding retrospectively restated in accordance with IAS 33
4
Paid as a stock dividend
5
Proposed by the Board of Directors
LFL CIS FX Total
Sales volumes
- Cement (mt)
149.6 143.4 131.9 -6.8% -1.2% -8.0%
- Aggregates (mt)
187.9 167.7 143.4 -19.6% 5.1% -14.5%
- Ready-mix (mm
3
)
45.2 48.5 41.8 -17.5% 3.7% -13.8%
Net sales
27,052 25,157 21,132 -10.0% 0.8% -6.8% -16.0%
Operating EBITDA
6,930 5,333 4,630 -5.1% -0.7% -7.4% -13.2%
Operating profit
5,024 3,360 2,781 -7.3% -2.1% -7.8% -17.2%
Net income before
minorities
4,545
1
2,226 1,958 -5.8% -1.0% -5.2% -12.0%
Net income attr. to
Holcim shareholders
3,865
1
1,782 1,471 -11.2% -1.7% -4.6% -17.5%
Cash flow
5,323
2
3,703 3,888 12.0% 1.6% -8.6% 5.0%
EPS CHF
3
9.21 6.27 4.93 -21.4%
Dividend/share CHF
3.30 2.25
4
1.50
5
-33.3%
Million CHF
(if not otherwise stated)
+/-
2007 2008 2009
10
Results 2009
© 2010 Holcim Ltd/Switzerland
2008 2009
LFL CIS FX Total
Sales volumes
- Cement (mt)
34.6 32.8 -5.2% 0.0% -5.2%
- Aggregates (mt)
40.4 40.2 -16.6% 16.1% -0.5%
- Ready-mix (mm
3
)
11.5 11.4 -11.3% 10.4% -0.9%
Net sales
5,817 5,358 -8.8% 5.7% -4.8% -7.9%
Operating EBITDA
968 1,016 4.9% 5.6% -5.5% 5.0%
Operating profit
273 444 64.5% 7.3% -9.2% 62.6%
Net income before
minorities
119 381 184.9% 19.3% 16.0% 220.2%
Net income attr. to
Holcim shareholders
43 271 437.2% 32.6% 60.4% 530.2%
Cash flow
2,045 1,696 -16.5% 4.1% -4.7% -17.1%
Million CHF
(if not otherwise stated)
+/-Q4
Key financial figures – Q4 2009
11
Results 2009
© 2010 Holcim Ltd/Switzerland
Major changes in the scope of consolidation
Effective as at
– Egyptian Cement Company January 23, 2008
– Holcim Venezuela December 31, 2008
– Panamá Cement and Cementos Colón December 31, 2008
– United Cement Company of Nigeria April 1, 2009
+ Holcim Australia and Cement Australia October 1, 2009
+/– Various smaller companies
12
Results 2009
© 2010 Holcim Ltd/Switzerland
Cement – Sales volumes by region
Δ
2008/2009 LFL Change in
structure
Total
Europe -21.1% 0.9% -20.2%
North America -25.7% 0.0% -25.7%
Latin America -6.3% -9.9% -16.2%
Africa Middle East -5.2% -4.1% -9.3%
Asia Pacific 0.9% 1.7% 2.6%
Total -6.8% -1.2% -8.0%
10.7
14.4
16.4
26.9
34.3
33.7
67.3
65.6
64.9
8.8
9.7
14.5
22.8
26.6
27.2
Total Group
2007 149.6
2008 143.4
2009 131.9
Million t
13
Results 2009
© 2010 Holcim Ltd/Switzerland
Aggregates – Sales volumes by region
Δ
2008/2009 LFL Change in
structure
Total
Europe -22.6% 2.9% -19.7%
North America -19.1% 0.6% -18.5%
Latin America -5.2% -6.7% -11.9%
Africa Middle East -3.7% 0.0% -3.7%
Asia Pacific -10.6% 131.9% 121.3%
Total -19.6% 5.1% -14.5%
40.2
49.3
56.9
10.4
4.7
4.0
2.62.7
5.7
11.8
12.5
13.4
Total Group
2007 187.9
2008 167.7
2009 143.4
Million t
78.4
108.8
97.6
14
Results 2009
© 2010 Holcim Ltd/Switzerland
17.0
6.6
5.6
19.8
21.0
6.8
Ready-mix concrete and asphalt – Sales volumes
by region
Δ
2008/2009 * LFL Change in
structure
Total
Europe -23.3% 4.3% -19.0%
North America -24.7% 0.0% -24.7%
Latin America -10.3% -3.4% -13.7%
Africa Middle East -8.3% 0.0% -8.3%
Asia Pacific -8.2% 19.2% 11.0%
Total -17.5% 3.7% -13.8%
5.5
7.37.3
6.8
5.4
8.0
8.1
7.3
5.8
1.1
1.2
1.7
10.1
10.6
11.7
Total Ready-mix
2007 45.2
2008 48.5
2009 41.8
Total Asphalt
2007 14.8
2008 13.5
2009 11.0
*
Ready-mix concrete only
Million m
3
/t
15
Results 2009
© 2010 Holcim Ltd/Switzerland
Exchange rates
1
Weighted by net sales full year 2008
Statement of income
average exchange rates in CHF
2007 2008 2009 +/-
1 EUR 1.65 1.59 1.51 -5.0%
1 GBP 2.40 1.99 1.70 -14.6%
1 USD 1.20 1.08 1.09 0.9%
1 LATAM Basket (MXN, BRL, ARS, CLP)
1
1.11 1.00 0.86 -14.0%
1 Asian Basket (AUD, IDR, INR, THB, PHP)
1
1.15 1.00 0.92 -8.0%
Statement of financial position
exchange rates in CHF
31/12/07 31/12/08 31/12/09 +/-
1 EUR 1.66 1.49 1.49 0.0%
1 GBP 2.25 1.53 1.66 8.5%
1 USD 1.13 1.06 1.03 -2.8%
1 LATAM Basket (MXN, BRL, ARS, CLP)
1
1.33 1.00 1.09 9.0%
1 Asian Basket (AUD, IDR, INR, THB, PHP)
1
1.30 1.00 1.05 5.0%
16
Results 2009
© 2010 Holcim Ltd/Switzerland
Exchange rates – Translation gains/losses
in CHF +/- in CHF +/- in CHF +/-
Net sales 391 1.6% -2,749 -10.2% -1,710 -6.8%
Operating EBITDA 74 1.3% -593 -8.6% -394 -7.4%
Operating profit 47 1.1% -376 -7.5% -262 -7.8%
Net income - shareholders
of Holcim Ltd
16 0.8% -152 -3.9% -81 -4.6%
Cash flow from operating activities 53 1.2% -369 -6.9% -322 -8.6%
Total shareholders' equity -450 -2.4% -4,687 -21.4% 277 1.5%
Net financial debt -342 -2.7% -1,877 -14.6% 102 0.7%
2008 2009
Million CHF
2007
17
Results 2009
© 2010 Holcim Ltd/Switzerland
21,132
25,157
27,052
2007 2008 2009
Like-for-Like (LFL) 1,933 8.1% 1,157 4.3% -2,510 -10.0%
Change in structure 759 3.2% -303 -1.1% 195 0.8%
Forex movements 391 1.6% -2,749 -10.2% -1,710 -6.8%
Total change 3,083 12.9% -1,895 -7.0% -4,025 -16.0%
Net sales
Million CHF
18
Results 2009
© 2010 Holcim Ltd/Switzerland
Δ
2008/2009 LFL Change in
structure
Currency Total
Europe -21.6% 1.5% -7.0% -27.1%
North America -21.8% 0.1% -1.4% -23.1%
Latin America -1.7% -9.2% -8.8% -19.7%
Africa Middle East -3.8% -3.5% -3.6% -10.9%
Asia Pacific 6.4% 7.4% -8.7% 5.1%
Total -10.0% 0.8% -6.8% -16.0%
Net sales by region
3480
4527
5365
3348
4170
4010
1831
1354
1206
6418
6109
6292
Million CHF
2007
2008
2009
7320
10401
10043
19
Results 2009
© 2010 Holcim Ltd/Switzerland
North America
16.0%
Europe
33.6%
Asia Pacific
29.5%
Africa Middle East
5.5%
Latin America
15.4%
Net sales by region
Net sales 2009
20
Results 2009
© 2010 Holcim Ltd/Switzerland
4,630
5,333
6,930
21.9%
21.2%
25.6%
22.4%
2007 2008 2009
Operating EBITDA
Margin
Like-for-Like (LFL) 660 10.8% -703 -10.1% -270 -5.1%
Change in structure 110 1.8% -301 -4.3% -39 -0.7%
Forex movements 74 1.3% -593 -8.6% -394 -7.4%
Total change 844 13.9% -1,597 -23.0% -703 -13.2%
Million CHF
1
1
Margin on a like-for-like basis
21
Results 2009
© 2010 Holcim Ltd/Switzerland
Operating EBITDA by region
Δ
2008/2009 LFL Change in
structure
Currency Total
Europe -33.3% 0.0% -5.2% -38.5%
North America -15.6% 0.4% -2.5% -17.7%
Latin America 10.9% -11.0% -9.8% -9.9%
Africa Middle East 8.2% -3.0% -3.8% 1.4%
Asia Pacific 21.5% 6.2% -10.0% 17.7%
Total -5.1% -0.7% -7.4% -13.2%
400
999
486
1076
1194
1256
373368
653
1760
1495
1844
Million CHF
2007
2008
2009
1232
2003
2399
1
22
Results 2009
© 2010 Holcim Ltd/Switzerland
2,781
3,360
5,024
13.2%
13.4%
18.6%
13.8%
2007 2008 2009
Operating profit
Like-for-Like (LFL) 569 13.0% -977 -19.4% -245 -7.3%
Change in structure 23 0.5% -311 -6.2% -72 -2.1%
Forex movements 47 1.1% -376 -7.5% -262 -7.8%
Total change 639 14.6% -1,664 -33.1% -579 -17.2%
Margin
Million CHF
1
1
Margin on a like-for-like basis
23
Results 2009
© 2010 Holcim Ltd/Switzerland
Operating profit by region
879
966
1001
317
303
577
1301
1021
1341
Million CHF
40
5
623
2007
2008
2009
483
1713
1296
1
Δ
2008/2009 LFL Change in
structure
Currency Total
Europe -58.6% -1.4% -2.7% -62.7%
North America 880.0% 0.0% -180.0% 700.0%
Latin America 12.4% -11.7% -9.7% -9.0%
Africa Middle East 10.9% -2.6% -3.7% 4.6%
Asia Pacific 32.7% 5.8% -11.1% 27.4%
Total -7.3% -2.1% -7.8% -17.2%
24
Results 2009
© 2010 Holcim Ltd/Switzerland
Net income
4,545
2,226
1,958
3,865
1,782
1,471
2007 2008 2009
Net income
Net income - shareholders of Holcim Ltd
+83.7%
-17.5%
+67.2%
-12.0%
1
-53.9%
-51.0%
Million CHF
1
Includes a capital gain on the sale of a stake in Holcim South Africa of CHF 1,110 million and a special dividend of CHF 150 million, net


