financial report 2003 holcim has further improved the efficiency of its operations and increased its cash flow
Bạn đang xem bản rút gọn của tài liệu. Xem và tải ngay bản đầy đủ của tài liệu tại đây (623.72 KB, 82 trang )
MD & A
72
Consolidated Financial Statements
88
Principal Companies 128
Auditors’ Report 131
Company Data 133
Holding Holdingabschluss 140
Company Results
Auditors’ Report 147
Prüfungsbericht
Capital Market Information
Kapitalmarktinformationen 148
5-Year-Review 150
Management Structure 155
Holcim has further improved the efficiency
of its operations and increased its cash flow.
The following discussion and analysis of the Group’s financial
Substantial increase in cash flow from operating activities
condition and results of operations should be read in conjunc-
Lower financing costs and successful management of net
tion with the shareholders’ letter, individual reports for the
working capital resulted in a 9.7% increase in cash flow
Group regions and the annual financial statements including
despite the negative currency effects.
the notes to the annual financial statements.
Continued significant improvement of our financial ratios
The financial ratios used to assess Holcim’s credit rating
Financial developments during financial year 2003
displayed further improvement; this includes the figures
relating to the interest coverage, as well as the ratio between
Solid growth in sales volumes
funds from operations to net financial debt. All ratios are
In our key segment of cement and clinker, sales volumes once
well within the target range.
again increased in financial year 2003 (+4.2%), with all Group
Greater presence, and focus on our core business
was also influenced by the full consolidation of Union Cement
The Group strengthened its market presence during financial
Corporation in the Philippines as from October 1, 2002, as well
MD & A
regions contributing to this growth. However, this increase
year 2003 through acquisitions in Spain (Cementos Hispania)
as the acquisition of Cementos Hispania S.A. effective January
and in the Eastern Mediterranean region (grinding plant in
1, 2003. Aggregates and ready-mix concrete business also
Northern Cyprus) as well as through restructuring efforts in
reported higher sales volumes.
Australia (Cement Australia). Holcim also raised its minority
72
shareholding in Alpha Cement to 68.8% through the purchase
Sales trend influenced by a weak US dollar
of additional share packages; therefore this significant
In local currency terms, sales increased by 2.4%. However, in
Russian cement producer was fully consolidated effective
Swiss franc terms the financial performance was influenced
December 31, 2003. Alpha Cement controls two strategically
by the sharp depreciation of the US dollar. Sales for financial
well positioned cement operations with production sites in
year 2003 totaled CHF 12,600 million or 3.2% below the prior-
Shurovo and Volsk. It offers a combined annual capacity of
year amount.
4.3 million tonnes of cement.
Strong operating results and further improvement in margins
As part of the Group’s focus on strategically relevant invest-
Despite the difficult economic situation there was a further
ments, Holcim disposed of Eternit AG (Switzerland) during
advance in operating profit; excluding the effect of exchange
the fourth quarter of 2003. Furthermore, the shareholding in
rates, the operating result increased by 9.7%. Measures to
Cimpor was reduced by 4.5% to 0.6%.
lower costs in both production and administration yielded
results, and Holcim succeeded in achieving a further widening
of its operating margins. The operating EBITDA margin
increased from 25.7% to 26.3%, and remains on track towards
meeting the target of 30%.
Significant rise in consolidated net income
Consolidated net income grew by CHF 180 million, corresponding to an increase of 35.6%. In local currency terms, this rise
amounted to 45.7%. This positive development was accomplished through improvements in efficiency, higher other
income, lower financial expenses, as well as a lower share of
minority interests in consolidated net income.
Key Figures Holcim Group
2003
2002
±%
±% local
currency
Annual production capacity cement
million t
145.2
141.9
+2.3
Sales of cement and clinker
million t
94.3
90.5
+4.2
Sales of aggregates
million t
95.9
92.1
+4.1
Sales of ready-mix concrete
million m3
27.0
25.3
+6.7
Net sales
million CHF
12,600
13,010
–3.2
+2.4
Operating EBITDA
million CHF
3,311
3,341
–0.9
+6.8
Operating EBITDA margin
%
26.3
25.7
EBITDA
million CHF
3,383
3,399
–0.5
+6.6
Operating profit
million CHF
1,925
1,903
+1.2
+9.7
Operating profit margin
%
15.3
14.6
Net income before minority interests
million CHF
932
797
+16.9
+26.6
Net income after minority interests
million CHF
686
506
+35.6
+45.7
Net income margin
%
5.4
3.9
Cash flow from operating activities
million CHF
2,619
2,388
+9.7
+17.4
Cash flow margin
%
20.8
18.4
8,299
8,857
–6.3
–4.9
28.6
26.4
9,499
9,435
+0.7
+7.1
million CHF
Net financial debt
1
Funds from operations / net financial debt
%
Shareholders’ equity including interests
million CHF
Gearing
2
%
Earnings per dividend-bearing share
Fully diluted earnings per share
3
3
87.4
93.9
48,220
Personnel
51,115
–5.7
3.51
2.59
+35.5
+45.9
CHF
CHF
3.49
2.59
+34.7
+44.8
Cash earnings per dividend-bearing share3 4
CHF
4.96
4.14
+19.8
+28.0
Gross dividend per share3
CHF
1.155
1.00
+15.0
million USD
9,403
8,394
+12.0
Operating EBITDA
million USD
2,471
2,155
+14.7
Operating profit
million USD
1,437
1,228
+17.0
Net income after minority interests
million USD
512
326
+57.1
Cash flow from operating activities
million USD
1,954
1,541
+26.8
Net financial debt
million USD
6,693
6,372
+5.0
Shareholders’ equity
million USD
7,660
6,788
+12.8
Earnings per dividend-bearing share
USD
2.62
1.67
+56.9
Principal key figures in USD (illustrative) 6
Net sales
Principal key figures in EUR (illustrative) 6
Net sales
8,289
8,850
–6.3
million EUR
2,178
2,273
–4.2
Operating profit
million EUR
1,266
1,295
–2.2
Net income after minority interests
million EUR
451
344
+31.1
Cash flow from operating activities
million EUR
1,723
1,624
+6.1
Net financial debt
million EUR
5,320
6,108
–12.9
Shareholders’ equity
million EUR
6,089
6,507
–6.4
Earnings per dividend-bearing share
1
million EUR
Operating EBITDA
EUR
2.31
1.76
+31.3
Net income before minority interests and depreciation and amortization.
Net financial debt divided by shareholders’ equity including interests of minority shareholders.
3
Adjusted for 5-for-1 conversion of bearer shares into registered shares on June 10, 2003.
4
Excludes the amortization of goodwill and other intangible assets.
5
Proposed by the Board of Directors.
6
Income statement figures translated at average rate; balance sheet figures at year-end rate.
2
MD & A
of minority shareholders
73
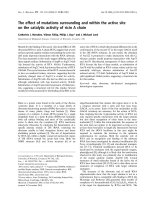
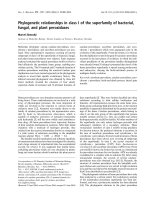
Sales of Cement and Clinker
Net Sales
Million t
Million CHF
100
15,000
90
13,500
80
12,000
70
10,500
60
50
69
74.6
73
80.6
81
84.3
9,000
84
90.5
94.3
40
84
13,010
12,600
2000
2001
2002
2003
3,000
10
81
13,644
4,500
20
73
13,531
6,000
30
11,708
1999
7,500
1,500
0
0
1999
2000
2001
2002
2003
Operating EBITDA
Operating Profit
Million CHF and as % of net sales
Million CHF and as % of net sales
30%
5,000
4,500
24.4%
24.9%
24.4%
25.7%
26.3%
2,500
30%
28%
2,250
28%
MD & A
4,000
74
26%
2,000
26%
3,500
24%
1,750
24%
3,000
22%
1,500
22%
2,500
20%
1,250
2,000
18%
1,000
1,500
16%
750
14%
500
12%
250
10%
0
1,000
500
2,857
3,365
3,335
3,341
3,311
0
1999
2000
2001
2002
2003
20%
14.6%
14.8%
14.3%
14.6%
15.3%
18%
16%
14%
1,706
2,001
1,945
1,903
1,925
12%
10%
1999
2000
2001
Net Income after Minority Interests
2003
Cash Flow from Operating Activities
Million CHF
2002
Million CHF and as % of net sales
1,000
30%
2,500
900
2,250
28%
800
2,000
26%
700
1,750
600
1,500
69
73
81
24%
16.2%
18.9%
17.6%
18.4%
20.8%
20%
1,250
500
22%
1,000
18%
750
16%
200
500
14%
100
250
0
0
400
300
795
1999
886
2000
812
2001
506
2002
686
2003
1,902
2,557
2,402
2,388
2,619
12%
10%
1999
2000
2001
2002
2003
Financial strategy
Holcim ranks as one of the world’s leading cement producers.
sector of individual markets. As a result of the expansion of
The Group’s growth is achieved through value-driven corpo-
the worldwide presence, Holcim has transformed itself from a
rate management and a consistent focus on the core business
group of individual companies to a global enterprise with
of cement, aggregates and concrete. These two key pillars of
local management yet worldwide standards. This is the route
the strategy ensure that Holcim is well positioned, even in
to further efficiency enhancements.
times of economically unfavorable situations. Broad geographical diversification enables the Group to balance the cyclical
fluctuations in sales volumes that arise in the construction
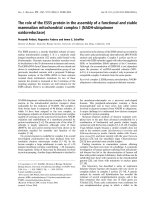
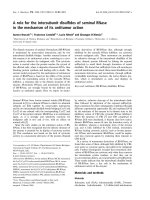
Geographical diversification
Net Sales per Group Region
90%
6.9%
8.3%
8.4%
9.4%
8.2%
8.7%
80%
13.0%
13.7%
8.6%
10.0%
24.7%
22.2%
70%
60%
27.2%
27.2%
80%
38.2%
43.9%
45.6%
47.0%
47.7%
60%
56.1%
54.4%
53.0%
52.3%
69
50%
23.9%
22.9%
22.4%
20.9%
19.5%
30%
40%
30%
20%
10%
90%
70%
24.2%
50%
40%
100%
61.8%
20%
36.7%
33.3%
32.3%
32.8%
34.6%
0%
10%
0%
1999
2000
2001
2002
Europe1
North America1
Latin America
2003
1999
2000
2001
2002
2003
Africa Middle East
Mature Markets
Emerging Markets
Asia Pacific1
1
Beginning 2002 the figures of service companies have been regrouped
from geographical regions to Corporate.
Holcim’s geographical presence was further strengthened in
The focus on growth markets is reflected in revenues from
financial year 2003. The Group regions of Africa Middle East
emerging markets, with a further increase of their share of
and Asia Pacific raised their share of total net sales by 1.4 and
total net sales to 47.7%.
0.7 percentage points, respectively, contributing to an even
more balanced Group portfolio. At 34.6%, Europe remains the
Regional diversification was also improved in terms of operat-
most important Group region in terms of sales. A further
ing results. The share of Group regions Africa Middle East and
increase of 1.8 percentage points is attributable to greater
Asia Pacific grew to 14.3% (+2.2 percentage points) and to 9.9%
construction activity in Eastern Europe, alongside strong
(+1.7 percentage points), respectively, compared to the prior
demand for building materials in Spain and Italy. There was a
year. On the other hand, Europe’s contribution declined by
corresponding decline in the other regions’ share of net sales.
1.3 percentage points to 24.0%. North America and Latin
In North America, Holcim generated 19.5% (2002: 20.9%) of
America’s share also decreased by 1.4 and 1.2 percentage
total Group sales and in Latin America 22.2% (2002: 24.7%).
points to 13.6% and 38.2%, respectively.
The decline in the share of sales for these two Group regions
should be viewed in the context of foreign currency movements. In local currency terms, net sales in both regions combined grew by 0.7%.
MD & A
100%
Net Sales Mature versus Emerging Markets
75
Focusing on the core business
Net Sales per Segment
The focus on the core business, together with strategically rel-
100%
evant investments, has resulted in a continuously lower share
90%
of net sales of the segment other products/services over the
80%
past five years and compared to prior year, there was a decline
70%
from 6.1% to 5.0%. This is a result of the disposal of Eternit AG
60%
on November 10, 2003 and Baubedarf group on October 1,
50%
2002. In this context the share of the core business cement
40%
and clinker increased from 63.4% to 69.6% over the past five
7.1%
6.1%
5.0%
23.7%
23.3%
24.5%
24.1%
25.4%
63.4%
64.4%
68.4%
69.8%
69.6%
20%
year, the share of the aggregates and concrete business grew
12.3%
30%
years. After a decrease by 0.4 percentage points in the prior
12.9%
10%
1.3 percentage points to 25.4% in financial year 2003. This is
primarily due to strong revenue growth in aggregates, the key
factors being positive price and volume effects in Europe.
0%
1999
2000
2001
2002
2003
Cement / Clinker
Aggregates/ Concrete
Holcim constantly reviews the strategic relevance of its
Other products / Services
non-consolidated investments and optimizes its portfolio
whenever necessary. In this context, Holcim sold its minority
interest in the German cement producer Dyckerhoff AG,
and further reduced its shareholding in Portugal’s Cimpor
MD & A
by 4.5%.
76
Committed to a strong rating
Holcim’s current credit rating – as awarded by Standard &
Poor’s – stands at “BBB+”, with “Outlook Stable” in terms of the
long-term rating and “A-2” for the short-term rating. The Group
has succeeded in maintaining the best credit rating of the
industry. For Holcim, a strong rating remains a key objective.
Holcim endeavors to ensure the Group does not fall short of
its financial targets, and to achieve steady improvement.
The table below illustrates the further progress that Holcim
has made.
Financial ratios
2002
Holcim target
28.6%
26.4%
> 25%
Gearing
87.4%
93.9%
80–100%
EBITDA net interest coverage
6.8×
5.9×
> 5×
EBIT net interest coverage
1
2003
Funds from operations1 / net financial debt
3.9×
3.2×
> 3×
Net income before minority interests and depreciation and amortization.
Value-driven corporate management
The US dollar once again experienced a considerable deprecia-
Holcim’s performance management is based on the creation
tion. Its average value declined by 13.5% (2002: –8.3%) from
of value. This encompasses equity and option schemes for
CHF 1.55 per US dollar to CHF 1.34. The average value of the
executives, as well as employee stock participation programs.
euro, on the other hand, rose 3.4% (2002: –2.6%). An overview
A key element is the newly introduced Performance Compen-
of the changes of the most important Group currencies can be
sation Concept. From 2004, all executives across the Group are
found in the “Notes to the Consolidated Financial Statements”
assessed and compensated using a standardized procedure to
on page 101.
reflect their achievement of financial and non-financial objectives. Financial goals are partly based on the principle of value
An analysis of the results that were achieved therefore calls
added, which compares the profit generated before interest
for a differentiated approach that excludes the effects of the
charges with the cost of invested capital. The use of this
substantial foreign currency movements. The following com-
target value enables Holcim not only to evaluate profitability
ments illustrate the impact of these currency fluctuations on
from the point of view of its own business activity but also
the key items of the consolidated statement of income and
to consider the expectations of shareholders.
on cash flow from operating activities.
Whereas the negative effect of exchange rates on net sales
Key factors influencing the 2003 financial statements
amounts to CHF 727 million, operating profit is reduced
by CHF 162 million and cash flow from operating activities
Effect of currencies and inflation on operations
by CHF 183 million.
The Group operates in more than 70 countries, generating a
The development of the individual items in local currencies
Swiss franc. Only about 5% of Group sales are generated in
reflects a positive performance for financial year 2003. The
Swiss francs. Statements of income and cash flow statements
strong increase in operating profit and cash flow in local cur-
in foreign currencies are translated at the average exchange
rencies is the result of the programs that Holcim has system-
rate for the year, whereas balance sheets are translated at
atically pursued over the last two financial years with the
year-end exchange rates.
aim of improving efficiency.
MD & A
predominant part of its results in currencies other than the
77
In order to reduce the effects of inflation and currency devaluation, Group companies in a number of developing countries
and emerging markets use one of the world’s major currencies, usually the US dollar, for reporting purposes.
2003
2002
±%
±% in local
currency
Million CHF
Net sales
Operating profit
12,600
13,010
–3.2
+2.4
1,925
1,903
+1.2
+9.7
Net income after minority interests
686
506
+35.6
+45.7
Cash flow from operating activities
2,619
2,388
+9.7
+17.4
As far as shareholders’ equity and net financial debt are con-
currency movements resulted in a CHF 313 million reduction of
cerned, the negative impact of exchange rate fluctuations are
shareholders’ equity, lower minority interests of CHF 293 mil-
less distinctive. As at the balance sheet date, the US dollar
lion and a decrease in net financial debt of CHF 128 million.
declined by 10.8%, while the euro increased 7.6%. The negative
2003
2002
±%
±% in local
currency
Million CHF
Shareholders’ equity including minority interests
9,499
9,435
+0.7
+7.1
Net financial debt
8,299
8,857
–6.3
–4.9
Gearing
87.4%
93.9%
Sensitivity analysis in relation to currency risks
As shown above, movements in the US dollar versus the Swiss
A hypothetical decline of the US dollar in relation to the Swiss
franc have significant implications on the consolidated finan-
franc of one centime has a negative effect on net sales and
cial statements. The following sensitivity analysis examines
operating profit of CHF 35 million and CHF 7 million, respec-
the impact of a weaker US dollar on key items of the consoli-
tively. Net income and cash flow from operating activities are
dated statement of income and cash flow from operating
reduced by CHF 2 million and CHF 10 million, respectively.
activities.
78
USD/CHF
± in
at 1.34
MD & A
USD/CHF
at 1.33
million CHF
12,600
12,565
–35
Million CHF
Net sales
Operating profit
1,925
1,918
–7
Net income after minority interests
686
684
–2
Cash flow from operating activities
2,619
2,609
–10
Changes in the scope of consolidation
Holcim undertook a selective expansion of its position in vari-
Union Cement Corporation in the Philippines has been fully
ous markets, while continuing to focus on its core business.
consolidated effective October 1, 2002, when its sister compa-
The Group is also pursuing the concept of cross-border clus-
ny Alsons Cement Corporation was acquired through a share
ters, thereby strengthening its integration within regional
exchange deal. Prior to that date, Union Cement had been pro-
markets.
portionately consolidated. Additionally, Novi Popovac in Serbia
was included in the consolidated accounts for a full year.
A significant change in the scope of consolidation resulted
from the acquisition of nearly 100% of Cementos Hispania S.A.
On June 1, 2003, Holcim entered into a strategic partnership in
The purchase of the Yeles cement plant near Madrid, with its
Australia. The newly founded Cement Australia Pty Ltd. is the
annual capacity of 0.8 million tonnes, gave a critical boost to
result of a merger between Australian Cement Holdings Ltd,
Holcim’s position in Spain’s most dynamic main market, and
which did not form part of the Group, and the domestic
represented the perfect complement to the existing aggre-
cement plants and operations of Holcim-owned Queensland
gates and concrete business. The company has been fully
Cement Ltd. The new national market leader in Australia is
consolidated effective January 1, 2003. This entity generated
50% owned by Holcim, while Hanson (UK-based ready-mix
with its product lines sales of EUR 61 million, with a staff of
concrete and aggregates producer) and Rinker (US-Australian
148 people.
building materials group) each hold a 25% stake. The new
corporate entity – with its total annual capacity of 3.6 million
tonnes of cement – has been proportionately consolidated
since that date.
Holcim’s core business was further strengthened with the dis-
Moscow-headquartered Alpha Cement J.S.C., which was
posal of Eternit AG (Switzerland), in fall 2003. This company –
included in the consolidated financial statements for the first
with its plants in Niederurnen and Payerne, together with all
time effective December 31, 2003, does not yet have any impact
rights and obligations – was deconsolidated effective Novem-
on the consolidated statement of income. This entity has been
ber 10, 2003, and no longer forms part of the Group. In addi-
fully consolidated after the acquisition of additional share
tion, the Baubedarf group was sold effective October 1, 2002,
packages, which resulted in an ownership rate of 68.8%.
and eliminated from the scope of consolidation.
The following table shows the effects of changes in the scope
During financial year 2003, a buyout of minorities in Union
of consolidation on net sales, operating profit and cash flow
Cement Corporation in the Philippines and Minetti in Argentina
from operating activities.
further expanded Holcim’s interests in these companies.
2003
2002
±
± due to
changes in
the scope of
consolidation
Million CHF
12,600
13,010
–410
+47
Operating profit
1,925
1,903
+22
+33
Cash flow from operating activities
2,619
2,388
+231
+22
MD & A
Net sales
79
Consolidated statement of income
Statement of Income of Group Holcim
2003
in % of
2002
net sales
in % of
±%
net sales
Million CHF
Net sales
12,600
100.0
13,010
100.0
–3.2
Production cost of goods sold
(6,564)
52.1
(6,767)
52.0
+3.0
Gross profit
6,036
47.9
6,243
48.0
–3.3
Distribution and selling expenses
(2,793)
22.2
(2,837)
21.8
+1.6
Administration expenses
(1,016)
8.1
(1,213)
9.3
+16.2
Other depreciation and amortization
(302)
2.4
(290)
2.2
–4.1
Operating profit
1,925
15.3
1,903
14.6
+1.2
12
0.1
(49)
0.4
+124.5
EBIT
1,937
15.4
1,854
14.3
+4.5
Financial expenses net
(495)
3.9
(564)
4.3
+12.2
Net income before taxes
1,442
11.4
1,290
9.9
+11.8
Income taxes
(510)
4.0
(493)
3.8
–3.4
932
7.4
797
6.1
+16.9
(246)
2.0
(291)
2.2
+15.5
686
5.4
506
3.9
+35.6
Other income (expenses)
Net income before minority interests
Minority interests
MD & A
Net income after minority interests
80
Cement capacity
Net sales
In financial year 2003 cement capacity increased by a total
Much of the CHF 410 million decline in net sales is attribut-
of 3.3 million tonnes (+2.3%). The first-time consolidation
able to negative currency effects, particularly related to the US
of the Russian company Alpha Cement resulted in an increase
dollar. In local currencies, there was a 2.4% growth in net sales,
of 4.3 million tonnes. The first-time consolidation in Spain
of which 2.1% stemmed from organic growth. This was mainly
(+0.8 million tonnes), as well as the commissioning of the new
achieved due to higher sales in Group regions Africa Middle
Holly Hill plant in South Carolina (US) in June 2003 (+0.6 mil-
East (+11.5%) and Asia Pacific (+9.9%) – in spite of the difficult
lion tonnes net) contributed to a higher capacity. On the other
economic situation. Europe also achieved a positive growth
hand, the closure of cement and grinding plants, in particular
(+1.4%), primarily due to a higher level of construction activity
at Hardegsen (Germany) and Thayngen (Switzerland), along-
in Spain as well as in Eastern Europe.
side the replacement of less efficient production lines with
a modern kiln for clinker production in Romania, reduced
Broken down by product segment, net sales in local currency
cement capacity.
of the cement /clinker and aggregates/concrete segments
increased by 3.7% and 3.1%, respectively. The segment other
Sales volumes
products / services recorded a 18.7% decline in net sales in local
The sales volumes of the two segments cement /clinker and
currency. The share of this segment now accounts for only 5%
aggregates /concrete increased during the current financial
of overall net sales.
year. Cement sales increased by 3.8 million tonnes mainly
because of newly consolidated companies. Sales of aggregates
were 3.8 million tonnes higher, while deliveries of ready-mix
concrete went up by 1.7 million m3.
Net Sales per Group Region
2003
20021
±%
±% in local
±% internal
currency
growth
+2.8
–
+1.4
Million CHF
Europe
4,441
4,320
North America
2,507
2,755
–9.0
+0.1
–0.1
Latin America
2,842
3,248
–12.5
+1.3
+0.3
Africa Middle East
1,280
1,136
+12.7
+13.6
+11.5
Asia Pacific
1,760
1,714
+2.7
+12.8
+9.9
Corporate / Eliminations
(230)
(163)
12,600
13,010
–3.2
+2.4
+2.1
Holcim Group
1
Prior-year figures of service companies have been regrouped from geographical regions to Corporate.
Gross profit
Lower material expenses in relation to net sales had a favor-
Accordingly, the gross profit margin declined only marginally
able impact on the gross profit margin. The main reason was
by 0.1 percentage points compared to prior year. The lower
the disposal of the Swiss Baubedarf group. As for energy costs,
value of the US dollar against the Swiss franc also had a
there was a clear reduction in fuel expenses. The Group com-
negative overall impact on gross profit. In local currencies,
panies in France, Belgium and Switzerland made the greatest
the gross profit margin improved slightly (+0.1 percentage
contribution to this positive development through the use
points).
of alternative fuels.
Net Sales, Production Cost of Goods Sold, Gross Profit
2003
in % of
2002
net sales
in % of
net sales
81
Million CHF
Net sales
12,600
100.0
13,010
100.0
Material expenses
(1,562)
12.4
(1,719)
13.2
Fuel expenses
(493)
3.9
(607)
4.7
Electricity expenses
(659)
5.2
(647)
5.0
Personnel expenses
(1,063)
8.4
(1,068)
8.2
(875)
6.9
(910)
7.0
Other production expenses
(1,912)
15.2
(1,816)
14.0
Production cost of goods sold
(6,564)
52.1
(6,767)
52.0
6,036
47.9
6,243
48.0
Depreciation
Gross profit
MD & A
Production costs decreased almost in line with net sales.
Operating EBITDA margin
The operating EBITDA margin increased from 25.7% to 26.3%,
to net sales of 1.2 percentage points. This development illus-
mainly as a result of cost savings. Excluding negative currency
trates that the measures to reduce costs within the Group – in
effects (–0.5 percentage points), the margin was 26.8% – rep-
particular through the launch of shared service centers – had
resenting an increase of 1.1 percentage points. Holcim achieved
a positive impact and contributed to an improvement in the
a significant reduction in administrative expenses in relation
Group’s profitability.
The greatest contribution to the margin improvement came
margin gain of 0.2 percentage points overall. Rising prices in
from Group region Latin America, with an increase of 2.8 per-
Thailand and a successful turnaround in Indonesia were the
centage points. In Argentina, Minetti reported substantially
main factors behind a 1.1 percentage points higher operating
better margins thanks to the economic revival in that country.
EBITDA margin for Asia Pacific. On the negative side, North
At Holcim Apasco in Mexico, lower production and adminis-
America and Africa Middle East reported a reduction of 1.1
trative costs also had a positive influence on margins of the
and 1.5 percentage points, respectively. Lower production costs
Group region Latin America. In Europe, positive results came
could not fully compensate for the price-related decline in
from Cementos Hispania in Spain. By contrast, the aggressively
North America, while the Group companies in Lebanon and
fought price war in Germany depressed not only the financial
Egypt – part of the Africa Middle East region – were unable
results of Holcim Germany but also the operating margins
to match prior-year’s level due to intensive price competition.
of the entire Group region Europe. Nevertheless, there was a
Operating EBITDA Margin
45%
40%
35%
30%
25%
20%
15%
10%
5%
22.6% 22.4%
18.1% 19.2%
38.7% 35.9%
29.1% 30.6%
24.8% 23.7%
26.3% 25.7%
MD & A
0%
2003
2002
2003
2002
Europe
2003
2002
2003
2002
2003
2002
Africa Middle East
Asia Pacific
2002
North America
Latin America
82
2003
Holcim Group
Operating Profit
2003
20021
±%
±% in local
±% internal
currency
growth
Million CHF
Europe
482
504
–4.4
–7.1
–10.9
North America
273
298
–8.4
+1.3
+0.3
Latin America
766
785
–2.4
+13.4
+12.7
Africa Middle East
287
242
+18.6
+22.7
+20.7
Asia Pacific
198
163
+21.5
+30.1
+28.8
Corporate / Eliminations
(81)
(89)
1,925
1,903
+1.2
+9.7
+8.0
Holcim Group
1
Prior-year figures of service companies have been regrouped from geographical regions to Corporate.
Operating profit
Financial expenses
Operating profit increased by CHF 22 million (2002: –42) to
The reduction in financial expenses of CHF 69 million (–12.2%)
CHF 1,925 million in financial year 2003. The 9.7% growth in
is largely due to a decrease in the average interest rate on the
local currencies was more than enough to offset the negative
Group's financial liabilities, which stood at 4.2% (2002: 4.6%)
currency movements.
at the end of 2003. The low interest rate environment around
the world had a positive impact. Holcim used this opportunity,
As a percentage of net sales, distribution and selling expenses
not only to reduce interest charges in absolute terms but to
increased from 21.8% to 22.2%.
further extend the average term of its financial debt. As a
result, a stable risk-compatible basis was created for the years
Administration expenses declined by CHF 197 million (2002:
to come.
–61). As a percentage of net sales, administration expenses
were reduced from 9.3% to 8.1%. This decline reflects ongoing
Income taxes
measures to reduce costs.
The tax rate was reduced to around 35% in 2003. The main reasons for this were a reduction in non tax-deductible expenses,
Other depreciation and amortization relates to intangible and
as well as the release of tax provisions. The anticipated, long-
other operating assets, including goodwill amortization on
term Group tax rate remains unchanged at 33%.
investments. Goodwill is regularly assessed in view of impairment. Any value adjustments are stated under this heading
Consolidated net income after minorities
in the income statement.
Consolidated net income after minorities increased by CHF
180 million (+35.6%) to CHF 686 million (2002: 506). In local
currencies, consolidated net income rose by 45.7%. This strong
2.2%) of net sales. The increase is attributable to two factors:
performance is primarily due to the increase in other income
on the one hand, goodwill amortization increased during
and to lower financial expenses. The smaller share of minority
financial year 2003 due to new acquisitions; on the other
interests in net income also had a positive impact for Holcim.
hand, other depreciation and amortization arises mainly
By contrast, higher income taxes due to an increase in income
in Swiss francs and euro and as a result is relatively high in
before taxes had a negative impact on consolidated net
relation to lower net sales.
income.
Other income (expenses)
Earnings per share
Other income (expenses) include dividend and interest
Earnings per dividend-bearing registered share increased
income, depreciation on non-operating assets and other ordi-
35.5% to CHF 3.51 in financial year 2003. The corresponding
nary income net. In overall terms, other income (expenses) is
cash earnings per share reached CHF 4.96, compared to
CHF 61 million higher than prior-year’s amount. The increase is
CHF 4.14 in the prior year.
primarily attributable to non-recurring expenses and income
in financial year 2002. The largest single item is the CHF 120
million provision recognized in 2002 for pending summary
proceedings by the German Cartel Office. Furthermore, there
were partial write-downs of CHF 63 million on the closure of
non-operational plants in Argentina last year. This movement
was partially offset by a CHF 94 million reduction in other
ordinary income net; a large part of this results from the gains
recorded in 2002 on the sale of a 33% shareholding in Natal
Portland Cement (Pty) Ltd. in South Africa.
MD & A
Other depreciation and amortization amounted to 2.4% (2002:
83
Cash flow, capital expenditure and financing activity
Cash flow from operating activities
Cash flow from operating activities rose CHF 231 million
interest charges, had a positive impact on cash flow, while
despite the decline in net sales and operating EBITDA. A signif-
higher tax charges and currency effects negatively affected
icant reduction in net working capital, together with lower
cash flow.
Cash Flow from Operating Activities
20021
2003
±%
±% in local
±% internal
currency
growth
Million CHF
Europe
878
735
+19.5
+16.3
+17.0
North America
359
347
+3.5
+16.1
+15.3
Latin America
869
863
+0.7
+16.8
+16.5
Africa Middle East
279
256
+9.0
+10.2
+8.2
+2.0
+11.6
+5.6
+9.7
+17.4
+16.7
Asia Pacific
309
303
Corporate / Eliminations
(75)
(116)
2,619
2,388
Holcim Group
1
Prior-year figures of service companies have been regrouped from geographical regions to Corporate.
centage points higher margin, which stands now at 30.6%.
to this positive development. All other regions also reported a
MD & A
The above table shows that Europe in particular contributed
After a slight decrease in the prior year, Europe further
stronger cash flow. Excluding currency effects, the three Group
improved its margin by 2.8 percentage points to 19.8%. North
regions Europe, North America and Latin America each reported
America again reported an increase to 14.3% (+1.7 percentage
more than 16% growth in cash flow.
points), despite difficult market conditions. By contrast, mar-
84
gins declined slightly in the growth regions of Africa Middle
The cash flow margin increased to 20.8% (2002: 18.4%). Latin
East (–0.7 percentage points) and Asia Pacific (–0.1 percentage
America again made a strong improvement with a 4.0 per-
points).
Cash Flow from Operating Activities as % of Net Sales
45%
40%
35%
30%
25%
20%
15%
10%
5%
19.8% 17.0%
14.3% 12.6%
30.6% 26.6%
21.8% 22.5%
17.6% 17.7%
20.8% 18.4%
0%
2003
2002
2003
2002
Europe
North America
Latin America
Africa Middle East
Asia Pacific
Holcim Group
2003
2002
2003
2002
2003
2002
2003
2002
Capital expenditure
EUR 750,000,000
The cash flow used in investing activities rose 15.8% to CHF
1,734 million (2002: 1,497). Most of the increase related to the
4.375% notes guaranteed by
Holcim Ltd, 2003–2010
EUR 50,000,000
Notes guaranteed by Holcim Ltd,
floating interest rates, 2003–2006
item “purchase of financial assets, intangible and other assets
AUD 150,000,000
5.5% notes guaranteed by Holcim Ltd,
AUD 110,000,000
net”, which reached CHF 442 million (2002: 245). A key factor
Notes guaranteed by Holcim Ltd,
fixed interest rates, 2003–2006
was the acquisition of the Yeles cement plant near Madrid for
EUR 190 million.
floating interest rates, 2003–2006
Holcim invested a net amount of CHF 1,292 million (2002:
1,252) in production and other fixed assets during financial
These financing measures were exclusively for the purpose of
year 2003. Compared to the prior year, this represents an
refinancing existing debt, extending the average maturity
increase of 3.2%. Among the biggest single investments were
periods of financial liabilities and switching from bank loans
the Holly Hill cement plant in the US, as well as new kilns and
to capital market transactions.
kiln lines in Romania and South Africa, which were successfully commissioned during financial year 2003. A new kiln line
in Costa Rica and a grinding plant in Vietnam remain under
Consolidated balance sheet
construction.
Consolidated shareholders’ equity increased by CHF 265 milInvestment in rationalization and improving internal processes,
lion (2002: –1,074) to CHF 6,833 million (2002: 6,568). The
environmental measures and occupational safety amounted to
currency-related impact on shareholders’ equity was below
CHF 915 million (2002: 917) and remained therefore practically
prior-year’s level. Nevertheless, there was a decline of CHF
unchanged compared to the prior year.
313 million (2002: –1,433) due to exchange rate fluctuations.
an increase of consolidated shareholders’ equity by CHF 686
As part of the Group’s policy of centralizing treasury functions,
million (2002: 506). The dividend distribution from Holcim Ltd
Holcim successfully continued to finance the debt of its oper-
remained at CHF 195 million.
85
ating companies via Group finance companies. In order to
strengthen its financing, Holcim has raised the share of finan-
Interests of minority shareholders fell by CHF 201 million
cial debt financed through Group finance companies from
(2002: +126) to CHF 2,666 million (2002: 2,867). Unlike prior
50% to 69% over the last five years.
year, there was practically no growth in minority interests
through new acquisitions. There was an even larger reduction
in minority interests due to exchange rate effects than in the
Financing via Group Financial Holdings
prior year. In contrast to shareholders’ equity, the higher value
of the euro had a smaller impact, as the bulk of interests of
100%
minority shareholders are outside the euro zone.
90%
80%
70%
Net financial debt decreased further to CHF 8,299 million
60%
(2002: 8,857). The 6.3% reduction is the net result of currency
50%
fluctuations amounting to CHF 128 million, cash flow after
investing activities and dividend payments of CHF 517 million
40%
30%
50%
55%
55%
63%
69%
and changes in the scope of consolidation.
20%
The relationship between net financial debt and shareholders’
10%
equity including interests of minority shareholders (gearing)
0%
1999
2000
2001
2002
2003
declined by 6.5 percentage points compared to the prior year.
At 87.4%, this ratio was well within the Group’s target range of
In this regard, the largest transactions carried out by
Holcim through various capital markets in 2003 were as
follows:
MD & A
Consolidated net income after minority interests resulted in
Financing activity
80 to 100%.
Liquidity
Sustainable development
In the context of further investments and in view of securing
its liquidity, the Group maintained its cash position in line
Since publishing its first Corporate Sustainable Development
with market risks/opportunities; this position was reduced
Report in November 2002, Holcim has made major progress in
slightly during the year on the basis of a market assessment.
integrating the concept of sustainability with regard to the
This was offset by further substantial unutilized credit lines
environment and the responsibility towards society at large.
(see page 114).
Central issues within the sustainability arena included climate
change, the sensitive use of energy and natural resources and
Pension obligations
occupational health & safety. However, importance was also
attached to Holcim’s duties to society at large, particularly in
Most of the pension plans are independent of the company
the vicinity of the plants (see pages 8 to 11).
and operate in separate legal entities (foundations). Both
employees and employers contribute to these pension funds
In 2003, the Group invested CHF 81 million (2002: 83) in
in order to augment saving balances and to cover risks. Assets
improving the environmental sustainability of its production
held by the pension funds are available to fund these pension
facilities.
liabilities. Although the Group has no commitments towards
these pension funds other than the defined contributions,
Provisioning by the Group companies in respect of their envi-
the calculated net liability is recorded in the Group balance
ronmental obligations is based on constructive, as well as
sheet in accordance with International Financial Reporting
legal and contractual obligations. CHF 231 million (2002: 241)
Standards (IFRS). Subsidiaries with unfunded pension plans
was set aside for recultivation and other environmental liabili-
have recorded a provision in their books accordingly.
ties in the year under review. The Group does not anticipate
MD & A
any material, adverse effect of environmental liabilities on its
86
The pension fund assets are recorded at fair value. Actuarial
future operating results.
gains or losses exceeding the corridor of 10% as defined by
IFRS are amortized based on the expected average remaining
Holcim is encouraging the use of alternative fuels and raw
working lives of the participating employees.
materials (AFR) in the production process. A specific AFR
policy for this purpose was developed and implemented in the
As at December 31, 2003, the net liability from funded and
year under review. This is a natural extension of the corporate
unfunded plans amounted to CHF 289 million (2002: 275).
governance concept, and is intended to minimize the risks
The fair value of the pension funds’ assets declined from
associated with the use of such materials, enhance the trans-
CHF 1,582 million to CHF 1,480 million, mainly due to the
parency of communication on this subject and ultimately
disposal of Eternit AG (Switzerland).
contribute to improved environmental protection.
Holcim also has entered into a partnership with the Deutsche
Gesellschaft für Technische Zusammenarbeit (GTZ) of Germany. This is aimed at the development of solutions for the
integrated management of industrial waste. The intention is
to formulate internationally recognized guidelines for the use
of alternative fuels in the industry, promote understanding
about the sensitive treatment of these substances, and test
the feasibility of the concept through pilot projects in Chile,
Morocco and the Philippines. The partnership with GTZ is
for three years, running until 2006.
The Group is also actively involved in the World Business
Group accounting policies
Council for Sustainable Development. In the form of a 2002
action plan to bolster sustainability in the cement industry,
No new International Financial Reporting Standards (IFRS)
the council’s work concentrates on climate protection, energy
were introduced in financial year 2003.
sources and raw materials, health and safety in the workplace,
reducing emissions, environmental and social responsibility
The International Accounting Standards Board is critically
in local projects, and communication. An interim report on
examining current International Accounting Standards with a
the progress made since the launch of this campaign is to be
view to bringing about a worldwide harmonization. This
published in 2005.
process of amending, adding to and standardizing worldwide
accounting standards could lead to substantial changes in
Holcim affirmed its commitment to society at large on a
the applicable directives over the course of the next few years.
Group-wide basis in 2003, representing another element of
Holcim is closely monitoring developments in this area and
the corporate policy. The Group companies will be seeking to
playing an active role in helping to formulate future standards
contribute towards improving the quality of life in the areas
via several special committees.
surrounding their individual plants. Guidelines have been
drawn up with a view to enabling the individual Group companies to improve harmonization of the efforts they have
Events after the balance sheet date
already made and to fine-tune their obligations.
On January 23, 2004, Holcim announced a public purchase
offer to all minority shareholders of Holcim Apasco S.A. de C.V.
ability, Holcim signed the UN Global Compact in 2003.
(Mexico). If Holcim acquires all outstanding shares – corre-
With a view to fulfilling the requirements laid down in the
sponding to 31.1% of the share capital – the total investment
agreement, Holcim’s first step has been to examine where
will be USD 750 million. To maintain its financial profile, Holcim
the Group currently stands in relation to the nine principles
intends to underlay this transaction with adequate equity.
involved. Holcim will also be publishing information on this
subject in its next Corporate Sustainable Development Report.
In January 2004, the German competition authorities approved
the acquisition of Rohrbach Zement & Co. KG in Southern
In 2003, Holcim was listed in the Dow Jones Sustainability
Germany. Its plant in Dotternhausen has an annual installed
Index (DJSI) for the construction sector. Holcim was judged to
capacity of 0.6 million tonnes of cement and a further 0.3 mil-
have successfully integrated sustainability into its corporate
lion tonnes of special binding agents. The entity will be fully
strategies and Group-wide philosophy. Its program for promot-
consolidated from January 1, 2004.
ing the use of alternative fuels and raw materials is classed as
pioneering, and it was also stated that Holcim treats the wider
social obligations facing the industry in an exemplary manner.
Outlook
Holcim won a series of awards in 2003 that will feature in the
For details regarding the outlook for 2004, please refer to the
new Corporate Sustainable Development Report 2003, along-
shareholders’ letter on pages 2 to 5.
side the progress the Group has made in recent years and the
challenges that lie ahead of Holcim.
Further information on this subject can be found by visiting
the website at www.holcim.com/sustainable.
MD & A
As part of its commitment to observe the principle of sustain-
87
Consolidated Statement of Income of Group Holcim
Million CHF
Notes
2003
2002
Net sales
5
12,600
13,010
Production cost of goods sold
6
(6,564)
(6,767)
6,036
6,243
Gross profit
Distribution and selling expenses
7
(2,793)
(2,837)
(1,016)
(1,213)
8
(302)
(290)
9
1,925
1,903
10
12
(49)
1,937
1,854
Administration expenses
Other depreciation and amortization
Operating profit
Other income (expenses)
EBIT
Financial expenses net
11
Income taxes
12
Net income before minority interests
(495)
(564)
1,442
Net income before taxes
1,290
(510)
(493)
932
(291)
686
Net income after minority interests
797
(246)
Minority interests
506
Consolidated Statement of Income
CHF
Earnings per dividend-bearing share1
14
3.51
2.59
Fully diluted earnings per share1
14
3.49
2.59
14
4.96
4.14
Cash earnings per dividend-bearing share
12
88
1
Adjusted for 5-for-1 conversion of bearer shares into registered shares on June 10, 2003.
2
Excludes the amortization of goodwill and other intangible assets.
Consolidated Balance Sheet of Group Holcim
Million CHF
Cash and cash equivalents
Notes
31.12.2003
31.12.2002
15
2,456
2,698
62
107
Marketable securities
Accounts receivable
16
2,161
2,167
Inventories
17
1,175
1,265
174
223
6,028
6,460
Prepaid expenses and other current assets
Total current assets
Financial assets
18
1,862
2,030
Property, plant and equipment
21
13,294
13,806
Intangible and other assets
22
3,478
2,997
Deferred tax assets
29
163
167
Total long-term assets
18,797
19,000
Total assets
24,825
25,460
Trade accounts payable
24
1,245
1,074
Current financial liabilities
25
2,660
2,885
Other current liabilities
26
1,209
5,168
Long-term financial liabilities
27
8,157
8,777
Deferred tax liabilities
29
1,021
1,126
Long-term provisions
30
924
954
Total long-term liabilities
10,102
10,857
Total liabilities
15,326
16,025
2,666
2,867
Consolidated Balance Sheet
1,319
5,224
Total short-term liabilities
89
Interests of minority shareholders
32
Share capital
33
Treasury shares
33
402
402
2,628
Capital surplus
2,628
(448)
(452)
Reserves
4,251
3,990
Total shareholders’ equity
6,833
6,568
24,825
25,460
Total liabilities and shareholders’ equity
Statement of Changes in Consolidated Equity of Group Holcim
Share
Capital
Treasury
capital
surplus
shares
402
2,570
(451)
Million CHF
Equity as at January 1, 2002
Net income after minority interests
Currency translation effects
Change in fair value
– Available-for-sale securities
– Cash flow hedges
Realized gain in income statement
– Available-for-sale securities
– Cash flow hedges
Dividends
Statement of Changes in Consolidated Equity
Change in treasury shares net
90
(1)
Equity component of convertible bonds
58
Equity as at December 31, 2002
402
2,628
(452)
Equity as at January 1, 2003
402
2,628
(452)
Net income after minority interests
Currency translation effects
Change in fair value
– Available-for-sale securities
– Cash flow hedges
Realized gain in income statement
– Available-for-sale securities
– Cash flow hedges
Dividends
Change in treasury shares net
Equity as at December 31, 2003
4
402
2,628
(448)
Retained
Available-for-sale
Cash flow
Currency
Total
Total
earnings
equity reserve
hedging
translation
reserves
shareholders’
reserve
effects
(76)
5
5,367
(175)
equity
58
0
(195)
(1)
0
58
5,678
(178)
(82)
(1,428)
3,990
6,568
5,678
(178)
(82)
(1,428)
3,990
6,568
686
686
(313)
(313)
60
60
1
1
9
9
13
13
Statement of Changes in Consolidated Equity
(6)
0
(195)
(61)
(195)
0
(1,433)
0
58
(1,433)
58
(6)
506
(6)
(61)
7,642
(61)
(1,433)
5,121
506
506
(195)
(195)
91
0
4
4,251
6,833
686
(313)
60
1
9
13
(195)
6,169
(109)
(68)
(1,741)
Consolidated Cash Flow Statement of Group Holcim
Million CHF
Notes
Depreciation and amortization of operating assets
Other non-cash items
Change in net working capital
1,903
1,386
1,438
152
8
2002
1,925
Operating profit
2003
86
67
Interest received
3,291
78
Dividends received
(136)
3,530
Cash generated from operations
103
26
57
Interest paid
(458)
(582)
Income taxes paid
(534)
(449)
Other expenses
(23)
(32)
2,619
Cash flow from operating activities (A)
2,388
(1,405)
(1,326)
36
113
74
Purchase of financial assets, intangible and other assets
36
(1,014)
(1,000)
Disposal of financial assets, intangible and other assets
92
36
Disposal of property, plant and equipment
Consolidated Cash Flow Statement
Purchase of property, plant and equipment
36
572
755
(1,734)
(1,497)
Dividends paid on ordinary shares
(195)
(195)
Dividends paid to minority shareholders
(157)
(139)
Cash flow used in investing activities (B)
Dividends paid on preference shares
Capital paid-in by (repaid to) minority interests
Movements of treasury shares net
(16)
(24)
26
(10)
4
(1)
(De)Increase in current financial liabilities
(187)
146
Proceeds from long-term financial liabilities
2,359
2,749
0
58
(2,848)
(2,561)
30
16
(984)
39
(99)
930
Cash and cash equivalents as at January 1
2,698
2,137
(De)Increase in cash and cash equivalents
(99)
930
Currency translation effects
(143)
(369)
Cash and cash equivalents as at December 31
2,456
2,698
Equity component of convertible bonds
Repayment of long-term financial liabilities
Decrease in marketable securities
Cash flow (used in) from financing activities (C)
(De)Increase in cash and cash equivalents (A+B+C)
Basis of preparation
company reaches zero, unless the Group has either incurred
The consolidated financial statements have been prepared in
or guaranteed obligations in respect of the associated
accordance with International Financial Reporting Standards
company.
(IFRS).
Foreign currency translation
Adoption of new International Financial Reporting Standards
Income statements of foreign entities are translated into the
There were no new International Financial Reporting Standards
Group’s reporting currency at average exchange rates for
adopted by the Group during 2003 and 2002.
the year and balance sheets are translated at exchange rates
ruling on December 31.
Use of estimates
The preparation of financial statements in conformity with
Goodwill arising on the acquisition of a foreign entity is
IFRS requires management to make estimates and assump-
treated as a local currency asset of the acquirer and recorded
tions that affect the reported amounts of revenues, expenses,
at the exchange rate at the date of the transaction.
assets, liabilities and related disclosures at the date of the
financial statements. These estimates are based on manage-
Foreign currency transactions are accounted for at the
ment’s best knowledge of current events and actions that the
exchange rates prevailing at the date of the transactions;
Group may undertake in the future. However, actual results
gains and losses resulting from the settlement of such
could differ from those estimates.
transactions and from the translation of monetary assets and
liabilities denominated in foreign currencies are recognized
Scope of consolidation
in the income statement, except when deferred in equity as
The consolidated financial statements comprise those of
qualifying cash flow hedges.
Holcim Ltd and of its subsidiaries, including joint ventures
The functional currency is normally the currency of the coun-
presented in the section “Principal Companies”.
try in which a Group company is domiciled. However, certain
Principles of consolidation
ing in economies with unstable currency situations consider
Subsidiaries, which are those entities in which the Group has
the USD or the EUR to be the more appropriate measurement
an interest of more than one half of the voting rights or
currency as it more correctly reflects the economic substance
Accounting Policies
and associated companies. The list of principal companies is
otherwise has the power to exercise control over the opera-
of the underlying events and circumstances relevant to
93
tions, are consolidated. Subsidiaries are consolidated from the
that particular enterprise. As a consequence thereof, the USD
date on which control is transferred to the Group and are no
or the EUR are used as the functional currency for these
longer consolidated from the date that control ceases.
specifically affected companies.
All intercompany transactions and balances between Group
Cash and cash equivalents
companies are eliminated.
Cash and cash equivalents are readily convertible into a
subsidiaries in high inflation countries or companies operat-
known amount of cash with original maturities of three
The Group’s interest in jointly controlled entities is consoli-
months or less. Cash and cash equivalents comprise cash at
dated using the proportionate method of consolidation.
banks and on hand, deposits held on call with banks, other
Under this method, the Group records its share of the joint
short-term highly liquid investments and bank overdrafts.
ventures’ individual income and expenses, assets and liabilities and cash flows in the consolidated financial statements
Marketable securities
on a line-by-line basis. All transactions and balances between
Marketable securities consist primarily of debt and equity
the Group and joint ventures are eliminated to the extent of
securities which are traded in liquid markets and are classi-
the Group’s interest in the joint ventures.
fied as available-for-sale. They are carried at fair value with all
fair value changes recorded in equity until the financial asset
Investments in associated companies are accounted for using
is either impaired or disposed of at which time the cumula-
the equity method of accounting. These are companies over
tive gain or loss previously recognized in equity is transferred
which the Group generally holds between 20 and 50% of
to net income for the period.
the voting rights and has significant influence but does not
exercise control. Equity accounting is discontinued when
the carrying amount of the investment in an associated
Accounts receivable
their estimated useful lives, using the straight-line method,
Trade accounts receivable are carried at original invoice
on the following bases:
amount less an estimate made for doubtful debts based
on a review of all outstanding amounts at the year end.
Land
No depreciation except on land
with raw material reserves
Inventories
Buildings and installations
20 to 40 years
Inventories are stated at the lower of cost and net realizable
Machinery
10 to 30 years
value. Cost is determined by using the weighted average
Furniture, vehicles and tools
3 to 10 years
cost method. The cost of finished goods and work in progress
comprises raw materials and additives, direct labor, other
Repair and maintenance expenses are usually charged to
direct costs and related production overheads. Cost of inven-
the income statement but costs incurred are capitalized
tories includes transfers from equity of gains or losses on
if one or more of the following conditions are satisfied:
qualifying cash flow hedges relating to inventory purchases.
the original useful life of the asset is extended, the original
production capacity is increased, the quality of the product
Financial assets
is materially enhanced or production costs are reduced
Financial assets consist of (a) investments in associates
considerably.
(b) investments in third parties (c) long-term receivables from
associates (d) long-term receivables from third parties and
Costs incurred to gain access to mineral reserves are capital-
(e) long-term derivative assets. Investments in associates are
ized and depreciated over the life of the quarry, which is
accounted for using the equity method of accounting (for
based on the estimated tonnes of raw material to be extract-
more details, please refer to “Principles of consolidation”).
ed from the reserves.
Accounting Policies
Investments in third parties are classified as available-for-sale
and long-term receivables from associates and third parties
Interest cost on borrowings to finance construction projects
are classified as loans originated by the Group. Long-term
which last longer than one year are capitalized during
derivative assets are regarded as held for hedging unless they
the period of time that is required to complete and prepare
do not meet the strict hedging criteria under IAS 39 Financial
the asset for its intended use. All other borrowing costs are
Instruments: Recognition and Measurement, in which case
expensed in the period in which they are incurred.
they will be classified as held for trading.
Government grants received are deducted from property,
94
All purchases and sales of investments are recognized on
plant and equipment and reduce the depreciation charge
trade date, which is the date that the Group commits to pur-
accordingly.
chase or sell the asset. Purchase cost includes transaction
costs. Loans originated by the Group are measured at amor-
Leases of property, plant and equipment where the Group
tized cost. Available-for-sale investments are carried at fair
has substantially all the risks and rewards of ownership are
value, while held-to-maturity investments are carried at
classified as finance leases. Property, plant and equipment
amortized cost using the effective interest method. Gains
acquired through a finance lease is capitalized at the date of
and losses arising from changes in the fair value of available-
inception of the lease at the present value of the minimum
for-sale investments are included in equity until the financial
future lease payments. The corresponding lease obligations,
asset is either impaired or disposed of, at which time the
excluding finance charges, are included in current or long-
cumulative gain or loss previously recognized in equity is
term financial liabilities.
transferred to net profit and loss for the period. Where no
reliable information to value investments at equity value or
For sale and lease-back transactions, the book value of the
fair value is available, these investments are carried at the
related property, plant or equipment remains unchanged.
lower of cost and net realizable value.
Gains from a sale are included as a financing liability and
the financing costs are allocated over the term of the lease in
Property, plant and equipment
such a manner that the costs are reported over the relevant
Property, plant and equipment is valued at acquisition or
periods.
construction cost less depreciation and impairment loss.
Cost includes transfers from equity of any gains or losses on
qualifying cash flow hedges. Depreciation is charged so as
to write off the cost of property, plant and equipment over
Investment property
Expenditures which enhance or extend the performance of
Investment property is property held to earn rental income
computer software programs beyond their original specifica-
and for capital appreciation and is valued at acquisition cost
tions are capitalized and added to the original cost of the
less depreciation and impairment loss.
software. Computer software development costs recognized
as assets are amortized using the straight-line method over
their useful lives, but not exceeding a period of three years.
Goodwill
Goodwill represents the excess of the cost of an acquisition
over the Group’s interest in the fair value of the identifiable
Other intangible assets
assets and liabilities of a subsidiary, associate or joint venture
Expenditure on acquired patents, trademarks and licenses is
at the date of acquisition. Goodwill is recognized as an
capitalized and amortized using the straight-line method
intangible asset and amortized on a straight-line basis over
over their estimated useful lives, but not exceeding 20 years.
its estimated useful life as follows:
Impairment of assets
Cement / Clinker
20 years
At each balance sheet date, the Group assesses whether
Aggregates
10 years
there is any indication that an asset may be impaired. If any
5 years
such indication exists, the recoverable amount of the asset
10 years
is estimated in order to determine the extent of the impair-
Ready-mix concrete
Other products / Services
ment loss, if any. Where it is not possible to estimate the
Shorter useful lives may be used where appropriate but
recoverable amount of an individual asset, the Group esti-
the maximum estimated useful life may not exceed
mates the recoverable amount of the cash generating unit
20 years.
(defined on the basis of geographical location) to which
On disposal of a subsidiary, associate or joint venture, the
related unamortized goodwill is included in the determina-
If the recoverable amount of an asset or cash generating unit
tion of profit or loss on disposal.
is estimated to be less than its carrying amount, the carrying
amount of the asset or cash generating unit is reduced to
Negative goodwill represents the excess of the fair value
its recoverable amount. Impairment losses are recognized
of the Group’s share of identifiable assets and liabilities
immediately in the income statement.
acquired over the cost of acquisition. Negative goodwill
Accounting Policies
the asset belongs.
95
is presented in the same balance sheet classification as
Where an impairment loss subsequently reverses, the carry-
goodwill. To the extent that negative goodwill relates
ing amount of the asset or cash generating unit is increased
to expectations of future losses and expenses that are
to the revised estimate of its recoverable amount. However,
identified in the Group’s plan for the acquisition and
this increased amount cannot exceed the carrying amount
can be measured reliably, but which do not represent
that would have been determined had no impairment loss
identifiable liabilities, that portion of negative goodwill
been recognized for that asset or cash generating unit in
is recognized in the income statement when the future
prior periods. A reversal of an impairment loss is recognized
losses and expenses occur. The remaining negative good-
immediately in the income statement.
will is recognized as income on a straight-line basis
over the remaining average useful life of the identifiable
Long-term financial liabilities
acquired depreciable assets. To the extent that such
Bank loans acquired and non-convertible bonds issued are
negative goodwill exceeds the aggregate fair value of
recognized initially at the proceeds received, net of transac-
the acquired identifiable non-monetary assets, it is
tion costs incurred. In subsequent periods, bank loans and
recognized in income immediately.
non-convertible bonds are stated at amortized cost using
the effective interest method with any difference between
Computer software
proceeds (net of transaction costs) and the redemption value
Costs associated with developing or maintaining computer
being recognized in the income statement over the term of
software programs are recognized as an expense as incurred.
the borrowings.
Costs that are directly associated with identifiable and
unique software products controlled by the Group and which
Upon issuance of convertible bonds, the fair value of the lia-
will probably generate economic benefits exceeding costs
bility portion is determined using a market interest rate for
beyond one year, are recognized as intangible assets.
an equivalent non-convertible bond; this amount is carried as