Giới thiệu về LabVIEW Thiết kế kiểm soát, Hệ thống nhận dạng và công cụ mô phỏng pot
Bạn đang xem bản rút gọn của tài liệu. Xem và tải ngay bản đầy đủ của tài liệu tại đây (616.7 KB, 23 trang )
Presentation by Finn Haugen at NI Days 2005 in Drammen, Norway, April 26 2005:
Introduction to LabVIEW Control Design,
System Identification and Simulation Tools
This document and the linked files are available at (The files may be updated at
any time.)
Contents of this document
1 Introduction
1.1 A few words about my background
1.2 Outline of the presentation
1.3 The physical process - a DC motor
1.4 The Compact FieldPoint I/O and embedded control system
1.5 A procedure for analysis, design and implementation of a control system
2 Black-box modelling of the process
2.1 Introduction
2.2 Exciting the process and measuring the response
2.3 Estimating a mathematical model from logged data
2.4 Is the model accurate? Comparing process simulation and measurements
3 Control system analysis and design
3.1 Analysis of control system using Control Design Toolkit
3.2 Comparing simulated control system and real control system (target: PC)
4 Implementing and testing the control system on the real-time target (Compact
FieldPoint)
1 Introduction
1.1 A few words about my background
A few words about my background ():
• Teaching and writing and consulting in control engineering since about 1990
• Associate Professor (80% position) at Telemark University College and consultant via
TechTeach
• Developing KYBSIM ( - a library of freely available
simulators developed in LabVIEW for dynamic systems, control and signal processing
[Contents]
1.2 Outline of the presentation
This presentation will demonstrate how to use the above toolkits in a practical application:
Analysis, design, simulation and implementation of a speed control system for a DC motor using
a Compact FieldPoint system for I/O and embedded control. The motor and the Compact
FieldPoint system are described briefly below.
The following LabVIEW tools are used:
• System Identification Toolkit
• Control Design Toolkit
• Simulation Module
[Contents]
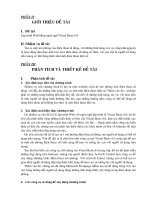
1.3 The physical process - a DC motor
In this presentation a DC motor is modelled, simulated and controlled:
DC motor
The motor is produced by Faulhaber. The control signal is in the range of ±10V, and the
tachometer voltage is in the range of approximately ±10V. A load inertia has been added to the
motor. The time constant of the motor including load and tachometer is approximately 0.3s. A
load torque can be applied to the motor by simply braking the motor (the load) by hand.
[Contents]
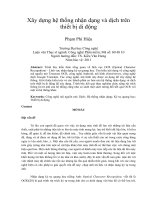
1.4 The Compact FieldPoint I/O and embedded control system
Compact Fieldpoint system used in this applicarion consists of the following modules:
• cFP-2000 controller module running LabVIEW RT 7.1
• cFP-AIO-610 analog I/O module
Compact FieldPoint
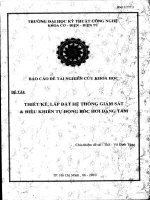
Below is shown how the FieldPoint system appears in the Measurement and Automation
Explorer (MAX) utility.
Measurement and Automation Explorer (MAX) showing the Compact FieldPoint system
[Contents]
1.5 A procedure for analysis, design and implementation of a control system
Procedure for analysis, design and implementation of a control system
In the present application separate files implements the steps shown above. The logged data are
stored in a spreadsheet file. The estimated model is also stored in a file.
The figure below shows a block diagram of the process with controller and estimator, and blocks
containing functions for analysis and design of the control system.
Block diagram of the process with controller and estimator, and blocks containing functions for
analysis and design of the control system.
[Contents]
2 Black-box modelling of the process
2.1 Introduction
When a black-box model of a process is to be developed the process must be excited by a
sufficiently "rich" signal (we can of course not expect to derive a dynamics model from constant
signals). The excitation can be made in two ways, refer to the figure shown above):
• Closed loop excitation. This means that the process is under feedback control. The
excitation is via the setpoint.
• Open loop excitation. This means that the process is not under feedback control. The
excitation is via the control signal.
In this application open loop excitation is used.
[Contents]
2.2 Exciting the process and measuring the response
excite_and_logg.vi shown below saves time t, input signal u and measured response y on the
spreadsheet file logfile1. t, u, and y are columns in this file. The sampling time is h = 0.02s
which is used both for analog output (control signal) and analog input (measurement signal)
throughout this application.
Front panel of excite_and_logg.vi
Block diagram of excite_and_logg.vi
Here is the log file from one specific experiment: logfile1. The columns in the file are t, u, y.
[Contents]
2.3 Estimating a mathematical model from logged data
A mathematical model of the motor in the form of a discrete-time transfer function is estimated
using the SI Estimate State Space Model function (which implements a Subspace-method which
is an efficient and generally applicable estimation method). This function is included in the
System Identification Toolkit. The function palette of this toolkit is shown below. The SI
Estimate State Space Model function is on the Parametric Modeling palette.
Functions palette of System Identification Toolkit
system_ident.vi shown below estimates a discrete-time transfer function model compatible with
the Control Design Toolkit, and saves the model on a file (or later use).
Front panel of system_ident.vi
Block diagram of system_ident.vi
[Contents]
2.4 Is the model accurate? Comparing process simulation and measurements
[Introduction to Simulation Module]
The functions palette of the Simulation Module is shown below.
The functions palette of the Simulation Module
In compare_process_simulation_and_measurements.vi shown below the estimated model is
further evaluated. The user excites both the simulated process and the real process with an
arbitrary input signal, and the simulated response and the real measurement are compared. Since
in general the linear model is valid only around an operating point, the model is excited by the
devation, du, from the operating point value, u0, of the input signal, and the simulated response
is thus the deviation, dy, from the operating point value, y0, of the output signal.
In other words:
• The input signal to the simulated process is du, while the total input signal to the physical
process is
u = u0 + du
where u0 is fixed and du is arbitrary, but small in amplitude.
• The response from the simulated process is dy_sim, while the response from the real
process is
y_meas = y0 + dy_meas
giving
dy_meas = y_meas - y0
The model is accurate if the difference between dy_meas and dy_sim is small!
Front panel of compare_process_simulation_and_measurements.vi
Block diagram of compare_process_simulation_and_measurements.vi
[Contents]
3 Control system analysis and design
3.1 Analysis of control system using Control Design Toolkit
[Introduction to Control Design Toolkit]
The function palette of the Control Design Toolkit is shown below.
Function palette of the Control Design Toolkit
The figure below shows a block diagram of the control system, including a measurement low
pass filter (which is a second order Butterworth lowpass filter). The blocks contains discrete-
time transfer functions (i.e. z-transfer functions).
Block diagram of the control system
control_analysis_design.vi shown below analyses the control system with respect to the
following:
• Bandwidth (loop transfer function crossover frequency)
• Gain Margin GM and Phase Margin PM
• Simulated step response in the process output variable y (due to a unit step in the
setpoint)
In addition, PID settings are calculated from the Ziegler-Nichols' closed-loop method interpreted
in the frequency domain.
Front panel of control_analysis_design.vi
[Contents]
3.2 Comparing simulated control system and real control system (target: PC)
real_and_simulated_control_system.vi shown below simulates a PID control system for the
estimated process model.
Front panel of real_and_simulated_control_system.vi
[Contents]
4 Implementing and testing the control system on the real-
time target (Compact FieldPoint)
rt_control_system.vi shown below implements the control system to be downloaded and run on
the FieldPoint system.
Front panel of rt_control_system.vi
Block diagram of rt_control_system.vi
[Contents]
April 24 2005. By Finn Haugen, Associate Professor at Telemark University College. Also working in TechTeach.
E-mail: