roadshow mexico city on 7 8 may 2014 thomas aebischer holcim group cfo and member of the executive committee urs birri cfo holcim mexico thomas rueger treasury relationship manager angel garcía de quevedo treasure
Bạn đang xem bản rút gọn của tài liệu. Xem và tải ngay bản đầy đủ của tài liệu tại đây (2.88 MB, 41 trang )
Strength. Performance. Passion.
© 2014 Holcim Ltd
Roadshow Mexico City on 7 – 8 May 2014
IFZ - MAS Corporate Finance 20_10 – Funding
December 7, 2012, 14.10 – 17.50
Thomas Aebischer – Holcim Group CFO and Member of the Executive Committee
Urs Birri – CFO Holcim México
Thomas Rüeger – Treasury Relationship Manager
Angel García de Quevedo – Treasurer Holcim México
Roadshow Mexico City, May 2014
© 2014 Holcim Ltd
© 2014 Holcim Ltd
Agenda
Strategy and positioning based on long-term growth
Holcim Leadership Journey
Results and outlook
Financial position and financing
Certificados Bursátiles / Transaction Summary
Footprint in Latin America
Merger of equals between Lafarge and Holcim
Roadshow Mexico City, May 2014
2
© 2014 Holcim Ltd
Holcim at a glance
130 cement plants
around 200 limestone quarries /
450 aggregates operations
1’150 RMX plants in the world
> 70’000 employees
over 5’000 own RMX trucks / more
than 3’000 subcontracted
over 1’600’000’000 cement bags sold
Presence on all five continents and in around 70 countries
2013 Net sales of CHF 19.7 bn and operating EBITDA of CHF 3.9 bn
Roadshow Mexico City, May 2014
3
© 2014 Holcim Ltd
Holcim’s Strategy House – base for value creation
Creation of Value
Mindsets
Strategy
Goal
Base
Product Focus
Geographic
Diversification
Local Management
Global Standards
People
Better
Cost
Management
Permanent
Marketing
Innovation
Human
Resources
Excellence
Corporate
Social
Responsibility
Sustainable
Environmental
Performance
Roadshow Mexico City, May 2014
4
© 2014 Holcim Ltd
Product focus – two core segments and their channels
Cement
Aggregates
Net sales CHF 19.7 billion
Cement Clinker
Product segments 2013 Net sales per segment 2013
206.9 million tonnes
production capacity
142 cement and grinding
plants
Sales: 138.9 million
tonnes
426 aggregates
plants
Sales: 154.5 million
tonnes
1,100 RMX plants
91 asphalt plants
Sales of ready-mix
concrete: 39.5 million m
3
Sales of asphalt: 8.9
million tonnes
Aggregates
Other construction
materials & services
10.9%
58.3%
30.7%
Op. EBITDA per segment 2013
Op. EBITDA CHF 3.9 billion
5.0%
83.5%
11.5%
Other Construction
Materials and Services
Roadshow Mexico City, May 2014
5
© 2014 Holcim Ltd
Holcim – well balanced global portfolio
Africa Middle East
Europe
Net sales per region 2013
15.6%
27.6%
35.9%
4.4%
16.5%
Europe
Sales volumes per region 2013
North America
Latin America
Africa Middle East
Asia Pacific
(million t or m
3
)
Net sales CHF 19.7 billion
Op. EBITDA per region 2013
Op. EBITDA CHF 3.9 billion
12.0%
22.9%
35.6%
6.9%
22.7%
• Cement 70.3
• Aggregates 25.2
• Ready-mix concrete 10.9
• Cement 25.0
• Aggregates 10.2
• Ready-mix concrete 8.0
• Cement 26.7
• Aggregates 74.1
• Ready-mix concrete 12.3
• Cement 11.7
• Aggregates 42.8
• Ready-mix concrete 7.5
• Cement 7.9
• Aggregates 2.2
• Ready-mix concrete 0.8
Asia Pacific
North America
Latin America
Roadshow Mexico City, May 2014
6
© 2014 Holcim Ltd
-4%
-2%
0%
2%
4%
6%
8%
10%
12%
0% 1% 2% 3% 4% 5% 6% 7% 8%
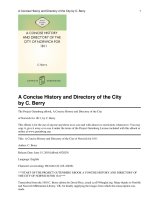
Positioning – Holcim’s cement market portfolio
Cumulated population
Growth 2013 - 2018E
Real GDP growth 2013 - 2018E
Western
Europe
24.8 Mt
Eastern
Europe
22.9 Mt
Africa
Middle East
23.5 Mt
Mature markets Emerging markets
Size of circles represents influenced capacity 2013
North
America
22.0 Mt
India
60.5 Mt
China
67.6 Mt
Asia Pacific excl.
India, Oceania,
China
43.7 Mt
Latin
America
35.5 Mt
Demand
growth
Oceania
2.6 Mt
Sources: Holcim, Business Monitor International, IMF: World Economic Outlook, January 2014
Roadshow Mexico City, May 2014
7
© 2014 Holcim Ltd
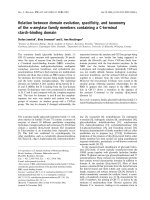
Positioning – Holcim’s aggregates market portfolio
-4%
-2%
0%
2%
4%
6%
8%
10%
12%
0% 1% 2% 3% 4% 5% 6% 7% 8%
Western Europe
65.3 Mt
Africa Middle East
2.2 Mt
Latin
America
10.2 Mt
North
America
42.8 Mt
Asia excl. Oceania
2.4 Mt
Mature markets Emerging markets
Size of circles represents consolidated sales volumes 2013
Eastern
Europe
8.8 Mt
Demand
growth
Cumulated population
Growth 2013 - 2018E
Oceania
22.8 Mt
Real GDP growth 2013 - 2018E
Sources: Holcim, Business Monitor International, IMF: World Economic Outlook, January 2014
Roadshow Mexico City, May 2014
8
© 2014 Holcim Ltd
Agenda
Strategy and positioning based on long-term growth
Holcim Leadership Journey
Results and outlook
Financial position and financing
Certificados Bursátiles / Transaction Summary
Footprint in Latin America
Merger of equals between Lafarge and Holcim
Roadshow Mexico City, May 2014
9
© 2014 Holcim Ltd
The five areas of operating profit growth by 2014
Customer Excellence
CHF 500 million
Energy and AFR
> CHF 300 million
Logistics
> CHF 250 million
Procurement
> CHF 250 million
Fixed cost
> CHF 200 million
Operating Profit
> CHF 1,500 million
Roadshow Mexico City, May 2014
10
© 2014 Holcim Ltd
Holcim Leadership Journey is on track
All figures in million CHF
Customer Excellence 31 135 118 284 500
- Customer focus
- Value management
- Pricing policies
- Marketing and sales forces skills and motivation
Cost Leadership 127 808 119 1,054 > 1,000
- Energy and AFR 40 187
31
258
> 300
- Logistics 0 162
25
187
> 250
- Procurement 48 203
41
292
> 250
- Fixed cost 39 255
22
316
> 200
Total increase
1)
158 943 237 1,338 > 1,500
Cash cost to achieve the savings (one-off) 239
3)
000
Additional CAPEX net
2)
48 170 17 235 100-180
3) Original amount w as projected < CHF 120 million f or 2013; having spent already CHF 239 million, no additional restructuring cash costs are foreseen at this stage
achieved achieved Q1
2014
cum. Target
achieved
cumulative since
2012
2012 2013
1) The base line is the financial year 2011 amounting to CHF 2,308 million (excluding one-off charges 2011 of CHF 375 m and w ithout fluctuations in currency, changes
in scope of consolidation and similar market conditions). Adjusted for the sale of 25% of Cement Australia and Siam City Cement, the new base is CHF 2'193 million.
2) Additional CAPEX net w ill come from prioritization of CAPEX based on the speed of the returns (ROIC).
Current energy fund of CHF 100 million w ill be maintained through the period 2012 - 2014.
Roadshow Mexico City, May 2014
11
© 2014 Holcim Ltd
Agenda
Strategy and positioning based on long-term growth
Holcim Leadership Journey
Results and outlook
Financial position and financing
Certificados Bursátiles / Transaction Summary
Footprint in Latin America
Merger of equals between Lafarge and Holcim
Roadshow Mexico City, May 2014
12
© 2014 Holcim Ltd
Consolidating a sustainable, profitable business in Latin
America
• Some 2013 figures
• Sales volume:
25.0 Mio t cement
(18% of Holcim Group)
10.2 Mio t aggregates (7% of Holcim Group)
8.0 Mio m
3
ready-mix concrete (20% of Holcim Group)
• Net Sales: CHF 3’349 Mio (17% of Holcim Group)
• Op. EBITDA: CHF 938 Mio (24% of Holcim Group)
• Op. EBITDA Margin: 28.0%
20 cement plants
7 grinding stations
18 AGG quarries
119 RMX plants
Roadshow Mexico City, May 2014
13
© 2014 Holcim Ltd
Holcim has build its current leading strategic footprint over
the last 60 years
• 1953 Brazil
• 1964 Mexico
• 1969 Colombia
• 1970 Costa Rica
• 1975 Chile
• 1976 Ecuador
• 1993 Argentina
• 1997 Nicaragua
• 1998 El Salvador
Bubbles size according to 2020 national cement demand estimates Indicates Holcim country presence
Roadshow Mexico City, May 2014
14
© 2014 Holcim Ltd
Sustainably developing through fit for purpose solutions
Holcim has proven its ability to adapt to local conditions…
…with service excellence & innovation
Los Bronces - Chile
Estadio Maracanã - Brazil
Bogota Airport - Colombia
Roadshow Mexico City, May 2014
15
© 2014 Holcim Ltd
Sustainably developing through fit for purpose solutions
Holcim has proven its ability to adapt to local conditions…
…while allocating funds to capture growth opportunities
Nobsa
Hermosillo
Barroso
Guayaquil
Roadshow Mexico City, May 2014
16
© 2014 Holcim Ltd
Main projects under construction – Brownfield at Barroso
plant in Brazil and clinker line in Guayaquil plant Ecuador
Brazil
• Scope: 4.500 t/d clinker, 2 vertical roller mills
(VRM), clinker silo (35’000 t) and cement silos
(2 x 8’000 t)
• Planned commissioning: 2Q15
Ecuador
• Scope: 2
nd
stage of Guayaquil plant expansion,
with tie ins to existing equipment, specially the
newly commissioned cement vertical roller mills
• Planned commissioning: 2Q15 (3 years after
contract signature)
Screening building - Brazil
Clay transport to feed bins building
Roadshow Mexico City, May 2014
17
© 2014 Holcim Ltd
Holcim México market leadership
• Holcim México has been a subsidiary of Holcim since
1964
• In 2004, Holcim Group acquired 31% of the remaining
shares of Holcim México, becoming the sole shareholder
• In 2013, the name of the company changed from Holcim
Apasco to Holcim México
• Holcim México employs more than 3,000 people
• Holcim México occupies the 2
nd
place in Mexican market,
based on annual cement production capacity
• National coverage under one name
• 7 cement plants
• 23 distribution centers
• 50 ready-mix plants
• 3 aggregate plants
Roadshow Mexico City, May 2014
18
© 2014 Holcim Ltd
Agenda
Strategy and positioning based on long-term growth
Holcim Leadership Journey
Results and outlook
Financial position and financing
Certificados Bursátiles / Transaction Summary
Footprint in Latin America
Merger of equals between Lafarge and Holcim
Roadshow Mexico City, May 2014
19
© 2014 Holcim Ltd
Key financial figures – Q1 2014
Full year
2013 2013 2014
LFL CIS FX Total
Sales volumes
- Cement (mt)
138.9 32.1 33.0 4.4% -1.5% 2.9%
- Aggregates (mt)
154.5 28.6 29.2 3.5% -1.3% 2.2%
- Ready-mix (mm
3
)
39.5 8.4 8.2 1.1% -3.1% -2.0%
Net sales
19,719 4,323 4,088 7.8% -2.5% -10.7% -5.4%
Operating EBITDA
3,896 650 617 10.1% -2.0% -13.3% -5.1%
Operating profit
2,357 270 295 28.4% 1.9% -20.9% 9.3%
Net income
1,596 295 179 -39.5%
1,272 187 80 -57.5%
Cash flow from operating
activities
2,787 -323 -243 28.2% -6.0% 2.7% 24.9%
EPS in CHF
3.91 0.58 0.24 -58.6%
Million CHF
(if not otherwise stated)
1st Quarter
+/-
Net income - shareholders
of Holcim Ltd
Roadshow Mexico City, May 2014
20
© 2014 Holcim Ltd
Operating EBITDA by region
1700
1789
1473
888
960
938
312
278
283
Million CHF
∆ 2012 / 2013 LFL Change in
structure
Currency Total
Asia Pacific
-6.3% -5.0% -6.4% -17.7%
Latin America
1.3% 0.0% -3.6% -2.3%
Europe
55.8% -2.2% 0.2% 53.8%
North America 5.5% -0.2% -2.3% 3.0%
Africa Middle East
2.6% -1.9% 0.7% 1.4%
Total 7.0% -2.8% -4.0% 0.2%
930
615
946
346
480
494
2011 3,958
2012 3,889
2013 3,896
Roadshow Mexico City, May 2014
21
© 2014 Holcim Ltd
• Holcim expects cement volumes to increase in all Group regions
• Aggregates volumes expected to remain flat overall as increases in
Asia Pacific, Europe, North America, and Africa Middle East are offset
by negative volumes in Latin America
• Ready-mix concrete volumes also expected to increase in most
regions with the exception of Europe and Latin America
• Holcim expects that organic growth in operating profit can be
achieved in 2014
• The ongoing focus on the cost base coupled with all the benefits
expected from the Holcim Leadership Journey will lead to a further
expansion in operating margins
Outlook for 2014
Roadshow Mexico City, May 2014
22
© 2014 Holcim Ltd
Agenda
Strategy and positioning based on long-term growth
Holcim Leadership Journey
Results and outlook
Financial position and financing
Certificados Bursátiles / Transaction Summary
Footprint in Latin America
Merger of equals between Lafarge and Holcim
Roadshow Mexico City, May 2014
23
© 2014 Holcim Ltd
0
500
1'000
1'500
2'000
2'500
3'000
<1y 1-2y 2-3y 3-4y 4-5y 5-6y 6-7y 7-8y 8-9y 9-10y>10y
Loans Capital markets
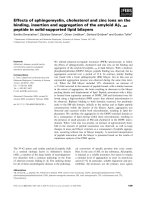
Financial debt, maturities and liquidity as of March 31, 2014
Maturity profile
1
(mCHF)
1
After risk-related adjustments of CHF 392 million from current financial
liabilities to long-term financial liabilities
Liquidity summary
• Cash + marketable securities: CHF 2,016 million
• Cash + marketable securities + unused committed
credit lines: CHF 6,558 million
Debt summary
• Current financial liabilities
1
: CHF 2,493 million
• Fixed to floating ratio: 58% to 42%
• Capital markets 79%; Loans 21%
• Corporate vs. subsidiary debt: 81% to 19%
• Ø total maturity: 5.2 years
• CP borrowings: CHF 466 million
• No financial covenants in Corporate credit lines
ST/LT ratings summary as of April 28, 2014
• S&P Credit Rating: A-2 / BBB, outlook stable
• Fitch Credit Rating: F2 / BBB, outlook stable
• Moody’s Credit Rating: P2 / Baa2, outlook negative
24
Roadshow Mexico City, May 2014
24
© 2014 Holcim Ltd
Overall debt reduced by CHF 6.6 billion since 2008
Share of capital market financing at around 80%
Loans
Capital markets
Share of capital market financing (r.h. scale)
0%
20%
40%
60%
80%
100%
0
4'000
8'000
12'000
16'000
20'000
2008 2009 2010 2011 2012 2013 Q1 2014
Financial liabilities
CHF million
Share of capital market financing
25
Roadshow Mexico City, May 2014
25