third quarter results 2011 and outlook presentation of november 9 2011 holcim ltd switzerland the spoken word prevails
Bạn đang xem bản rút gọn của tài liệu. Xem và tải ngay bản đầy đủ của tài liệu tại đây (531.48 KB, 22 trang )
!
Presentation
of
November
9,
2011
Markus Akermann, CEO
Thomas Aebischer, CFO
The spoken word prevails.
"
Better results in third quarter and organic growth
Higher sales volumes in cement, aggregates and ready-mix
concrete over nine months and in the third quarter
Latin America and Asia Pacific on growth path
Europe and North America lack key stimuli
Strong Swiss franc impacts operating EBITDA by
CHF 458 million
Declining operating EBITDA due to cost increases which
could not yet be passed on completely to sales prices
Like-for-like operating EBITDA is expected to be close to
last year's level
!
#$
1) Holcim achieved better results in this year’s third quarter compared wi
th the January-September 2011
reporting period, with four of the five Group regions achieving organic gr
owth. Both third quarter and nine
months sales volumes for cement, aggregates and ready-mix concrete
increased. Only asphalt declined
slightly. Many emerging markets enjoyed brisk construction activity. How
ever, in the eurozone and in North
America, growth mainly remained restrained. The strong Swiss franc im
pacted operating EBITDA by 458
Million Swiss francs.
Also, still outstanding sales of CO2 emissions certif
icates in Europe compared with the
previous year had a negative influence. Costs which could be influenced
were nevertheless kept well under
control. As per end of September, there was a decline in operating EBIT
DA due to above-average inflation
for energy, transport and raw materials. These cost increases could, for t
he time being, only partially be
passed on to sales prices, due to strong competitive pressures in many
markets. On a like-for-like basis,
operating EBITDA was higher than last year in Latin America and Asia P
acific. Europe fared less well, mainly
because of still outstanding sales of CO2 certificates. In the US, the ong
oing insufficient demand for
construction materials and the stabilization of prices at a low level both i
mpacted results.
Higher sales of cement and aggregates in Europe
" % """& % '(
) ' '*
" ' +, -',
! , % .
.
' /', 01&
% '()
" ' 2 ' 3 2'
4" .5/67 2' " %
84
9
4" "
2
©2011Holcim Ltd/Switzerland
ResultsQ3 2011
2) In Group region Europe, demand increased. However, there was still a lack of concrete intensive pr
ojects.
More construction work was ongoing in France, Germany, Switzerland and Russia, primarily in the Gr
eater
Moscow area. In Group region Europe, Holcim sold more cement and aggregates in the first nine mo
nths of
2011, despite the difficult market situation in Spain. Ready-mix concrete deliveries nearly matched the
previous year's level. Aggregate Industries UK experienced a decrease in asphalt volumes. The mark
et
situation remained difficult in Italy and Spain. In Italy there were deconsolidations in the aggregates a
nd
ready-mix concrete business, while in Spain our Group company decided to close 25 ready-mix
concrete
plants. In Eastern and Southeastern Europe a few infrastructure projects made a positive impact on d
emand.
Most Group companies increased their shipments of cement. About a week ago we have increased o
ur
minority stake in a company in Eastern Slovakia, which owns a cement plant and several aggregates
and
ready-mix concrete operations, into a majority. This complements our network in this region.
Operating
EBITDA for Group region Europe decreased. The results were depressed by the weak euro and the s
till
outstanding sales of CO2 emissions certificates. Many Group companies were only partially able to of
fset the
rise in energy, distribution and raw material costs with price increases.
2
"': ::::2: ::::2": ::::: ::::: ::::: ::::: ::::7
Higher sales volumes in all segments thanks to US road-
building
Full takeover of Lattimore Materials in Texas strengthened
sales of aggregates and ready-mix concrete
Holcim Canada felt the decline in construction activity in all
relevant markets
Operating EBITDA impacted by increased production costs
amid relatively stable prices and expenses incurred by
temporary closure of the Catskill plant
!
$
#$
3) There is still a lack of important stimuli in the US construction sector. However, public road-building
did
create some activity, primarily in the third quarter. Canada's economy developed weakly in those mar
kets
relevant to us. In August, cement sales by Holcim US exceeded one million tonnes for the first time si
nce
October 2008. Demand remained generally weak in the southern US states. Aggregate Industries US
significantly increased its deliveries of aggregates, ready-mix concrete and asphalt. The full takeover
of
Lattimore Materials in March of this year strengthened the Group company's market presence in Texa
s. On
balance, Holcim Canada sold less cement and ready-mix concrete. Volumes increased in the
aggregates
segment, but there was less demand for high-grade gravel, and prices came under pressure.
Operating
EBITDA for Group region North America fell. All three Group companies were below the previous yea
r's
results. Higher energy and distribution costs had a negative impact on the operating result of Holcim
US
despite the relatively stable level of prices in local currency. Expenses were also incurred for the temp
orary
closure of the Catskill plant. Due to increased production costs Aggregate Industries US recorded low
er
results. At Holcim Canada, rising price pressure, particularly in the ready-mix concrete business, and
higher
cement manufacturing costs had a negative impact on financial results.
Solid markets in Latin America
5" ' '
% ;, ' 5!,
7", 8 82
7 - """&
'() "9'
4" .5/67 2' " "'
2 % ' 2
%' ;, " %
4" " ,
'
4
©2011Holcim Ltd/Switzerland
ResultsQ3 2011
4) In Latin America, the economy made positive headway in most countries. Numerous infrastructure
projects supported demand for building materials. All Group companies sold more cement and nearly
all also
increased their sales of aggregates and ready-mix concrete. The Mexican construction sector
recovered
slightly due to the national infrastructure plan and private house-building activity. Holcim Apasco sold
more
building materials in all segments. The expansion of grinding capacity at the Nobsa plant allowed Hol
cim
Colombia to sell more cement. Holcim Ecuador also increased deliveries of construction materials du
e to
brisk road-building and infrastructure activity. Indeed demand was such that clinker had to be bought
in
occasionally. Due to the high capacity utilization rate, Holcim Brazil concentrated on sales of higher v
alue
cement types; deliveries of aggregates and ready-mix concrete remained stable. Argentina's
construction
sector benefited from public sector investment ahead of the presidential elections. In a difficult compe
titive
environment, Cemento Polpaico in Chile experienced good volume growth in all segments. As a resul
t of
rising energy costs, higher distribution costs and the fact that prices could not yet be adjusted everyw
here,
operating EBITDA declined despite the volume growth. The strong Swiss franc impacted above all on
the
results of the Group companies in Mexico, Ecuador and Argentina. The Group region nevertheless gr
ew
organically – on a nine-month basis and in the third quarter.
3
0" 2 7% < .
Solid construction activity in Morocco, Lebanon and some
parts of the Indian Ocean region
New competitors depressed cement and aggregate sales at
Holcim Morocco
Despite project delays at construction sites in Beirut, Holcim
Lebanon sold more cement and ready-mix concrete
Positive volume development in the Indian Ocean region
Operating EBITDA declined primarily due to the currency
impact, but was clearly positive in the third quarter
=
!
#$
5) In Morocco and Lebanon, the two most important markets for Holcim in this Group region, construc
tion
activity remained brisk. Construction activity was also fairly buoyant in the Indian Ocean region. Due t
o new
competitors, Holcim Morocco sold less cement and aggregates. However, a clear increase was achie
ved in
sales of ready-mix concrete. Despite some project delays at construction sites in Beirut, Holcim
Lebanon
sold slightly more cement and ready-mix concrete. The companies in the Indian Ocean sold more
cement
and ready-mix concrete. The Group companies in Mauritius, La Réunion and Madagascar witnessed
positive
volume development. The operating EBITDA of Group region Africa Middle East declined primarily du
e to
the currency impact. However, organic growth was achieved in the third quarter.
Continuing volume growth in Asia Pacific
7 % "
/ 4, % ( ;
" % / /,
% """ 7
" 2 , >,
", / 7
/? 2 %
4(3 % % 1 7
4" .5/67 " %& "
" % - "
6
©2011Holcim Ltd/Switzerland
ResultsQ3 2011
6) The Asian markets remained on their path. Public spending on infrastructure was important, but pri
vate
residential and commercial construction activity also developed very positively. In Oceania, constructi
on
activity failed to gain real momentum. Due to additional capacity, ACC in India achieved a significant
increase in cement volumes. Ambuja Cements also increased its deliveries. Siam City Cement in Thai
land
saw a rise in sales in all segments in the growing domestic market, while in Indonesia the construction
sector
remained on track for dynamic growth due to government infrastructure projects and expansion work i
n the
industrial sector. Across its whole product range, Holcim Indonesia sold significantly more building ma
terials.
The Philippine construction sector felt the lack of public sector investment activity. The situation nevert
heless
improved slightly from August onward. Construction activity in Oceania remained subdued. In Australi
a,
there was a lack of cement and concrete intensive projects. Road-building in the aftermath of the
floods
impacted positively on cement demand only from the third quarter. On balance, Cement Australia ther
efore
sold less cement. Holcim Australia delivered more aggregates on both the east and west coasts. Ope
rating
EBITDA in Group region Asia Pacific decreased. Stronger results were achieved above all by the Gro
up
companies in Thailand, Vietnam, Malaysia, Singapore and Indonesia. Like-for-like, ACC exceeded its
previous year result. However, it proved impossible to pass on the full impact of inflation to prices. Ce
ment
Australia incurred one-off costs for the closure of the Kandos plant. The strong Swiss franc depressed
the
results of all Group companies, and reduced operating EBITDA. Like-for-like, ACC – the biggest
Group
company – exceeded its previous year result. The Group region also grew in organic terms.
4
+ "' @'
Fund for promotion of innovative approaches to improving
energy efficiency set up in 2010
A component of the Group's comprehensive energy strategy
Roughly CHF 100 million at its disposal on annual basis
Emphasis for approved projects:
' % '
7 % % %
A % '
Fund
financed
by
receipts
from
sale
of
surplus
CO
2
emissions certificates
!
B
#$
7) Concrete is a highly energy- and CO2-efficient building material. Globally, it is the second most
consumed
commodity by volume after water, and vital to a functioning infrastructure. Production of the intermedi
ate
product cement is, however, energy-intensive – with thermal and electrical energy accounting for
approximately 40 percent of the cost of production. In US dollar terms, energy costs have risen by aro
und 8
percent per year over the last five years. In addition, CO2 emissions occcur – 60 percent of which are
caused by the chemical conversion of stone in the rotary kiln and 40 percent by the use of fossil fuels.
Because the European cement industry currently emits less CO2 than it is entitled to, large sums of
money
are raised each year from the sale of excess emissions certificates. The reasons are well-known:
sluggish
European growth, but also the industry's ongoing endeavors to boost the energy efficiency of its plant
s and
reduce the clinker factor in cement. Holcim is known for its leading role in these areas in particular. H
olcim
could simply record the proceeds – normally some 100 million Swiss francs every year – as income.
However, we decided to allocate these sums to an Energy Fund that we launched in 2010. The Fund
should
help ensure the realization of innovative projects across the Group in the field of heat recovery, the uti
lization
of alternative fuels and raw materials, as well as wind power and hydroelectricity. The objective is clea
r: to
save fossil fuel sources and boost energy efficiency, resulting in an improvement in our environmental
footprint and a reduction in production costs; this is particularly important against the backdrop of risin
g
global energy costs. The Energy Fund is an element in the Group's comprehensive strategy for count
ering
these cost pressures. Holcim has produced a list of criteria for the assessment of projects to be financ
ed.
The emphasis is on economic efficiency – as investments need to be amortized within around one-
third of
their lifetime – but also on the potential to reduce CO2
and the possibility of multiplying innovations s
peedily
and successfully across the Group. The creation of the Fund led to competition between the Group
companies to produce the best project proposals, and sparked a whole series of new approaches for
sustainable energy projects.
Reduction
of
200,000
tonnes
in
annual
84
emissions
Lägerdorf(Germany)
Mississauga(Cana
da)
Waste heatrecove
ry
84
reduction:
4,800tonnesp.a.
Técoman(Mexico)
Waste heatrecove
ry
84
reduction:
10,800tonnesp.a.
Untervaz
(Switzerland)
Waste heatrecovery
84
reduction:
400tonnesp.a.
Héming(France)
Alternativefuels
CO2
reduction:
3,800tonnesp.a.
Alternativefuels
84
reduction:
37,800tonnesp.a.
Chekka(Lebanon)
Waste heatrecovery
84
reduction:
10,200tonnesp.a.
Rabriyawas(India)
Waste heatrecover
y
84
reduction:
25,900tonnesp.a.
Rohoznik(Slovakia)
Waste heatrecovery
84
reduction:
14,500tonnesp.a.
Alesd(Romania)
Waste heatrecovery
84
reduction:
11,300tonnesp.a.
HonChong(Vietnam)
Waste heatrecovery
84
reduction:
25,900tonnesp.a.
Gagal(India)
Waste heatrecovery
84
reduction:
57,600tonnesp.a.
©2011Holcim Ltd/Switzerland
8
ResultsQ3 2011
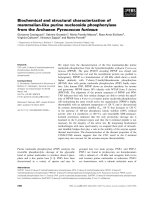
8) Last year saw funds earmarked for five heat recovery plants in Vietnam, India, Romania, Lebanon
and
Switzerland. These installations are under construction and will be commissioned between the end of
2011
and 2013. Six projects were approved this year. They include four waste heat recovery units in Canad
a,
Slovakia, Mexico and India, as well as two installations for the utilization of alternative fuels and raw
materials in Germany and France. These facilities will be commissioned in 2013 and 2014.
Once co
m pleted,
these units will produce a cumulative 36 megawatts o
f electricity – equivalent to the electricity needs of a
very large cement plant. All in all, Holcim will save around 200,000 tonnes of CO2 annually as a resul
t of the
projects approved to date. That is approximately as much as one sixth of the annual CO2-emissions
of the
city of Zurich.
5
.) % *
-", /
!
7 %
C
#$
9) A waste heat recovery power station is currently under construction at ACC's Gagal plant in the
mountainous region of Himachal Pradesh, India. The new facility brings many benefits:
energy saving
s, and
therefore lower production costs, reduced CO2 emissions, as well as a more reliable supply of electric
ity with
low and stable costs. All this is possible without any negative implications for production. The waste h
eat
recovery power station will utilize waste heat from the pre-heater tower and clinker cooling system.
The
steam generated is used to drive a turbine, which is coupled to a generator. Commissioning is likely to
take
place in the third quarter of 2012. The power station will produce 7 megawatts of electricity on a gross
basis
Million
CHF
(ifnototherwisestated)
Full
Year 9M +/-
2010 2010 2011
LFL CIS FX Total
A ' Lägerdorf,
Germany
- Ready-mix (mm ) 45.9 34.4 36.1 1.9% 3.1%
5.0%
or around 44 gigawatt hours on a net basis every year; this represents 12 to 14 percent of the Gagal p
lant's
annual energy consumption. The investment amounts to nearly USD 17 million. Another innovative pr
oject
for the more efficient use of alternative fuels and raw materials is being undertaken by Holcim Germa
ny at its
cement plant in Lägerdorf. The project – being carried out in cooperation with Polysius, a subsidiary of
Thyssen Krupp – is at a very advanced stage. The plan is for a multi-stage combustion chamber at
the kiln
entrance, which – unlike conventional chambers – is able to utilize poorly combustible and bulky alter
native
fuels. Work on the new plant is scheduled for completion in 2013. Due to the higher proportion of alter
native
fuels and raw materials in the Lägerdorf facility's energy mix, around 38 000 tonnes of CO2 should be
saved
annually once it is commissioned.
- Cement (mt) 136.7
102.8
108.1 5.2% 0.0% 5.2%
- Aggregates (mt) 157.9
118.8
130.4 5.1% 4.7% 9.8%
3
Net sales 21,653
16,568
15,461 5.8% 0.8%
-13.3%
-6.7%
Operating EBITDA 4,513
3,577
2,971 -4.4% 0.2%
-12.8%
-16.9%
Operating profit 2,619
2,178
1,753 -6.4% -0.3%
-12.8%
-19.5%
Net income before
minorities 1,621
1
1,223
Net income
Holcim shareholders 1,182
1
875
1
1,004 -5.1% -0.2%
-12.7% -17.9%
1
713 -6.3% -0.2%
-11.9% -18.5%
Cash flow 3,659
2,053 930
-47.1% -0.8%
-6.8%
-54.7%
EPS in CHF 3.69 2.73 2.23 -18.3%
1
Includinganon-recurringcash-neutraltaxchargeofUSD171million
6",2"''D7
"'"D
!
#$
10) Sales volume increased in all product segments. Group net sales decreased by 6.7 percent to 15.
5
billion Swiss francs while operating EBITDA declined by 16.9 percent to just below 3 billion Swiss fran
cs,
reflecting the strong appreciation of the Swiss franc and rising input costs. Net income declined by 18.
5
percent to 713 million Swiss francs as a result of the decrease in operating profit.
6
8 E 2
' "
Million t
20.9
20.1
20.6
Total Group
9M 2009
99.1
9M 2010 102.8
9M 2011 108.1
8.
3
8.4
8.5
49.9
53.2
56.2
17.1
16.8
18.0
6.5
6.8
6.6
∆ 9M10/9M11 LFL Change in
Total
!
structure
Europe 2.3% 0.0% 2.3%
North America 1.2% 0.0% 1.2%
Latin America 6.7% 0.0% 6.7%
Africa Middle East -4.7% 0.0% -4.7%
Asia Pacific 5.7% 0.0% 5.7%
Total 5.2% 0.0% 5.2%
#$
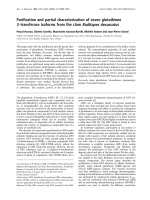
11) Consolidated cement volume increased by 5.2 percent to 108.1 million tonnes in the first nine mo
nths.
Regionally Latin America and Asia Pacific posted the biggest volume increase, followed by Europe a
nd
North America. Africa Middle East was the only region that experienced declining sales volume. Key
drivers
to the increase included ACC and Ambuja Cements in India and the Group companies in Indonesia.
Additionally, Colombia in the Group Region Latin America as well as France/Belgium, Germany and
Russia
in the Group Region Europe were strong contributors to the overall volume increase.
Aggregates E Sales volumes by region
Sales volumes
1' 9 9"
<
29
.7
28.8
31.9
59.6 59.5
1.9
1.9
63.6
1.7
-
C< C $D
C< FDF
C< $DG
22.3
19.6
3.1
8.9
9.0
10.9
∆ 9M10/9M11 LFL Change in
structur
e
Total
©2011Holcim Ltd/Switzerland
Europe 1.8% 5.1% 6.9%
North America 2.2% 8.8% 11.0%
Latin America 21.4% 0.0% 21.4%
Africa Middle East -9.0% 0.0% -9.0%
Asia Pacific 13.5% 0.0% 13.5%
Total 5.1% 4.7% 9.8%
12
ResultsQ3 2011
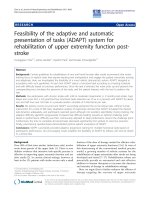
12) Sales of aggregates increased by 9.8 percent to 130.4 million tonnes, driven by the acquisitions o
f
Lattimore Materials in the US and the assets in Alsace (France). In addition, solid internal growth in L
atin
America, Australia and Europe contributed to an overall like-for-like volume increase of 5.1 percent.
'() E 2' "
Million m
3
/t
Total Ready-mix
13.0
12.4
12.2
9M 2009
30.4
4.
1
3.9
4.2
5.1
4.2 4.4 4.2
9M 2010
34.4
9M 2011
36.1
0.
8
0.8 0.8
9.3
9.8
4.9
7.6
7.7
8.2
∆ 9M10/9M11* LFL
Change in
Total
Total Asphalt
9M 2009 8.1
9M 2010 7.8
9M 2011 7.6
*
Ready-mixconcreteonly
!
structure
Europe -1.6% 0.3% -1.4%
North America -3.3% 24.4% 21.0%
Latin America 7.1% 0.0% 7.1%
Africa Middle East 4.0% 0.0% 4.0%
Asia Pacific 4.5% 0.0% 4.5%
Total 1.9% 3.1% 5.0%
$
#$
13) Ready-mix volume increased by 5.0 percent to 36.1 million cubic meters, with the first time
consolidation
of Lattimore Materials in the US contributing to this result. On a like-for-like basis, volumes increased
by 1.9
percent. Solid demand in Indonesia, Thailand and most of Latin America strongly supported overall in
ternal
growth. Asphalt volumes declined by 2.2 percent to 7.6 million tonnes.
7
.)"
Statement
of
income
9M
10
9M
11
+/-
1 EUR 1.51 1.40 1.24 -11.4%
1 GBP 1.71 1.63 1.42 -12.9%
1 USD 1.11 1.06 0.88 -17.0%
1 LATAM Basket (MXN, BRL, ARS, CLP)
1
0.96 1.00 0.87
-13.0%
1 Asian Basket (AUD, IDR, INR, THB, PHP)
1
0.93 1.00 0.89
-11.0%
Statement
of
financial
position
exchange
rates
in
CHF
30/09/10 30/12/10
30/09/11
+/-
3.4
3.5
average
exchange
rates
in
CHF
9M
09
1 EUR 1.33 1.25 1.22 -2.4%
1 GBP 1.55 1.45 1.40 -3.4%
1 USD 0.98 0.94 0.90 -4.3%
1 LATAM Basket (MXN, BRL, ARS, CLP)
2
1.03 1.00 0.87
-13.0%
1 Asian Basket (AUD, IDR, INR, THB, PHP)
2
1.03 1.00 0.91 -9.0%
1
Weightedwithnetsales9M2011
2
Weightedwithnetsalesfullyear2010
!
G
#$
Foreign exchange rate impact
< 8+
Net sales impact
Operating EBITDA impact
Sales impact
EBITDA impact
86
139
1.8%
2.5%
1.7%
40
2.9%
-
1
7
9
-
3.
1
%
-32
-2.2%
-
228
-4.3%
-42
-4.1%
-73
-8.0%
-181
-14.2% -14.7%
-435
-9.2%
-916
-854
-14.9%
-15.1%
Q1 2010 Q2 2010 Q3 2010 Q4 2010 Q1 2011 Q2 2011 Q3 2011
15
©2011Holcim Ltd/Switzerland
ResultsQ3 2011
15) The strong appreciation of the Swiss franc during the first half of 2011 continued to negatively imp
act the
financial results during the quarter under review, albeit to a lesser extent than during the second quart
er.
Sales were reduced by some 854 million Swiss francs and operating EBITDA recorded a negative imp
act of
181 million Swiss francs. During the first nine months of 2011 sales were reduced by some 2.2 billion
Swiss
francs, or minus 13.3 percent and operating EBITDA recorded a reduction of 458 million Swiss francs,
or
minus 12.8 percent.
Million CHF
15,774
16,568
15,461
Like-for-Like
(LFL) -2,000
-10.3% -358
-2.3% 967
5.8%
Change
in
structure -134
-0.7% 1,106
7.0% 130
0.8%
Forex
movements -1,432
-7.4% 46
0.3% -2,205
-13.3%
Total
change
3,566
-18.4%
794
5.0% -1,107
-6.7%
9M
2009 9M
2010 9M
2011
H
!
#$
16) Total consolidated net sales amounted to 15.5 billion Swiss francs, a decrease of 6.7 percent. Excl
uding
13
-203
the negative impact from currency movements and changes in scope of consolidation, like-for-like net
sales
increased by 5.8 percent. This reflects the improvement in volume across all segments and prices in
many
markets.
8
2' "
Million CHF
9M 2009
9M 2010
5664
51
36
4691
9M 2011
26
26
2449
2151
4538
6020
5929
91
7
849
706
∆ 9M10/9M11 LFL
Change in
Currency Total
25
27
2587
2467
structure
Europe 1.9% 0.3% -10.9% -8.7%
!
Net sales by regio
n
Net sales 9M 2011
7
$D=I
7
=D=
I
©2011Holcim Ltd/Switzerland
North America -1.0% 4.7% -15.8% -12.1%
Latin America 10.7% 0.0% -15.3% -4.6%
Africa Middle East -3.1% 0.0% -13.8% -16.9%
Asia Pacific 12.4% 0.0% -13.9% -1.5%
Total 5.8% 0.8% -13.3% -6.7%
B
#$
.
CDGI
7 J9
$BDI
7% < .
GDGI
18
ResultsQ3 2011
18) Compared to the first nine months of 2010, the share of group net sales increased in Asia Pacific
to 37.2
percent and in Latin America to 15.5 percent, while Europe, North America, and Africa Middle East
experienced a decline of their share of group net sales at the same time. While the change of shares i
s
clearly impacted by the previously mentioned appreciation of the Swiss franc, it also reflects the unde
rlying
regional developments with both Asia Pacific and Latin America posting double-digit like-for-like
growth rates
compared to the other regions that witnessed either low growth or even slight negative developments.
Operating EBITDA
< 8+
<"
22.9%
21.6%
19.2%
3,614
3,577
2,971
Like-for-Like (LFL) -317 -7.3% -241
-6.7% -156 -4.4%
Change in structure -93 -2.1% 183 5.1% 8 0.2%
Forex movements -341 -7.8% 21 0.6% -458
-12.8%
Total
change -751
-17.2% -37
-1.0% -605
-16.9%
9M 2009 9M 2010 9M 2011
19
©2011Holcim Ltd/Switzerland
ResultsQ3 2011
19) Operating EBITDA decreased by 16.9 percent to just below 3 billion Swiss francs. Excluding the
currency impact and change in structure, the operating EBITDA declined by 4.4 percent. Higher varia
ble and
fixed costs more than offset the improved volumes and prices, resulting in the lower operating EBITD
A.
Adding to this decline are the still outstanding sales of CO2 emission certificates. Proceeds from the s
ales of
emission allowances amounted to only 11 million Swiss francs compared to 75 million Swiss francs in
the
first nine months of the previous year. Accordingly the operating EBITDA margin declined from 21.6 p
ercent
to 19.2 percent. On a like-for-like basis, thus excluding the currency impact and change in structure,
the
margin was at 19.5 percent.
9
4" .5/67 2' "
Million CHF
1035
1
855
707
9M 2009
9M 2010
9M 2011
328
366
264
1306
1439
1264
81
8
762
662
279
286
237
∆ 9M10/9M11 LFL
Change in
Currency Total
!
structure
Europe -9.4% 0.4% -8.3% -17.3%
North America -17.1% 1.3% -12.3% -28.0%
Latin America 1.6% 0.0% -14.7% -13.1%
Africa Middle East -3.7% 0.0% -13.3% -17.0%
Asia Pacific 1.1% 0.0% -13.3% -12.2%
Total -4.4% 0.2% -12.8% -16.9%
#$
20) In Group region Europe, operating EBITDA was down 17.3 percent, reflecting the still outstanding
sales
of CO2 emission certificates and weaker results in Belgium, Italy, Spain and Hungary as well as the 1
1
million Swiss francs in cost related to the closure of ready-mix concrete plants in Spain. Excluding
currency
movements and changes in scope, the internal operating EBITDA declined by 9.4 percent. In Group r
egion
North America, operating EBITDA decreased by 28.0 percent. In Holcim US, prices stabilized at a low
level
and together with rising third party transportation costs increased pressure on profitability. The price in
crease
recorded in Aggregate Industries US were more than offset by increasing variable costs. On a like-for-
like
basis the operating EBITDA decreased by 17.1 percent. In Group region Latin America, operating EBI
TDA
declined by 13.1 percent with negative currency movements adding some 14.7 percent to this develo
pment.
While Colombia, Argentina, El Salvador, Mexico, and Chile positively contributed to the result, Cost
Rica/Nicaragua, Ecuador, and Brazil weighed negatively on the region‘s performance with a like-for-
like
growth of 1.6 percent. Operating EBITDA in Group region Africa Middle East contracted by 17.0 perce
nt,
impacted by decreasing volumes in Morocco. Excluding the negative currency impact of 13.3 percent,
the
operating EBITDA declined by 3.7 percent. The Group region Asia Pacific decreased by 12.2 percent
with
currencies adding a negative 13.3 percent to this decline. While Holcim Indonesia, Siam City Cement
Thailand, Holcim Australia, Holcim Singapore and ACC India strongly contributed to the performance,
Cement Australia and Group Holcim Philippines weighed negatively on the result due to decreased v
olumes,
increased costs and the one-time closure cost of the Kandos plant in Australia in the amount of 21
million
Swiss francs. However, on a like-for-like basis, the region grew by 1.1 percent.
Operating
profit
Margin
Million CHF
GDFI
$DI
D$I
,$$B
,BF
,B=$
(%( + (G ($DHI (C
(D=I ($C
(HDGI
8" (C ($DI $ GDGI (H
(D$I
+) ($B (BDBI $ D$I (F
(DFI
Total change -750 -24.3% -159 -6.8% -425
-19.5%
C< C C< C<
21
©2011Holcim
Ltd/Switzerland
ResultsQ3
2011
10
4" 9 2' "
Million CHF
9M 2009
1
9M 2010
535
9M 2011
72
95
30
377
295
67
2
608
515
1003
994
890
237
245
201
∆
9M10/9M11
LFL
Change
in
Currency
Total
structure
!
Europe
-16.2%
0.5%
-5.9%
-21.6%
North
America
-61.6%
-7.9%
0.6%
-68.9%
Latin
America
-0.7%
0.0%
-14.6%
-15.2%
Africa
Middle
East
-4.8%
0.0%
-13.1%
-17.9%
Asia
Pacific
2.6%
0.0%
-13.9%
-11.3%
Total
-6.4%
-0.3%
-12.8%
-19.5%
#$
Net
income
Million CHF
(
%
,=BB
,
$
,
FB=
,G
B$
-25.2% -31.0% -22.4% -27.1% -17.9% -18.5%
9M 2009 9M 2010 9M 2011
©2011Holcim
Ltd/Switzerland
23
ResultsQ3
2011
23) Below operating EBITDA, the decrease in operating profit was partially offset by the deferred non-
cash
tax charge of 182 million Swiss francs in the previous year related to the transfer of the investment in
Holcim
Canada from Holcim US to Holcim Ltd. Group net income declined to 1 billion Swiss francs and net in
come
attributable to shareholders of Holcim Ltd amounted to 713 million Swiss francs, reflecting a decline o
f 17.9
percent and 18.5 percent respectively.
Cash flow from operating activities
Million
CHF
$DCI
DGI
Margin
HDI
,C
,=$
C$
(%( + BF$
GBDI (BC
(DBI (CHF
(GBDI
8" (B (DGI $= HDI (H (DFI
+K (= ($DHI = DI (G (HDFI
Total
change 534
32.2% -139
-6.3% -1,123
-54.7%
C< C C< C<
24
©2011Holcim Ltd/Switzerland
ResultsQ3 2011
24) Cash flow from operating activities contracted by 54.7 percent to 930 million Swiss francs. Excludi
ng the
negative currency impacts and change in structure, the decline amounted to 47.1 percent or 968 milli
o n
Swiss francs. In addition to the lower operating EBITD
A , higher working capital requirements prompted by
increased volumes and higher income taxes paid were the main drivers of this decline. These factors
were
only partially offset by lower financial expenses.
11
Cash
flow
from
operating
activities 3,659 2,053 930
-54.7%
Net investments to maintain productive
capacity and to secure competitiveness
-
410
-224 -427 -90.3%
Free
cash
flow 3,249 1,829 502
-72.5%
Expansion investments -1,182 -860 -583 32.2%
Financial investments net 230 265 54 -79.5%
Dividends paid -719 -698 -703 -0.7%
Financing
surplus
/
(requirement) 1,578 536 -729
236.1%
=
!
#$
25) Net investments to maintain productive capacity and to secure competitiveness amounted to 427
million
Swiss francs, while expansion investments declined from 860 million Swiss francs to 583 million Swiss
francs. Expansion projects include investments in India, Indonesia, Russia, Australia and Azerbaijan.
The
cash inflow from net financial investments decreased considerably year-on-year and accounted to 54
million
Swiss francs. Overall, a cash need of 729 million Swiss francs was created during the first nine month
s of
2011. On maintenance CAPEX we lower our guidance for the full year 2011 to 700 million Swiss franc
s and
1.0 billion Swiss francs for expansion CAPEX.
+
Million CHF
Netfinancialdebt
Totalshareholders'equity
Gearing
58.4%
53.8%
62.4%
21,805
21,121
19,424
12,723
11,363
12,127
9M
2010 12M
2010 9M
2011
H
!
#$
Million
CHF
Full
Year 9
months
+/-
2010 2010 2011
Loans
Capit alma rkets
Loans
Capitalmarkets
0
<1y 1-2y 2-3y 3-4 y 4-5y 5-6y 6-7y 7-8y 8-9y 9-1 0y >1 0y
Mar12 May12 Mar13 May13Jan12 Jun12 Jan13 Jun13Jul12Feb12Nov11Dec11 Nov12Dec12
Sep12
Feb13Oct 11 Oct12 Jul13
Aug12 Aug13
Sep13
Apr12 Apr13
8 ?
26) Total shareholders‘ equity decreased to 19.4 billion Swiss francs mainly driven by the negative curr
ency
impact amounting to around 1.7 billion Swiss francs. Net financial debt decreased by 596 million Swiss
francs compared to the third quarter of last year driven by cash flow from operating activities and the
depreciation of various currencies against the Swiss franc. Gearing increased to 62.4 percent.
Financial debt, maturities and liquidity as of
September 30, 2011
<' 9 8+
Liquiditysummary
creditlines:CHF
7,377million
Debtsummary
Corporatevs.
subsidiarydebt:76%corporate
Ø
totalmaturity:
3.7
years
CPborrowings:CHF
61
million
No
financialcovenantsat
corporatelevel
ST/LT
ratingssummary
asof
November
9,
2011
S&P
CreditRating:
A-2
/
BBB,
outlookstable
FitchCreditRating:
F2/
BBB,
outlookstable
1
Currentfinancialliabilitiesadjustedforshort-termdrawingsunderlong-termcommittedcreditlines
©2011Holcim Ltd/Switzerland
27
ResultsQ3 2011
27) Cash and marketable securities stood at 3.1 billion Swiss francs. Undrawn committed credit lines
added
another 4.3 billion Swiss francs to liquidity, thus giving Holcim a comfortable 7.4 billion Swiss francs fin
ancial
flexibility at its disposal. The average maturity of the financing stood at 3.7 years as of 30 September 2
011.
12
4
.L '
: ::::7L "
: ::::7L % "
7% < .L " 2
7: ::::J9L 2 '
+ 9 ', ) (%(
" .5/67 2 '*
F
!
#$
28) Holcim has a unique global presence with a strong focus on emerging markets t
hat will continue growing,
especially Asia and Latin America. This, together with the efficient and state-of-the-
art production facilities,
means the Group will be able to benefit more than average over the coming years fr
om the globally growing
demand for building materials. In Group region Europe, the demand for construction
materials should remain
solid in many places. In North America we expect a slight improvement in the constr
uction sector. Most
emerging markets in Latin America and Asia should remain on track for growth. No c
hange is anticipated in
business conditions in Group region Africa Middle East. The sharp global rise in ener
gy, raw material and
Capitalmarkets
63%;
Loans37%
Fixedto
floatingratio:49%
fixed
Currentfinancialliabilities
1
:
CHF
3,157million
Cash
+
marketable
securities+
unusedcommitted
Cash
+
marketable
securities:CHF
3,093
million
1'000
2'000
3'000
4'000
5'000
1'000
2'000
3'000
4'000
5'000
Moody’s CreditRating:
P-2
/
Baa2,outlookstable
transportation costs call for further price adjustments. This and continuous, consiste
nt cost management are
focal points at all levels of the Group. For the current financial year, Holcim expects
a like-for-like operating
EBITDA that will be close to last year's level.
.
"
Million
CHF
9
months +/-
(ifnototherwisestated)
2010
2011
LFL
CIS
FX
Total
Cement volumes (mt) 20.1 20.6 2.3% 0.0% 2.3%
- of which mature markets
- of which emerging markets
Aggregates volumes (mt)
- of which mature markets
- of which emerging markets
Ready-mix volumes (mm
3
)
- of which mature markets
- of which emerging markets
12.4 12.7 1.9% 0.0% 1.9%
7.7 7.9 3.0% 0.0% 3.0%
59.5 63.6 1.8% 5.1% 6.9%
53.6 55.6 -0.7% 4.6% 3.9%
5.9 8.0 24.0% 10.0% 34.0%
12.4 12.2 -1.6% 0.3% -1.4%
10.9 10.8 -1.3% 0.4% -1.0%
1.5 1.4 -4.0% -0.4% -4.4%
Net sales 5,136 4,691 1.9% 0.3%
-10.9%
-8.7%
- of which mature markets
- of which emerging markets
4,247 3,858 1.0% 0.3%
-10.5% -9.2%
889 833 6.4% 0.3%
-13.0% -6.3%
Operating EBITDA 855 707
-9.4% 0.4% -8.3% -17.3%
- of which mature markets
- of which emerging markets
!
572 494 -8.3% 0.5% -6.0% -13.9%
283 213 -11.7% 0.1%
-12.9% -24.4%
C
#$
7
"
Million CHF
9 months +/-
(ifnototherwisestated)
2010 2011 LFL CIS FX Total
Cement
volumes
(mt)
8.4
8.5
1.2%
0.0%
1.2%
Aggregates
volumes
(mt)
Ready-mix
volumes
(mm
3
)
28.8
31.9
2.2%
8.8%
11.0%
4.2
5.1
-3.3%
24.4%
21.0%
Net
sales
2,449
2,151
-1.0%
4.7%
-15.8%
-12.1%
Operating
EBITDA
366
264
-17.1%
1.3%
-12.3%
-28.0%
$
!
#$
13
7 E "
Million
CHF
9
months +/-
(ifnototherwisestated)
2010
2011
LFL
CIS
FX
Total
Cement volumes (mt) 16.8 18.0 6.7% 0.0% 6.7%
Aggregates volumes (mt)
Ready-mix volumes (mm
3
)
9.0 10.9 21.4% 0.0% 21.4%
7.7 8.2 7.1% 0.0% 7.1%
Net sales 2,587 2,467 10.7% 0.0%
-15.3%
-4.6%
Operating EBITDA 762 662 1.6% 0.0%
-14.7%
-13.1%
$
!
7% < . E "
#$
Million CHF
9 months +/-
(ifnototherwisestated)
2010 2011 LFL CIS FX Total
Cement
volumes
(mt)
6.8
6.5
-4.7%
0.0%
-4.7%
Aggregates
volumes
(mt)
Ready-mix
volumes
(mm
3
)
1.9
1.7
-9.0%
0.0%
-9.0%
0.8
0.8
4.0%
0.0%
4.0%
Net
sales
849
706
-3.1%
0.0%
-13.8%
-16.9%
Operating
EBITDA
286
237
-3.7%
0.0%
-13.3%
-17.0%
$
!
7 J9 E "
#$
Million
CHF
9
months +/-
(ifnototherwisestated)
2010
2011
LFL
CIS
FX
Total
Cement volumes (mt) 53.2 56.2 5.7% 0.0% 5.7%
- of which mature markets
- of which emerging markets
Aggregates volumes (mt)
- of which mature markets
- of which emerging markets
Ready-mix volumes (mm
3
)
- of which mature markets
- of which emerging markets
3.6 3.5 -2.3% 0.0% -2.3%
49.6 52.7 6.3% 0.0% 6.3%
19.6 22.3 13.5% 0.0% 13.5%
17.4 19.4 11.5% 0.0% 11.5%
2.2 2.9 29.6% 0.0% 29.6%
9.3 9.8 4.5% 0.0% 4.5%
4.4 4.3 -1.7% 0.0% -1.7%
4.9 5.5 9.9% 0.0% 9.9%
Net sales 6,020 5,929 12.4% 0.0%
-13.9%
-1.5%
- of which mature markets
- of which emerging markets
1,731 1,784 7.8% 0.0% -4.8% 3.0%
4,288 4,145 14.3% 0.0%
-17.6% -3.3%
Operating EBITDA 1,439 1,264 1.1% 0.0%
-13.3%
-12.2%
- of which mature markets
- of which emerging markets
!
298 268 -5.8% 0.0% -4.2% -10.0%
1,141 995 2.9% 0.0%
-15.7% -12.8%
$$
#$
8 E J "
Domestic
cement
prices
+/-
9M
10/9M
11
*
Domestic
clinker
and
cement
volumes
+/-
9M
10/9M
11
Europe 2.2% 2.3%
Belgium -4.0% 10.2%
France -0.1% 7.3%
Germany
1
Switzerland -0.1% 6.4%
Italy 1.2% -7.3%
Hungary -8.8% -24.0%
Czech Republic -8.3% -9.1%
Slovakia -4.1% 2.7%
Croatia -7.4% -3.7%
Romania -1.9% 6.7%
Bulgaria -2.8% 5.3%
Serbia -3.9% -3.0%
Russia 31.0% 22.8%
Azerbaijan 1.9% -2.4%
Spain 3.2% -19.9%
*Ifnototherwiseindicatedcalculationbasedonlocalcurrencies(regionEuropebasedonEUR)
Locallynotpublishedyet
$G
!
#$
14
8 E J "
Domestic
cement
price
s
+/-
9M
10/9M
11
*
Domestic
clinker
and
cement
volumes
+/-
9M
10/9M
11
North
America -4.0% 1.2%
Canada 0.4% -4.3%
USA -5.2% 2.5%
Latin
America 4.8% 6.7%
Mexico 0.3% 2.5%
El Salvador 5.4%
1
14.9%
Costa Rica -3.7%
1
-10.4%
Nicaragua 3.2%
1
18.7%
Colombia 1.5% 22.9%
Ecuador 3.6%
1
7.0%
Brazil 6.3% 3.7%
Chile
2
Argentina 18.7% 6.1%
*Ifnototherwiseindicatedcalculationbasedonlocalcurrencies(regionsNorthAmericaandLatinAmericabasedonUSD)
1
CalculationinUSD
2
Locallynotpublishedyet
!
Cement E Price/volume variances per regio
n
$=
#$
Domestic cement pric
es
+/- 9M 10/9M 11 *
Domestic clinker and
cement volumes
+/- 9M 10/9M 11
Africa Middle East 0.8% -4.7%
Morocco
1
Lebanon
1
Indian
Ocean -0.1% 4.0%
M/%2"7%<.206
'
2'
36
©2011Holcim Ltd/Switzerland
8 E J
"
ResultsQ3 2011
Domestic
cement
price
s
+/-
9M
10/9M
11
*
Domestic
clinker
and
cement
volumes
+/-
9M
10/9M
11
Asia
Pacific 6.0% 5.7%
India 6.1% 9.1%
Sri Lanka 1.1% 12.7%
Bangladesh 5.8% 4.0%
Thailand 13.9% 4.8%
Vietnam 20.0% -2.2%
Malaysia 0.5% 14.2%
Indonesia -0.4% 33.2%
Philippines -5.1% -9.5%
Australia 0.6% -2.1%
New Zealand 2.9% -3.2%
Group 2.9% 5.2%
*Ifnototherwiseindicatedcalculationbasedonlocalcurrencies(regionAsiaPacificbasedonUSD/GroupbasedonCHF
)
!
Aggregates E Price/volume variances per r
egion
$B
#$
Domestic aggregate
s
prices
+/- 9M 10/9M 11 *
Domestic aggregates
volumes
+/- 9M 10/9M 11
Europe
United
Kingdom
1
3.8% -
2.4%
Belgium 2.3%
7.0%
France 0.7%
28.9%
Germany
2
Switzerland -1.0%
8.2%
Italy -8.6% -
20.5%
Romania -12.1%
17.6%
Bulgaria -13.9%
32.1%
Spain -10.1% -
5.2%
M/%2
7"""
/01D)
'
2'
38
©2011Holcim Ltd/Switzerland
ResultsQ3 2011
15
7""" E J "
Domestic
aggregates
prices
+/-
9M
10/9M
11
*
Domestic
aggregates
volumes
+/-
9M
10/9M
11
North
America
Canada 0.3% 9.2%
United States 7.4% -2.1%
Latin
America
Mexico 4.7% 29.9%
Brazil 17.6% -0.5%
Asia
Pacific
Australia
1
7.9% 12.8%
Indonesia 3.9% 34.8%
*Ifnototherwisestatedcalculationbasedonlocalcurrencies
1
proforma
!
Contact information and event calendar
$C
#$
8 %
8 8
J
NG =F F=F FB
+) NG =F F=F FB C
OD
/
J
NG =F F=F FB FB
+) NG =F F=F F C
DOD
DD
<" L
DD 22
©2011Holcim Ltd/Switzerland
.
+2' C, J ' % %
%
7 B, - " %
<' C, + %
7" =, % ' %
2 B, J ' % %
%
40
ResultsQ3 2011
6
Cautionary statement regarding forward-looking statements
This presentation may contain certain forward-looking statements
" -P % 2,
performance.
Such statements may be subject to a number of risks, uncertainties
and other important factors, such as but not limited to (1) competitive
pressures; (2) legislative and regulatory developments; (3) global,
macroeconomic and political trends; (4) fluctuations in currency
exchange rates and general financial market conditions; (5) delay or
inability in obtaining approvals from authorities; (6) technical
developments; (7) litigation; (8) adverse publicity and news
coverage, which could cause actual development and results to differ
materially from the statements made in this presentation. Holcim
assumes no obligation to update or alter forward-looking statements
whether as a result of new information, future events or otherwise.
G
!
Strength. Performance. Passion.
#$
NewShurovoplant(Russia)
©2011Holcim Ltd/Switzerland
16