Friction and Lubrication in Mechanical Design Episode 2 Part 2 docx
Bạn đang xem bản rút gọn của tài liệu. Xem và tải ngay bản đầy đủ của tài liệu tại đây (956.61 KB, 25 trang )
Rolling/
Sliding
Contacts
255
which suggests that the elasticity of the rollers causes the minimum film
thickness to increase by approximately 100 times.
Dowson and coworkers
[4,
61
approached the problem from first prin-
ciples and simultaneously solved the elasticity and the Reynolds equations.
Their formula for the minimum film thickness is given in a dimensionless
form as:
where
tlo
U
U
=
speed parameters
=
-
Ee
Re
-
G
=
material parameter
=
aEe
W
=
load parameter
=
-
PY
EeR
Using the same dimensionless groups suggested by Dowson and Higginson
[4],
the Grubin solution can be given as:
H
=
1.95
7
(
Gu)0.73
(7.6)
What is particularly significant in the EHD theory is the very low depen-
dency
of
the minimum film thickness on load. The important parameters
influencing the generation of the fdm are the rolling speed, the effective
radius of curvature and the oil viscosity. Consequently, Dowson and
Higginson suggested the following simplified formula for practical use:
where
ho
=
minimum film thickness (in.)
qo
=
inlet
oil
viscosity (poise)
Re
=
effective radius (in.)
U
=
rolling speed (in./sec)
256
Chapter
7
7.4
FRICTION
IN
THE ELASTOHYDRODYNAMIC REGIME
The EHD lubrication theory developed over the last
50
years has been
remarkably successful in explaining the many features of the behavior of
heavily loaded lubricated contacts. However, the prediction of the coeffi-
cient of friction is still one of the most difficult problems in this field. Much
experimental work has been done [7-211, and many empirical formulas have
also been proposed based on the conducted experimental results.
Plint investigated the traction in
EHD
contacts by using three two-roller
machines and a hydrocarbon-based lubricant
[14].
He found that roller sur-
face temperature has a considerable effect on the coefficient of friction in the
high-slip region (thermal regime).
As
the roller temperature increases the
coefficient of friction falls linearly until
a
knee is reached. With further
increase in temperature the coefficient of friction rises abruptly and errati-
cally and scuffing
of
the roller surface occurs. He also gave the following
equation to correlate all the experimental results, which was obtained from
28
distinct series of tests:
21
300
f
=
0.0335
log
-
(0,
+
40)
-
44sb3
(7.8)
where
0,.
is the temperature on the central plane
of
the contact zone
("C)
and
h
is the radius of the contact zone (inches).
Dyson [15] considered a Newtonian liquid and derived the expression
for maximum coefficient of friction as:
where
a
=
pressureviscosity coefficient
K
=
heat conductivity
P
=
pressure
qo
=
dynamic viscosity
ho
=
minimum
oil
film thickness
y
=
temperature-viscosity coefficient
(7.9)
If
aP
>>
I,
the coefficient of friction increases rapidly with pressure.
Rolling/ Sliding Contacts
257
Sasaki et al. [16] conducted an experimental study with a roller test
apparatus. The empirical formula of the friction coefficientf in the region
of semifluid lubrication as derived from the tests is given as:
(7.10)
where
rj
=
lubricant dynamic viscosity
U
=
rolling velocity
U'
=
load per unit width
k
=
function of the slide/roll ratio
When slidelroll ratio
=
0.3
1,
k
=
0.037;
when slidelroll ratio
=
1.22,
k
=
0.026.
Drozdov and Gavrikov
[
171
investigated friction and scoring under
conditions of simultaneous rolling and sliding with a roller test machine.
The formula for determination
off
at heavy contact loads from more than
10,000
experiments
is
found to be:
(7.1
I)
1
0.8~:'~
+
V,v(Pmax,
uO)
+
13.4
f=
where
dl'maxy
vg)
=
0.47
-
0.12
x
10-4Pmax
-
0.4
x
10-3~g
uo
=
kinematic viscosity
of
the lubricant (cst) at the mean surface
V,
=
sum rolling velocity (sum
of
the two contact surface velocities,
temperature
(To)
and atmospheric pressure
m/sec)
P,,,
=
maximum contact pressure (kg/cm2)
O'Donoghue and Cameron
[
181 studied the friction in rolling sliding con-
tacts with an Amsler machine and
found
that the empirical relation relating
friction coefficient with speed,
load,
viscosity, and surface roughness could
be expressed as:
(7.12)
258
Chapter
7
where
S
=
total initial disk surface roughness (pin.
CLA)
V,
=
sliding velocity (difference of the two contact surface velocities) (in./sec)
Vr
=
sum rolling velocity (in./sec)
q
=
dynamic viscosity (centipoises)
R
=
effective radius (in.)
Benedict and Kelley
[
191
conducted experiments
to
investigate the friction in
rolling/sliding contacts. The coefficient of friction has been found to
increase with increasing load and to decrease with increasing sum velocity,
sliding velocity, and oil viscosity when these quantities are varied individu-
ally. The viscosity was determined at the temperature of the oil entering the
contact zone. The results are combined in a formula, which closely repre-
sents the data as below:
where
(7.13)
R
=
effective radius (in.)
S
=
surface roughness (pin.
rms)
V,
=
sliding velocity (in./sec)
V,
=
sum
rolling velocity (in./sec)
W
=
load per unit width (lb/in.)
qo
=
dynamic viscosity (cP)
The limiting value of
S
is
30pin.
formula:
Misharin
[20]
also studied the friction coefficient and derived the
where
(7.14)
V,
=
sliding velocity (m/sec)
Vr
=
sum rolling velocity
(m/sec)
uo
=
kinematic viscosity (cSt)
Rolling/ Sliding Contacts
259
The limiting values are:
R:
nonsignificant deviation from
1.8
cm
slide/roll ratior 0.4-1.3
contact stress
2
2500
kg/cm2
0.08
sf
2
0.02
The accuracy of this empirical formula is reported to be within
15%.
Ku et al.
[21]
conducted sliding-rolling disk scuffing tests over a wide
range of sliding and sum velocities, using a straight mineral oil and three
aviation gas turbine synthetic oils in combination with two carburized steels
and a nitrided steel. It is shown that the disk friction coefficient is dependent
not only on the oil-metal combination, but also on the disk surface treat-
ment and topography as well as the operating conditions. The quasisteady
disk surface temperature and the mean conjection-inlet oil temperature are
shown to be strongly influenced by the friction power loss at the contact, but
not by the specific make-up
of
the frictional power loss. They are also
influenced by the heat transfer from the disk, mainly
by
convection to the
oil and conduction through the shafts, which are dependent on system
design and oil flow rate.
For AISI
93
10
steel:
I3O
+
0.0009
+
0.0003S
0.0666
f=-
c5
+
W
V:.6
+
1965
For
AMS
6475 steel:
-
0.0041
+
0.0003S
0.0666
130
+
c.5
i-
W
c6
+
1965
where
(7.15)
(7.16)
V,
=
sum
rolling velocity
(m/sec)
V,
=
sliding velocity
(m/sec)
W
=
load
(kN)
S
=
surface roughness
(pm
CLA)
260
Chapter
7
7.5
DOMAINS OF FRICTION IN
EHD
ROLLING/SLIDING
CONTACTS
The coefficient of friction for different slide-to-roll ratio
z
has three regions
of interest as interpreted by Dyson [15].
As
illustrated in Fig.
7.2,
the first
region is the isothermal region in which the shear rate is small and the
amount of heat generated is
so
small as to be negligible. In this region,
the lubricant behavior
is similar to a Newtonian fluid. The second region
is called the nonlinear region where the lubricant is subjected to larger strain
rates. The coefficient
of friction curve starts to deviate significantly from the
Newtonian curve and a maximum coefficient of friction is obtained, after
which the coefficient of friction decreases with sliding speed. Thermal effects
do not provide an adequate explanation in this region because the observed
frictional traction may be several orders of magnitude lower than the cal-
culated values even when temperature effects are considered. The third
region is the thermal region. The coefficient of friction decreases with
increasing sliding speed and significant increase occurs in the temperature
of the lubricant and the surfaces at the exit of the contact.
Almost all the empirical formulas discussed in the previous section are
for the thermal regime. Each formula shows good correlation with the test
data from which
it
was derived, as illustrated
in
Fig.
7.3,
but generally none
of these formulas correlates well with the others, as shown in Fig.
7.4. This
suggests that these formulas are limited in their range of application and
that a unified empirical formula remains to be developed.
Slide
/
Roll
Ratio
-
2
Figure
7.2
Friction in rolling/sliding contacts.
RoNinglSliding
Contacts
26
I
0.08
I
0.05
0.
M
*
0.03
0.02
0.01
nnn
/I
t
/I
0.00
0.01
002
003
004
005
006
0.07
0.06
-
0.08
0.01
-
008
-
005
-
004
-
003
-
.c
000
001
002
003
004
005
006
007
C
18
Figure
7.3
(a) Comparison of Drozdov's formula with Drozdov's experiments.
(b)
Comparison of
Cameron's formula with Cameron's experiments.
(c)
Comparison
of
Kelley's formula with Kelley's experi-
ments.
(d)
Comparison of Misharin's formula with Misharin's experiments.
262
Chapter
7
00
n
n=
I
oo
I
00
I
0.04
1
’c
/
0.00
0.01
0.02
0.03
0.04 0.05
0.08
0.07
0.08
(a)
f
0.08
0.07
0.06
0.05
0.04
0.03
0.02
0.01
0.00
r
t
0:
.”/
.OO
0.01
0.02
0.03
0.04
0.05 0.08
0.07
0.08
0.08
0.07
-
0.08
-
0.05
-
L
0.03
-
0.00
0.01
0.02
0.03
0.04
0.05
0.08
0.07
0
@)
f
w)
Figure
7.4
(a) Comparison of
Drozdov’s
formula with Cameron’s experiments.
(b)
Comparison
of
Drozdov’s
formula with Misharin’s experiments.
(c)
Comparison of Kelley’s formula with Cameron’s experi-
ments.
(d)
Comparison of Kelley’s formula with Misharin’s experiments.
R
ollingl Sliding Contacts
263
0.00
0.01
0.02
0.03
0.04
0.05
0.06
0.07
0.08
(9)
f
0.08
I
0.01
0.08
0.05
0.04
0.03
0.02
0.01
0.00
*
/
0
0
1
1 1
1
1 1
.OO
0.01 0.02
0.03
0.04
0.05
0.08
0.07
(h)
f
Figure
7.4
(Cont ’d.)
(e) Comparison of Misharin’s formula with Kelley’s experiments.
(f)
Comparison of
Misharin’s formula with Drozdov‘s experiments.
(8)
Comparison of Cameron’s formula with Misharin’s
experiments. (h) Comparison
of
Misharin’s formula with Cameron’s experiments.
264
Chapter
7
No
formulas are available in the literature for determination of pure
rolling friction in the
EHD
regime.
7.6
EXPERIMENTAL EVALUATION
OF
THE FRICTIONAL
COEFFICIENT
An experimental study was undertaken by Li [22] to simulate typical engi-
neering conditions, and explore and evaluate the effects of different para-
meters such as loads, speeds, slide/roll ratios, materials,
oil
viscosi ties, and
machining processes on the coefficient of friction. The results were then used
to derive general empirical formulas for the coefficient of friction, which
cover the different lubrication regimes. These formulas will also be com-
pared with other published experimental data to further evaluate their gen-
eral applicability. The formulas developed by Rashid and Seireg [23] are
used to calculate the temperature rise in the film.
The experimental setup used in this study is schematically shown in Fig.
7.5.
It
is a modified version of that used by Hsue
[24].
The shaft remained
unchanged during the tests, whereas the disks were changed to provide
different coated surfaces. The shaft was ground 4350 steel, diameter
61 mm, and the disks were ground 1020 steel, diameter 203.2mm. The coat-
ing materials used for the disks were tin, chromium, and copper. Uncoated
steel disks were also used. The coating was accomplished by electroplating
with a layer of approximately 0.0127 mm for all the three coated disks, and
the contact width was 3.175mm for all the disks. The disk coated with tin
and the one coated with chromium were machined before plating. The
measured surface roughness is shown in Table 7.1 and the material proper-
ties are shown in Table 7.2.
A
total of 240 series
of
tests were run.
The disk assembly was mounted on two
1
in. ground steel shafts which
could easily slide in four linear ball bearing pillow blocks. The load was
applied
to
the disk assembly by an air bag. This limited the fluctuation of
load caused by the vibration which may result from any unbalance in the
disk. The frictional signal obtained from the torquemeter was relatively
constant in the performed tests.
A
variable speed transmission was used to adjust the rolling speed to
any desired value.
A
toothed belt system guaranteed the accuracy of sliding-
rolling ratios. This was particularly important for the rolling friction tests.
The lubricant used was 10W30 engine oil with a dynamic viscosity of
0.09Pa-s at 26°C; the loads were 94,703, 189,406,284,109, and 378,8 12 N/m;
the slide/roll ratios were
0,0.08,0.154,0.222,0.345;
the rolling speeds varied
from 0.3 to 2.76
m/s,
and the sliding speeds were in the range
0
to 0.95m/s.
RollinglSliding Contacts
265
1.
Shaft
8.
Amplifier
2.
Disk Assembly
3.
Load
Cell
10.
Chains
4.
GasBag
5.
Air Meter
12.
Motor
6.
Couplings
13.
Oil Valve
7.
Digital Oscilloscope
9.
Torque Meter
11.
Variable Speed Transmission
14.
Oil Container
Figure
7.5
Experimental setup.
Table
7.1
Surface Roughness Measurement
Disk
coating material
Surface roughness (pm
AA)
Tin
Chromium
Steel
Copper
0.42
0.38
0.17
0.20
Table
7.2
Material Properties
Steel
43
7800 473 203.4
Copper
40
1
8930 386
103
Chromium
94 7135 450
250
Tin
67 7280 222 46
10W30 0.145
888 1880
-
266
Chapter
7
The experimental results cover rolling friction, the isothermal regime,
the nonlinear regime, and the thermal regime. The variables in the tests
include load, speed, slide/roll ratio, surface roughness, and the properties
of the coated layer. The following conclusions can be drawn from the test
results.
7.6.1
Friction
Regimes
Although many investigators have conducted experimental investigations
on the coefficient
of
friction, no experimental results have been reported
in the literature for the rolling friction with
EHD
lubrication. This is prob-
ably due
to
the difficulties of measuring the very small rolling friction force
to be expected in pure rolling. It is found in the performed tests that rolling
friction is very small and increases gradually with load in all cases. It
decreases at a relatively rapid rate with rolling speed when the rolling
speed is small
(<
1.5 m/s), then decreases at a lower rate at higher rolling
speeds. The effects
of
the coated material properties and surface roughness
on rolling friction appear to be insignificant for all the performed tests.
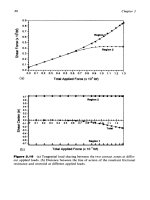
Figure
7.6
shows the experimentally determined variations of rolling friction
with load and rolling speed.
In the isothermal regime, it is expected that the surface roughness, the
modulus of elasticity of the coated and base materials, and the thickness of
the coated layers play an important role. On the other hand, the material
thermal properties do not appear to have significant influence. Coating layers
of soft materials are found to give a higher coefficient of friction. The surface
roughness also increases friction. The coefficient of friction is also found to
increase with load and decrease with rolling speed. Figures
7.7-7.10
show the
variation of coefficient of friction with slide/roll ratio. It can be seen from
these figures that the coefficient of friction for steel and copper coating
reaches its maximum in the nonlinear regime. For chromium and tin coat-
ings, the coefficient of friction continues to increase, but at much slower rate
than in the isothermal and the nonlinear regimes. The magnitude and posi-
tion of the maximum value of the coefficient of friction are influenced by the
surface roughness, material physical properties, load, speed, and viscosity.
In the thermal regime the coefficient of friction is found to decrease
slightly with the slide/roll ratio. The thermal properties
of
the coated and
the base materials are found to have significant effect on the coefficient
of
friction as would be expected. The surface with a high diffusivity
K/(pC)
usually produces a lower coefficient of friction because the surface contact
temperature rise is lower, and consequently, the actual oil viscosity
is
higher,
which produces a better lubrication condition. Rough surfaces give higher
coefficient friction as in the isothermal and nonlinear regimes. However, the
RolIinglSliding Contacts
26
7
0.05
8
0.04
0.03
c
0.5
1.0 1.5 2.0 2.5 3.0 3.5
~
40
(8)
w
(WmXlO',
0.00
'
1
I
I
1
I
1
0.0
0.5
1.0
1.5
2.0
2.5
3.0
(c)
U
(mlr)
c
oq-
0.03
1
0.00
O.O1 0.5
LL+ +-
1.0 1.5
2.0
2.5 3.0 3.5
4
@)
w
(Nlm
x1oq
0.03
0.02
c
0.01
-0-
W
=
94703
Nlm
cW
=
198408
Nln
+W
=
284109
Nln
-0-
W
=
376812
Nlm
I
0.00
I
I I
I
I I
I
0.0
0.5 1.0 1.5
2.0
2.5
3.0
(d)
U
(mw
3
Figure
7.6
speed, tin; (d) with rolling speed, steel.
Variation of coefficients
of
friction: (a) with load, chromium;
(b)
with load,
copper;
(c) with rolling
268
Chapter
7
e
0.08
0.07
0.06
0.05
0.04
0.03
0.02
0.01
W
=
94703
Nlm
U
=
0.803
mh
A
//
0.0
0.1
0.2
0.3
0.4
z
Figure
7.7
Variation of coefficient of friction with slide/roll ratio;
W
=
94,703
N/m,
U
=
0.303m/sec.
0.08
0.07
0.06
0.05
0.04
0.03
0.02
0.01
0.00
W
=
94703
Nhn
-
U=1.44mh
*Tin
+
Chromium
-
steel
-
-L-
Copper
1
l I., !.I
0.0
0.1
0.2
0.3
0.4
z
Figure
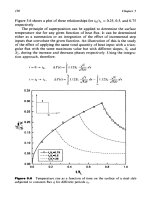
7.8
Njm,
U
=
1.44m/sec.
Variation
of
coefficient
of
friction with slide/roll ratio;
W
=
94,703
RollinglSliding Contacts
0.07
269
W
=
284109
Nh
-
U=2.78mh
0.06
0.05
0.04
0.03
0.02
4-
Tin
0.01
A
Copper
cc
4-
Chromium
-17-
Steel
0.00'
'
'
'
"
'
'
'
"
' '
a
"
'
'
'
'
0.0
0.1
0.2
0.3
0.4
z
Figure
7.9
Variation
of
coefficient
of
friction with slide/roll ratio;
W
=
284,109
N/m,
U
=
2.76m/sec.
Z
Figure
7.10
Variation of coefficient of friction with slide/roll ratio;
W
=
N/m,
U
=
0.303 m/sec.
4
378,812
270
Chapter
7
load appears to have no direct effect on the coefficient of friction in the
thermal regime.
Rolling speed is found to have a significant effect on the coefficient of
friction in pure rolling conditions and in the isothermal, the nonlinear, and
the thermal regimes. The coefficient of friction always decreases with
increasing rolling speed. The rate of decrease is more significant for low
rolling speeds, and is relatively lower for high rolling speeds.
Both the physical and the thermal properties of the coated materials
influence the coefficient of friction. The modulus of elasticity decreases
the
coefficient of friction in the isothermal and nonlinear regimes. The thermal
properties of the surface influence the coefficient of friction in the thermal
regime.
7.7
THE
EMPIRICAL FORMULAS
There are many published empirical formulas for evaluating the coefficient
of friction. They were developed by different investigators under different
experimental conditions, and therefore, it it no surprise that they do not
correlate with each other. All of these formulas are developed from test data
in the thermal regime. The generalized empirical formulas presented in this
section cover all the three regimes, as well as rolling friction. All the vari-
ables in these formulas are dimensionless. The formulas calculate the coeffi-
cient
of
friction at three sliding/rolling conditions which can then be used to
construct the entire curve, as illustrated in Fig.
7.10.
The first point is
fr,
which gives the magnitude of the rolling coefficient of friction. The second
point isf,, which gives the coefficient of friction in the nonlinear region, and
z*,
its location. This point is assumed to approximately define the end of the
isothermal region or the maximum value in the nonlinear regime. The third
one is the thermal coefficient of friction,f,, and the corresponding slidelroll
ratio location is chosen as
0.27,
after which the coefficient of friction is
assumed
to
be almost independent of the slide/roll ratio. The coefficient
of friction curve is then presented by curve fitting the three points by an
appropriate curve.
In the isothermal and the nonlinear regimes, four dimensionless
parameters are used. They are:
1.
U2P
10'0
Rolling
speed
a
=
-
E'
Viscosity
q
=
-
tlL
x
10"
-
E'R~~
(7.17)
(7.18)
RollinglSliding Contacts
271
(7.19)
(7.20)
W
E’R
sec
R
Load
W
=
-
x
105
Surface roughness
S
=
-
x
106
Sec
is calculated according to Eq.
(7.25),
and
p
=
0.865
(which is an approx-
imate value for most lubricating oils used in test conditions). All the other
variables are defined in the following notation:
U
=
rolling speed
=
UI
+
U2
L
U,,
U2
=
rolling speeds of rollers
1,
2
RI R2
RI +R2
R
=
effective radius
=
-
RI,
R2
=
radii
of
rollers
1,
2
1
E’
=
effective modulus
of
elasticity
=
1
1-U:
14;
-~
2(
El
+T)
El,
E2
=
elastic modulii
of
solids in contact
uI, u2
=
Poisson’s ratio
for
solids in contact
q
=
dynamic viscosity
of
oil
W
=
load per unit length
2.
The coefficient of rolling friction is the value at which the sliding
speed is equal to
0.
It is found to
be
best fitted for the experimental data by
the following equation:
0*00138
~0.367
f,
=
0.05
+
10.433
-
(7.21)
3.
The transition coefficient of frictionf, can be calculated from:
where
a
=
0.0191
-
1.15
x
10-4Jij
-
B
=
0.265
+
6.573
x
10-3
T,I
-
(7.22)
272
Chapter
7
and its location
z*
is calculated from:
where
a'
=
0.219(1
-
e-1fi6.368)
+
0.0122
4.
In the thermal regime, where slide/roll
>
0.27:
s
=jb
-
[a(~
-
eh)]
where
jb
=
coefficient of friction at
ho
=
0,
from Fig.
7.11
U
=
0.0864
-
1.372
x
103(%)
6'
h0
-
b=-
(7.24)
(7.25)
S'>(.
=
Js:
f
s:
where
S,
=
effective surface roughness, from Fig.
7.12;
for
S
<
0.05
pm
take
S,
=
0.05
pm
(%)
=
effective surface roughness ratio, from Fig. 7.13
12
R
=
effective radius
ho
=
oil film thickness calculated
by
the well-known Dowson-Higginson
formula:
e.54
0.7 0.7
q0
~0.43
ho
=
2'65
~'0.57
~0.13
(7.26)
Rolling/
Sliding Contacts
273
f+
n
I
I
I
I
I
I
I
I
1
I
I
b
z
z*
0.27
Figure
7.1
1
lated three points.
Possibilities for construction
of
the empirical curves from the calcu-
274
Chapter
7
0.13
0.12
*O
5
0.11
z
't
tL
rc
0.10
0
c
@
Y
t
O*09;
s
0.08
0.07-
b
, I
.
.
,
,
,W,T
-
-
-
-
-
* "*""
.'
''*a'1"
.
U
SeclR
Figure
7.12
Coefficient of friction at
ho/R
=
0
against nominal
S,,./R.
The ratio
ho/R
represents the influence of the lubricant film. The ratio
(Sec/R)e
represents the influence of the surface condition resulting from
a particular manufacturing process. The test data used in developing the
proposed formula cover the following range:
contact surfaces: steel-steel
effective radius
R
=
0.0109
-
0.0274m
lubricant viscosity
q
=
2.65
-
2000cP
surface processing operation
=
grinding (0.1
-
1.6
pm
AA)
film/surface roughness
h
=
0.21
-
14.3
1
slide/roll ratio
z
=
0.268
-
0.455
sliding speed
V,
=
1.35
-
5
m/sec
rolling speed
U,
=
3.2
-
15 m/sec
material
=
EN32 steel cast hardened
to
750
VPN
to a depth of 0.025
in.
SAE 8622 carburized and hardened to Rockwell hardness 60 [18]
Steel
38XMI-OA
[19]
~71
RollinglSliding Contacts
0.1
-
(El.otroplat8d Machining)
(Soperfinldng)
-
0.1
1
10
I
::I
20
i
275
0.1 1 10 100 1000x1
06
(b)
mm
Figure
7.1
3
(a) Proposed effective surface roughness
for
various manufacturing
processes.
(b)
Effective
(Sec/R)e
against nominal
SJR.
Grade 12X2H4A steel carburized to a depth
of
1-1.5mm and heat-
treated to
a
Rockwell hardness
of
58-60
[20]
load
W
=
1.54
x
10’
-
20.3
x
10’ N/m
maximum contact stress
a,,,
=
6724
-
16,825 kg/cm2
276
Chapter
7
7.7.1
Coating
Effects
on the Coefficients
of
Friction
Equation
(7.24)
is for steel-steel contact. In the case where the surface is
coated with other materials, the experimental results show that the coefficient
of friction can deviate considerably from the steel-steel contact conditions.
This can be attributed to the effect of the coating material properties. Since
the oil film thickness is a critical fctor in lubrication, and the viscosity
of
the
lubricant affects the film thickness significantly, evaluation of the tempera-
ture rise in the contact zone is of critical importance in this case.
7.7.2
Temperature Rise Calculation
The temperature rise in the contact zone is calculated by the empirical
formulas developed
by
Rashid and Seireg
[23]:
where
9,
=
I&
-
U2IWf'
where all the variables are defined in
the notation except the film thickness
h:
h
=
Eh0
E
is a factor proposed by Wilson and Sheu
[25]:
1
I
+
0.241[(1
+
14.8
z0.83)80.64]
&=
(7.28)
RollinglSliding
Contacts
1.5
.
o-sw-nn
U
=
0.303
mh
s$ted-Chromium
-st-=OPper
-
-V-sQt00(-sted
1
.o
n
E
E
n
Y
0.5
-
m
m
P
c
4r
P
v
0.0
~~'~~'"1'~''"'~''~'~~"'''"'~''
277
where
z
=
sliding/rolling ratio
6=-
rloY
u2
K
qo
=
lubricant viscosity at the entry condition
y
=
temperature-viscosity coefficient
of
the lubricant
U
=
mean rolling velocity
K
=
heat conductivity
of
the lubricant
7.7.3
Coating Thickness Effects
on
Temperature Rise
It
should
be
noted here that
Eq.
(7.27)
is
derived for the case when the two
entire disks have homogeneous properties, i.e.,
KI
,
CI,
PI,
El
for
disk
1
and
k2,
C2,
p2,
E2
for disk
2.
In order to use the formula
to
calculate the tem-
perature rise
for
coating surfaces, the temperature penetration depth,
D,
is
calculated and the result
is
plotted
in
Figs
7.14-7.16.
278
-
+Steel-Tin
U=IM#d
.
4-
Steel-Chromium
.
-A
Steel-Copper
.
-V-SteelSteel
Chapter
7
.
-0-Steel-Tin
.
4-
Steel-Chromium
,
-A-
Steel-Copper
.
’I-
Steel-Steel
U
-
2.76
nrh
Figure
7.15
Variation of temperature penetration depth on coated surface with
load for
U
=
1.44m/s.
v
D
E’”/
0.5
0.5
1
.o
1.5
2.0
2.5
3.0
3.5
4.0
W
(N/m
~10‘)
Figure
7.16
Variation
of
temperature penetration depth on coated surface with
load for
U
=
2.76m/s.
RoNinglSliding
Contacts
279
(7.29)
From Figs 7.14-7.16 it can be seen that the temperature penetration depth
in all cases is much higher than the coating thickness (0.0127mm). This
means that both the coating material properties and the base material prop-
erties must be considered during applying
Eq.
(7.27). Therefore, a coating
thickness factor
/?
is used to modify the temperature rise calculated with the
coating material properties:
(7.30)
where
hc
is
the coating thickness,
D
is
the temperature penetration depth for
steel under the corresponding conditions,
z
is a constant with a value
of
0.033. Figure 7.17 shows the variation of
/I
with the ratio
of
coating thick-
ness to temperature penetration depth.
0.00
0.02
0.04
0.06
0.08
0.10 0.12 0.14
0.16
hclO
Figure
7.1
7
Variation
of
@
with h,/D.