Friction and Lubrication in Mechanical Design Episode 2 Part 4 ppsx
Bạn đang xem bản rút gọn của tài liệu. Xem và tải ngay bản đầy đủ của tài liệu tại đây (988.6 KB, 25 trang )
0.06
0.05
0.04
0.03
cc
0.02
0.01
0.00
1
1
1
1
1
1
0
.oo
0.05
0.10
0.15
0.20
0.25
0.30
f
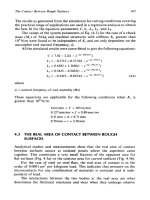
Figure
7.34
Calculated coefficient
of
friction
vs.
slidingjrolling ratio for different
rolling speeds,
T
=
26°C
(78.8"F),
steel-steel contact, ground surfaces,
S
=
0.3
pm
(12pin.),
W
=
378,812N/m
(2160
lbf/in.),
10W30 oil,
R
=
0.0234m
(0.92
in.).
0.06
0.05
0.04
0.03
cc
0.02
0.01
0.00
0.05
0.10
0.15
0.20
0.25
0.30
f
Figure
7.35
Calculated coefficient
of
friction
vs.
sliding/rolling ratio
for
different
normal loads,
T
=
26°C
(78.8"F),
steel-steel contact, ground surfaces,
S
=
0.3 pm
(12pin.),
U
=
3.2m/sec (216 in./sec), IOW30 oil,
R
=
0.0234m
(0.92
in.).
305
f
Figure
7.36
Calculated coefficient of friction
vs.
sliding/rolling ratio for different
effective radii,
T
=
26°C (78.8"F),
steel-steel contact, ground surfaces,
S
=
0.3 pm
(12pin.),
W
=
378,812N/m (2160
lbf/in.),
10W30
oil,
U1
=
3.2m/s (126
in./sec).
0.08
I
I I
1
I
0.07
0.06
0.05
0.04
0.03
0.02
0.01
0.00
I
I I
1
I
0.00
0.05
0.10
0.1
5
0.20
0.25
0.30
f
Figure
7.37
Calculated coefficient
of
friction
vs.
slidinglrolling ratio for different
viscosity, steel-steel contact, ground surfaces,
S
=
0.3
pm
(12
pin.),
W
=
378,8
12
N/m
(2160
lbf/in.),
IOW30
oil,
U1
=
3.2m/s (126
in./sec),
R
=
0.0234m (0.92
in.).
306
RoNingISliding Contacts
307
0.08
0.07
0.06
0.05
0.04
0.03
0.02
0.01
0.00
Stainless
Steel
(S.S)
-
Steel-Bronze
Steel-Ceramic
_
Steel-Steel
I
I
I
I I
Stainless
Steel
(S.S)
Steel-Ceramic
_
Steel-Steel
-
Steel-Bronze
-
I
I
I
I I
0.00 0.05
0.1
0
0.1
5
0.20
025
0.30
f
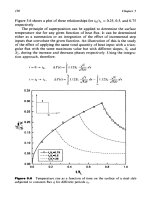
Figure
7.38
Calculated coefficient of friction
vs.
sliding/rolling ratio for different
materials,
T
=
26°C (78.8”F), ground surfaces,
S
=
0.3
pm (12 pin.),
W
=
378,812 N/m (2160 lbf/in.), 10W30 oil,
U1
=
3.2
m/s
(126 in./sec),
R
=
0.0234m (0.92 in.).
S
=
0.03
pm
(12pin.),
W
=
378,812N/m (2160lbf/in.),
10W30
oil,
U1
=
3.2
m/sec
(126
in./sec),
R
=
0.0234
m
(0.92 in.).
REFERENCES
1.
2.
3.
4.
5.
6.
Palmgren,
A.,
Ball and Roller Bearing Engineering,
S.
H. Burbank,
Philadelphia, 1945.
Tabor,
D.,
“The Mechanism of Rolling Friction,” Phil. Mag., Vol. 43, 1952, pp.
1055 and Vol. 45, 1954, p. 1081.
Rabinowicz,
E.,
Friction and Wear
of
Materials, John Wiley and Sons, New
York, NY, 1965.
Dowson,
D.,
and Higginson,
G.
R., Elastohydrodynamic Lubrication,
Pergamon, Oxford, 1977.
Grubin,
A.
N., Book No. 30, English Translation DSIR, 1949.
Dowson, D., and Whitaker,
A.
V.,
“A
Numerical Procedure for the Solution of
the
Elastohydrodynamic Problem of Rolling and Sliding Contacts Lubricated
308
7.
8.
9.
10.
11.
12.
13.
14.
15.
16.
17.
18.
19.
20.
21.
22.
23.
24.
Chapter
7
by a Newtonian Fluid,” Proc. Inst. Mech. Engrs,
1965-1966,
Vol.
180,
Part
3b,
Trachman, E.
G.,
and Cheng, H.
S.,
“Traction in EHD Line Contacts for Two
Synthesized Hydrocarbon Fluids,” ASLE Trans.,
1974,
Vol.
17(4),
pp.
27
1-279.
Hirst, W., and Moore, A. J., “Non-newtonian Behavior in EHD Lubrication,“
Proc. Roy. Soc. Lond. A.,
1974,
Vol.
337,
pp.
101-121.
Johnson, K.
L.,
and Cameron, R., “Shear Behavior of EHD Oil Films at High
Rolling Contact Pressures,” Proc. Inst. Mech. Engrs,
1967-1968,
Vol.
182,
Pt.
1,
No.
14.
Plint, M. A., “Some Recent Research on the Perbury Variable-Speed Gear,”
Proc. Inst. Mech. Engrs,
1965-1966,
Vol.
180,
Pt.
3B.
Crook, A. W., “The Lubrication of Rollers, Part
Ill,”
Phil. Trans. Roy. Soc.
Lond., Ser. A,
1961,
Vol.
254,
p.
237.
Conry, T. F., “Thermal Effects on Traction in EHD Lubrication,”
J.
Lubr.
Technol., Oct.
1981,
pp.
533-538.
Bair,
S.,
and Winer, W.
O.,
“Regimes
of
Traction in Concentrated Contact
Lubrication,” ASME Trans., Vol.
104,
July
1982,
pp.
382-386.
Plint, M. A., “Traction in Elastohydrodynamic Contacts,” Proc. Inst. Mech.
Engrs,
1967-1968, Vol.
182,
Pt.
1,
No.
1
14,
pp.
300-306.
Dyson, A., “Frictional Traction and Lubricant Rheology
in
Elastohydrodynamic Lubrication,” Phil. Trans. Roy. Soc. Lond.,
1970,
Vol.
266,
No.
1170.
Sasaki, T., Okamura, K., and Isogal, R., “Fundamental Research on Gear
Lubrication,” Bull. JSME,
1961,
Vol.
4(14).
Drozdov,
Y.
N.,
and Gavrikov,
Y.
A., “Friction and Scoring under the
Conditions
of
Simultaneous Rolling and Sliding of Bodies,” Wear,
1968,
Vol.
11.
O’Donoghue,
J.
P., and Cameron, A., “Friction and Temperature in Rolling
Sliding Contacts,’’ ASLE Trans.,
1966,
Vol.
9,
pp.
186-194.
Benedict, G. H., and Kelley, B.
W.,
“Instantaneous Coefficients of Gear Tooth
Friction,” ASLE Trans.,
1961,
Vol.
4,
pp.
59-70.
Misharin, J.
A.,
“Influence
of
the Friction Conditions on the Magnitude
of
the
Friction Coefficient in the Case of Rolling with Sliding,” Int. Conf. on Gearing.
Proc., Sept.
1958.
Ku, P. M., Staph, H. E., and Carper, H. J., “Frictional and Thermal Behavior
of the Sliding-Rolling Concentrated Contacts,” ASME Trans., J. Lubr.
Technol., Jan.
1978,
Vol.
100.
Li.
Y.,
“An Investigation on the Effects of the Properties of Coating Materials
on the Tribology Behavior of Sliding/Rolling Contacts,” Ph.D. Thesis, Univ.
of
Wisconsin,
1987.
Rashid, M.
K.,
and Seireg, A., “Heat Partition and Transient Temperature
Distribution in Layered Concentrated Contacts,” ASME Trans.,
J.
Tribol.,
July
1987,
Vol.
109,
pp.
49604502.
Hsue,
E.
Y.,
“Temperature and Surface Damage under Lubricated Sliding1
Rolling Contacts,” Ph.D. Thesis, University
of
Wisconsin-Madison,
1984.
p.
57.
RollinglSliding Contacts
309
25.
Wilson, W.
R.
D.,
and Sheu,
S.,
“Effect of Inlet Shear Heating Due to Sliding
and EHD Film Thickness,’’
J.
Lubr. Technol., April 1983,
Vol.
105.
26.
Cameron,
A.,
Basic Lubrication Theory, Longman Group, London, England,
1970.
27. Juvinall,
R.
C., Fundamentals of Machine Component Design, John Wiley
&
Sons, New York, NY, 1983.
8.1
INTRODUCTION
Wear can
be
defined as the progressive loss of surface material due
to
normal load and relative motion. This generally leads to degradation of
the surface, loss of component functionality, and in many situations, to
catastrophic failure.
The wear of mechanical components has been estimated to cost the
U.S.
economy between
6%
and
7%
of the gross national product. Understanding
the wear process and its control is, therefore, of major practical importance.
The highly complex nature of the wear process has made it difficult to
develop generalized procedures for predicting its occurrence and intensity.
Even wear tests under seemingly controlled conditions, are not always
reproducible. It is not unusual that repeated tests may give wear rates
which differ by orders of magnitude.
Surface damage or wear can manifest itself in many forms. Among these
are the commonly used terminology: pitting, frosting, surface fatigue, sur-
face cracking, fretting, blistering, plastic deformation, scoring, etc. Wear
types include elastic wear, plastic wear, delamination wear, abrasive wear,
adhesive wear, corrosive wear, cavitation erosion, etc. The occurrence of a
particular type
of
wear depends on many factors, which include the geome-
try of the surfaces, the nature of surface roughness, the applied load, the
rolling and sliding velocities. Other important factors which influence wear
are the environmental temperature, moisture, and chemical conditions, as
well as the mechanical, thermal, chemical, and metalurgical properties of the
surface layer and bulk material. The microstructure of the surface layer,
its
310
Wear
31
I
ductility, the microhardness distribution in it, and the existence of vacancies
and impurities also play critical parts in the wear process. Furthermore,
wear is highly influenced by the physical, thermal, and chemical properties
of the lubricant, the regime
of
lubrication, the mutual overlap between the
rubbing surfaces, and the potential for removal of the chemical layers and
debris generated in the process.
This chapter provides a conceptual evaluation of this extremely complex
phenomenon, and presents guidelines for its prediction and control.
Although the mechanism of wear is not fully understood, designers of
machine components have to rely on judgement and empirical experiences
to improve the functional life of their design. The success of their judgement
depends on their depth of understanding of which factors are relevant to a
particular situation, and which are only accessories.
It is interesting to note that with all the modern tools of experimenta-
tion and computation, generalized wear design procedures that would pro-
duce practical results are still beyond our reach. We have therefore to rely
on thoughtful interpretation of accumulated data and observations. One
such poignant observation was documented
2000
years ago by the Roman
philosophical poet Titus Caras Lucretius [l]: He said,
A
ring is worn thin next to a finger with continual rubbing. Dripping
water hollows a stone, a curved plow share, iron though it
is,
dwindles
imperceptibly
in
the furrow. We
see
the cobblestones of the highway
worn by the feet
of
many wayfarers. The bronze statues by the city
gates show their right hands worn thin by the touch
of
all travelers
who have greeted them in passing. We shall see that all these are being
diminished since they are worn away. But to perceive what particles drop
off
at any particular time is a power grudged to
us
by our ungenerous
sense of sight.
8.2
CLASSIFICATION OF
WEAR
MECHANISMS
It has not yet been possible to devise
a
single classification of the different
types of wear. Some
of
the mechanisms by which rubbing surfaces are
damaged are
[2]:
Mechanical destruction
of
interlocking asperities;
Surface fatigue due to repeated mechanical interaction between asperi-
ties or the variation
of
pressure developed in the lubrication;
Failure due to work hardening and increasing brittleness caused by
deformation;
Flaking away of oxide films;
312
Chapter
8
Mechanical damage due to atomic or molecular interactions;
Mechanical destruction of the surface due to the high temperatures
Adhesion or galling;
Corrosion;
Abrasion due to the presence of loose particles;
Cutting or ploughing of a soft material by a harder rough surface;
Erosion produced by impinging fluid or fluids moving with high rate of
produced by frictional heating;
shear.
The treatment in this chapter attempts to formulate general concepts about
the nature of wear, which can be readily associated with practical experience
and to provide equations which can be used for design purposes based on
these concepts. The broad categories to be considered are:
Frictional wear
Surface fatigue due to contact pressure
Microcutting
Thermal wear
Delamination wear
Abrasive wear
Corrosion or chemical wear
Erosion wear
8.3
FRICTIONAL
WEAR
In the broad category
of
frictional (or adhesive) wear considered in this
section,
it
is assumed that the material removal is the result of the mechan-
ical interaction between the rubbing surfaces at the real area of contact.
It
has been shown in Chapter
4
that the real area of contact is approximately
proportional to the normal load under elastic contact condition. The pro-
portionality constant is a function of the material properties, the asperity
density, the radius of the asperities, and the root mean square of the asperity
height.
The wear volume per unit sliding distance has been evaluated according
to this concept
by
several investigations. Their results are illustrated in the
following.
Archard
[3,
41,
as well as Burwell and Strang
[5],
proposed wear equa-
tions of the following form:
Wear
313
where
V
=
wear volume
L
=
sliding distance
P
=
applied load
oy
=
yield stress of the softer material
K
=
proportionality constant depending on the material combination and
test conditions (wear coeficient)
H,,,
=
microhardness of the softer material
Results obtained by Archard from dry tests where the end
of
a cylinder
6mm diameter was rubbed against a ring
of
24mm diameter under a
400g load at a speed
of
1.8m/sec are given in Table
8.1.
Rabinowicz
[6,
71
gave a similar equation:
Table
8.1
Dry Wear Coefficients for Different Material Pairs
Sliding against hardened tool steel
unless otherwise stated Wear coefficient,
K
(
103 kg/cm2)
Microhardness,
H,,,
Mild steel on mild steel
60/40
brass
Teflon
70/30
brass
Perspex
Bakelite (moulded) type 5073
Silver steel
Beryllium copper
Hardened tool steel
Stellite
Ferritic stainless steel
Laminated bakelite type
292/16
Moulded bakelite type 11085/1
Tungsten carbide on mild steel
Moulded bakelite type 547/1
Polyet hylene
Tungsten carbide on tungsten carbide
7
x
10-’
1.7
10-~
7
x
10-6
7.5
x
10-6
3.7
x
10-‘
1.3
10-~
5.5
x
10-’
1.7
10-~
7.5
10-7
4
x
10-6
3
10-~
1.3
10-~
1
x
10-6
6x
10-4
2.5
x
10-’
6
x
10-5
1.5
x 10-6
18.6
9.5
0.5
6.8
2.0
2.5
32
21
85
69
25
3.3
3.0
18.6
2.9
0.17
130
314
Chapter
8
where
Y
=
wear volume (in.3)
L
=
sliding distance (in.)
A
=
surface area (in.2)
P
=
applied load (lb)
U,,
=
yield strength
of
the softer material (psi)
h
=
depth
of
wear
of
the softer material
(in.)
k
=
wear coefficient
Values of
k
for different material combinations are given in Table
8.2.
The depth of wear
of
the harder material
hh,
can be calculated from:
2
$=(&)
(8.3)
For conditions where the load and
or
the surface temperature are high
enough to cause plastic deformation, the wear rate as calculated from
Eqs
(8.1)
and
(8.2)
can be several orders
of
magnitude higher (in the order
of
Table
8.2
Wear Coefficients,
k,
for Metal Combinations
Metal combination
k
x
10-4 Metal combination
k
x
10-4
Cu vs. Pb
Ni
vs.
Pb
Fe vs. Ag
Ni vs. Ag
Fe vs. Pb
A1 vs. Pb
Ag
vs.
Pb
Mg vs. Pb
Zn
vs.
Pb
Ag
vs.
Ag
A1 vs. Zn
A1 vs. Ni
A1 vs. Cu
A1 vs. Ag
A1 vs. Fe
Fe vs. Zn
Ag vs. Zn
Ni vs. Zn
0.1
0.2
0.7
0.7
0.7
1.4
2.5
2.6
2.6
3.4
3.9
4.7
4.8
5.3
6.0
8.4
8.4
11.0
Zn vs. Zn
Mg
vs.
AI
Zn vs. cu
Fe vs. Cu
Ag vs.
Cu
Pb vs. Pb
Ni vs. Mg
Zn
vs.
Mg
A1 vs. A1
Cu vs. Mg
Ag vs. Mg
Mg vs.
Mg
Fe vs. Mg
Fe
vs. Ni
Fe vs. Fe
Cu vs. Ni
cu
vs. cu
Ni vs. Ni
11.6
15.6
18.5
19.1
19.8
23.8
28.6
29.1
29.8
30.5
32.5
36.5
38.5
59.5
77.5
81.0
126.0
286.0
Wear
315
1000
times). This is generally known as “plastic wear” and often leads to
very rapid rate
of
material removal.
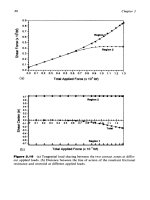
Krushchov and coworkers
[8,
91 developed a similar linear relationship
between wear resistance and hardness for commercially pure and annealed
materials. This relationship is given in Fig.
8.1.
A
particularly interesting
result was obtained by them for heat-treated alloy steels.
As
shown in Fig.
8.2,
the wear resistance for the steels in the annealed condition increased
linearly with hardness. However, increasing the hardness
of a particular
alloy by heat treating produced a smaller rate
of
increase
of
the relative
wear resistance. This clearly
suggests
that the relative wear resistance
of
a
material does not only depend
on
its hardness but is also influenced by the
40,
I
1
I
0
100
200
300
H
(kglmm‘)
Figure
8.1
commercially pure metals.
(From
Ref.
8.)
Relationship between relative wear resistance and hardness for some
316
Chapter
8
0
200400600800
H
(kg/mm2)
Figure
8.2
treated steels. (From Ref.
8.)
Relationship between relative wear resistance and hardness for heat
presence of microscopic and submicroscopic inhomogeneities in the lattice
structure by distortions of the lattice. It was also found by them that increas-
ing the hardness further, by work hardening, did not improve the relative
wear resistance and, in some cases, even reduced it.
Frictional surface damage can also occur as a result
of
the interpenetra-
tion of asperities, which produce tensile stress in the surface layer due to the
bulge formed ahead
of
the indentor (refer to Fig.
8.3).
Cracks can form
perpendicular to the surface at imperfections such as lattice vacancies,
grain boundaries and metalurgical defects including pores, gas bubbles,
slag inclusions, and marked disparity in grain size.
Wear
31
7
Figure
8.3
Cracks at surface imperfections due to repeated asperity action.
8.4
WEAR
DUE
TO
SURFACE FATIGUE
8.4.1
Contact
Fatigue
The most common example of the type of surface damage
is
what is gen-
erally known as “pitting” or contact fatigue. It often exists in rolling element
bearings and gears and is attributed to the propogation of fatigue cracks
originating on or below the surface when the Hertzian pressure exceeds an
allowable value.
As
one element rolls many times over the other element, a
subsurface region undergoes cycles
of
shear ranging from zero to maximum.
This situation would be expected to promote fatigue damage when the
maximum shearing stress is higher than the fatigue limit for the material
in this region. Subsurface cracks may occur and these cracks will propogate
to the surface under repeated loading and consequently forming a pit or
a
spall. The equations for calculating the maximum subsurface shear stress
and its location can be written as follows.
For cylindrical contacts:
qo
=
maximum contact stress
=
0.418
-
{E:,
tmax
=
maximum subsurface shear stress
=
o.304q0
-
For spherical contacts:
318
Chapter
8
rmax
*
0.4lz
P
E:
where
2
=
location of the maximum shear below the surface (in.)
P
=
applied load
(lb)
L
=
length of cylinders
1
-+-
RI
R2
I
-+-
Re=
I
-
effective radius
Ee=
-
effective modulus of elasticity
El
E2
These equations are widely used as the basis for predicting the surface
durability of rolling element bearings and gears.
The number
of
cycles to pitting failure,
N,
generally follows the follow-
ing fatigue equation:
N"n~max
=
C
where
rmax
=
maximum shear stress
C
and
n
are constants for each material.
Accordingly, the life ratio depends on maximum shear stress:
The value
of
n
varies between
6
and 18 for most materials.
generally used. It can be expressed as:
For cumulative fatigue under different stress cycles, the Miner theory is
where
Ni
=
number of cycles at any stress level
Nir
=
number of cycles
to
failure at that stress level
Wear
319
8.4.2
The
IBM
Zero
Wear
Concept
Because of the stringent requirements on the minimization of wear in elec-
tronic equipment,
IBM
conducted extensive wear experiments in order to
allow reliable prediction of their useful life
[lO-12].
The criterion for zero
wear is that the depth of the wear scar does not exceed one half of the peak-
to-peak value of the surface roughness. This may be a severe requirement for
most mechanical equipment, which can tolerate considerably larger
amounts
of
wear without loss of functionality.
The empirical equation developed by
IBM
is given as follows, based on
2000
cycles as the reference number in their tests:
2000
''9GY
s5
(7)
where
S,
=
the maximum shear stress produced by sliding
in
the vicinity of the
contact region
N
=
number of passes one element undergoes
in
the relative motion
(or number of contact cycles)
Y
=
yield point in shear (psi) which is
a
function of the microhardness of the
surface as given in Fig.
8.4)
and Table
8.3
G
=
empirical factor determined from the tests. Surprisingly, it was found to
take one of the following two values depending on the material pair
and the lubrication condition
G
=
1.0
for full
film
lubrication
G
=
0.54
for quasihydrodynamic lubrication
For unlubricated or boundary lubrication conditions,
G,
takes one of only
two possible values:
G
=
0.54
for systems with low susceptibility for transfer
G
=
0.20
for systems with high susceptibility for transfer
Table
8.4
gives the values of
G
for different material combinations tested by
IBM.
IBM
used the concept
of
mutual overlap in defining the number of
passes. The coefficient of mutual overlap
(KmUl)
can be defined as:
320
Chapter
8
Table
8.3
Values
of
Yield Point in Shear,
Y,
and Microhardness,
H,,,
Hm
(yl
y
Material mm (psi
x
10~)
Hm
(tg/
y
Material mm (psi
x
10~)
Stainless steels
302
303EZ
32
1
347
410
41 6
EZ:
H,,
44oc
Steels
1018
1045
1055
1060
I085
1117
4140
4140LL
41
50
4620
5 130LL
8214
8620
52 100
Carpenter
11
annealed
Hampden steel
annealed
HYCC( HA)
HYCC(PM)
Ketos
Nitralloy
G
Rexalloy AA
Star Zenith
annealed
Nickel alloys
Invar “36”
annealed
H,M,80
annealed
Monel
C
270
296
224
252
270
270
224
296
I99
468
270
397
3 59
160
I80
384
276
242
260
220
216
746
220
226
262
340
270
296
396
350
269
184
270
184
58
63
40
50
58
58
40
63
33
106
58
90
80
27
32
82.5
65
47
55
40
40
150
40
40
55
75
58
63
90
80
58
30
58
40
~
Copper alloys
Brass
Be-Cu
Cu-Ni
Phosphor-Bronze
Aluminum alloys
43 aluminum
112
aluminum
195
aluminum
220 aluminum
355 aluminum
356 aluminum
Sintered materials
Sintered brass
1
Sintered brass
2
Sintered bronze
1
Sintered bronze 2
Sintered iron
I
7.5
min
Sintered iron 2
7.3 min
Sintered iron 3
7.0 rnin
Sintered iron
copper
I
7.1 copper
infil.
-
15%
Sintered steel
1
7.0 rnin
Stainless 3 16
1
Sintered steel
2
7.0 rnin
7.5 min
7.0-7.5
ASTM B202-58T
ASTM B255-61T
5.8-6.2
-
20%
115
17.9
199 31
171 35
I66 27
60.7 8
117
15
96.8
15
124.5 18
90.5 14
62.
I
8
115 17.9
96 74
I35 22.5
I50 25
180 31.5
150
25
110
17.9
220
40
I90
33
220 40
150 25
Wear
32
I
1000
10
100
1000
10000
100000
Yield Point in shear,
Y
(psi)
Figure
8.4
Microhardness,
H,,,,
as
a
function
of
the yield point in shear.
where
A:, A:
are the apparent areas subjected to sliding for each of the
surfaces. Two extreme examples are illustrated in Fig. 8.5. For the two hollow
cylinders condition,
Knlu,
=
1,
and for the pin on disk condition,
KntU,
FZ
0.
Several illustrative examples for the method of determining
N
and cal-
culating
Ss
used by
IBM
are given in the following. The coefficient of fric-
tion
p
used for calculating
S,
for different combinations of materials is given
in Table
8.4.
For the cam and follower shown in Fig. 8.6a:
N
for
the cam
=
number of strokes
N
for the follower
=
(F)
(number of revolutions)
For the ball reciprocating on
a
plate shown in Fig.
8.6b:
N
for
the plate
=
number of strokes
length of
stroke
W
(number of strokes)
N
for the ball
=
For the shaft rotating in a bearing:
N
for the shaft
=
number of revolutions
N
for the journal
%
2
(number of revolutions)
322
Chapter
8
Table
8.4
G-Factors and Friction Coefficient for Various Material Combinations
Material Oila
G
p
Material Oila
G
P
52100
vs.
stainless steel
302
32
1
440
c
52100
vs.
steel
1045
1060
4140
LL
52100
Carpenter
1
1,
special steel,
annealed
Hampden steel,
annealed, oil
wear
HYCC (HA)
HYCC (PM)
Ketos
Dry 0.20
1.00
A 0.20 0.19
B 0.20 0.16
Dry 0.20
1.16
A 0.54 0.17
B
0.54
0.13
Dry 0.20
0.66
A 0.54 0.18
B 0.20 0.13
Dry 0.20
0.67
A 0.45 0.15
B
0.20
0.17
Dry 0.20
0.73
A 0.20
0.14
B 0.20 0.21
Dry 0.20
0.57
A
0.20 0.21
B
0.20 0.17
Dry 0.20
0.60
A
0.20
0.21
B 0.20
0.16
Dry 0.20
0.78
A 0.45 0.18
B 0.45 0.16
Dry
0.54
-
A 0.54 0.13
B 0.54 0.12
Dry
0.20 0.62
A 0.54 0.13
B 0.54 0.11
Dry 0.20
0.64
A
0.20 0.16
B 0.20
0.17
Dry 0.20
0.67
A 0.54 0.18
B
0.54
0.15
Ni
trallo y-G
Dry 0.20
A 0.20
B 0.20
Rexalloy AA Dry
0.20
A 0.54
B 0.20
Star Zenith steel
Dry 0.20
annealed red A 0.54
wear B 0.20
52100
vs.
steel
Carpenter free
Dry
0.20
cot invar “36” A 0.20
annealed B 0.20
Monel C Dry 0.20
A 0.20
B 0.54
52100
vs.
copper
alloy
Cu-Ni Dry 0.20
A 0.54
B 0.54
Phorphorus- Dry 0.20
Bronze A A 0.20
B
0.54
52100
vs.
aluminum alloy
112 Aluminum Dry
0.20
A 0.54
B 0.20
195 Aluminum Dry 0.20
A
0.54
B
0.54
355 Aluminum Dry 0.20
A 0.54
B
0.54
52100
vs.
sintered materials
Sintered brass Dry 0.20
A 0.20
B
0.20
0.63
0.15
0.13
0.73
0.13
0.13
0.63
0.12
0.12
1.28
0.24
0.18
0.73
0.12
0.14
1.23
0.2
1
0.15
0.67
0.19
0.16
1.08
0.25
0.15
1.07
0.17
0.13
1.21
0.13
0.20
0.32
0.2
1
0.16
Wear
323
Table
8.4
Continued
Material Oila
G
~1
Material
Oila
G
p
Sintered bronze Dry
0.20
A
0.20
B
0.20
Sintered iron Dry
0.20
A
0.20
B
0.54
Sintered
iron-
Dry
0.20
copper A
0.20
B
0.54
Sintered steel Dry
0.20
A
0.54
B
0.54
302
vs.
stainless steel
302
Dry
0.20
A
0.20
B
0.20
32
1
Dry
0.20
A
0.54
B
0.54
440
c
Dry
0.20
A
0.54
B
0.20
302
vs.
steel
1045
Dry
0.20
A
0.20
B
0.54
I060
Dry
0.20
A
0.54
B
0.20
4140
LL
Dry
0.20
A
0.54
B
0.54
5130
LL
Dry
0.20
A
0.20
B
0.20
Carpenter
11
Dry
0.20
special steel A
0.54
annealed
B
0.20
0.26
0.23
0.1
1
0.38
0.2
1
0.23
0.47
0.20
0.19
0.34
0.15
0.15
1.02
0.16
0.15
1.47
0.15
0.14
0.90
0.13
0.15
0.71
0.16
0.14
0.88
0.16
0.15
0.78
0.14
0.14
0.84
0.16
0.14
0.84
0.16
0.14
HYCC(HA) Dry
A
B
A
B
Star Zenith steel Dry
annealed red A
wear
B
302
vs.
nickel alloy
Carpenter free Dry
cut Invar
“36”
A
annealed
B
Nitralloy
G
Dry
302
vs.
nickel alloy
Monel C Dry
A
B
302
vs.
aluminum alloy
112
Aluminum
195
Aluminum
355
Aluminum
302
vs.
plastic
Delrin
Nylatron
G
Polyethylene
0.54 0.89
0.54 0.14
0.54 0.14
0.20
0.83
0.54 0.14
0.54 0.14
0.20 0.93
0.54 0.15
0.54 0.14
0.20
1.33
0.20
0.16
0.20
0.19
0.20
0.99
0.20
0.15
0.20
0.15
Dry
0.20
1.16
A
0.54
0.20
B
0.54 0.14
Dry
0.20
1.17
A
0.54 0.15
B
0.54 0.14
Dry
0.20
1.1
1
A
0.54 0.17
B
0.54 0.20
Dry
0.54 0.36
A
0.54 0.15
B
0.54 0.18
Dry
0.54 0.57
A
0.54 0.22
B
0.54 0.24
Dry
0.54 0.26
A
0.54
0.17
€3
0.54
0.17
324
I
i
Chciptcr
X
Table
8.4
Continued
~
Material
Oila
G
p
Material
Oila
G
p
Teflon Dry
A
B
A
B
Brass
vs.
stainless
steel
A
B
A
B
A
B
Zytel
101
Dry
302
Dry
32
1
Dry
440
c
Dry
0.54
0.09
0.54
0.15
0.54
0.1
1
0.54
0.60
0.54
0.27
0.54
0.27
0.20
0.70
0.20
0.22
0.54
0.19
0.20
0.78
0.20 0.23
0.54
0.13
0.20 0.72
0.20
0.18
0.54
0.16
Brass
vs.
steel
1045
Dry
0.20
0.66
A
0.20
0.20
B
0.20 0.12
4140
LL
Dry
0.20
0.73
A
0.20
0.22
B
0.20 0.24
52100
Dry
0.20
0.80
A
0.20
0.26
B
0.54
0.20
"Oil
A
~
Socony Vacuum Gargole
PE797
(Paraffin
type;
VI
=
105).
011
B
~ Esso
Standard
Millcot K-50
(Naphthenic type;
VI
=
77).
b.
(a)
(b)
Figure
8.5
Coefficient
of
mutual overlap. (a)
K,,,,,,
=
1;
(b)
Kn,,,,
0.
Wear
325
Motion
of
follower
Cam and follower
Length
of
strokg
4
q
Reciprocating ball and plate
(c)
Shaft and journal bearing
Figure
8.6
Illustration of evaluating number
of
passes based on the concept
of
mutual overlap.
(a)
Cam and follower;
(b)
reciprocating ball and plate;
(c)
shaft
and
journal bearing.
Figure 8.7 shows three groups of different types of contact. The proce-
(a) For area contacts
dure used by
IBM
for calculating the surface shear stress
is
as follows:
(b) For line contacts
when sliding in the circumferential direction and
326
Chapter
8
when
sliding
in
the
axial
direction
where
qo
=
the maximum Hertzian contact pressure
p
=
coefficient of friction from Table
8.4
K
=
stress concentration factor at the edges or corners, which depends on sharpness
(c) For spheres
on
spheres or crossed cylinders (point contacts)
where
qo
=
maximum Hertzian contact pressure
a, b
=
half major and minor axes for the elliptical area
of
contact
(a
=
b
for circular contact)
U
=
Poisson’s ratio
(b)
Slkling
line
contact
(0)
Sliding point
contact
(a)
SHdicrg
close
conhrming
surfacer
Cylinder
within
oylindor
Figure
8.7
Examples
of
types of contact. (a) Sliding close-conforming surfaces:
plane on plane, cylinder within cylinder, sphere within sphere; (b) sliding line con-
tact: cylinder on cylinder, cylinder on cylinder, cylinder on plate; (c) sliding point
contact: sphere on sphere, crossed cylinders.
Wear
327
8.5
WEAR
BY
MICROCUTTING
Another mechanism for wear is the penetration
of
hard asperities into a
softer material under conditions, which produce microcutting. An illustra-
tive model for this mechanism is shown in Fig. 8.8, where an asperity with
radius
R
is penetrated a depth
h
in the softer material and is sliding with
respect to it. The equilibrium equations can be written as:
pN
=
Qcosa
-
Psina
N
=
Qsina+
Pcosa
from which
Q-CLP
PQ+P
tana
=
-
where
P
=
normal resistance at the contact
Q
=
shear resistance at the contact
p
=
coefficient
of
friction
The cutting condition occurs when sliding relative to the bulge is not pos-
sible. For this condition:
pN
>
Qcosa
-
Psina
because
h
=
R(l
-
cosa)
1
=
d
Therefore, the condition for cutting can be expressed as:
Figure
8.8
Model for microcutting.
328
Chapter
8
In general,
P
and
Q
are functions of the strength of the surface layer
o.~.
Accordingly,
where
C,
and
C2
are constants. Therefore, the condition for cutting:
and the depth
of
penetration ratio, which controls sliding or microcutting,
depends on the coefficient
of
friction and the material properties of the
surface layer.
Accordingly, by assuming
C2
=
C1,
the value of
h/R
for the onset of
microcutting can be calculated as:
CL
0.0
0.1
0.2
0.3
0.4
0.5
0.6
-
h
0.293
0.226 0.168 0.12 0.081 0.05
0.0
R
An empirical expression for the relationship between
h/R
and
p
for the
onset of cutting can be written as:
h
-
=
(0.56
-
1.3~)~
R
from which:
LL
0.0
0.1
0.2
0.3
0.4 0.43
-
h
0.314 0.185
0.09
0.029
0.004
0.0
R
8.6
THERMAL
WEAR
Frictional heating and the associated heat partition and temperature rise in
sliding contacts are known to be major factors which influence surface
damage. Wear in brakes and scoring in gears are well recognized to be
thermally induced surface failures. The former occurs in the unlubricated
Wear
329
condition, whereas the latter occurs in the presence of lubrication.
It
is also
well known that in the case of brakes made of hard materials, surface cracks
are likely to appear. Similarly in the case of gears made of very hard materi-
als, surface cracks are known to occur and propagate to form surface
initiated pits or in certain cases, complete fracture of the tooth.
A
network of cracks is frequently observed on surfaces subjected to
repeated heating and cooling as a result of the thermal gradients between
the surface layers and the bulk material (thermal fatigue). Cracks can also
occur
if
the surface is subjected to one sudden temperature change (thermal
shock).
Each thermal cycle creates a microscopic internal change in the material
structure. Subsequent cycles cause cumulative change and eventually create
microscopic cracks at voids in the material or at the grain boundaries.
If
these cracks are propagated in the surface layers, they can produce wear or
pitting. They can also produce fracture if they propagate deeper in the bulk
material, usually under the influence of cyclic mechanical loading.
Microscopic thermal cracks or potential crack sites on or near the sur-
face may occur as a result of the manufacturing or heat treating process,
especially for hard materials.
The objective of this section is to illustrate the importance of surface
temperature not only on scoring, surface cracking, and pitting, but also on
different forms of wear and surface damage.
8.6.1
Mechanism
of
Scoring
Scoring of surfaces is universally recognized as the result of high tempera-
tures at the contacts called the critical temperature. In the case of unlubri-
cated surfaces, this temperature is generally considered to cause softening or
melting of the surface layers of the material, the chemical layer, the solid
lubricant film or any coated layer which exists on the surface.
In lubricated conditions with nonreactive lubricants, the common
hypothesis is that scoring will be initiated when the temperature reaches a
critical value beyond which the lubricant loses its adsorption characteristics
(desorption) and consequently, fails to wet the surface. This temperature is
widely known as the Blok flash temperature
Tf
(1
3,
141
and is given for the
case of rolling and sliding cylinders
as: