Friction and Lubrication in Mechanical Design Episode 2 Part 5 doc
Bạn đang xem bản rút gọn của tài liệu. Xem và tải ngay bản đầy đủ của tài liệu tại đây (1.04 MB, 25 trang )
330
Chapter
8
where
K
=
constant for the material lubricant
f
=
coefficient of friction
W,,
=
normal load per unit length
b
=
width of the contact band
Y,
,
V2
=
surface velocities
C,,
C2
=
constants of materials which are the square root of the product
of
the
thermal conductivity, specific heat, and density
A
modification of Blok’s formula was proposed by Kelly
[15]
for similar
materials with consideration of surface roughness. The formula is given as:
where
TT
=
total surface temperature
TB
=
material bulk temperature
S
=
rms
surface roughness (pin.)
K
=
constant for the material lubricant combination
8.6.2
Mechanism for Surface Crack Initiation
It is generally accepted that the penetration of asperities causes plastic
deformation in the surface layers where the yield point is exceeded at the
real area of contact. Below the plastically compressed layer are layers under
elastic compression.
As
soon as the asperity moves, the elastically com-
pressed layers will exert upon the plastic layer a force, which will create in
it a state of tension. Consequently, tensile stresses will appear on the surface
in such conditions.
The sliding motion also generates a temperature field, which pene-
trates the surface layers. The maximum temperature occurs at the contact
surface and decreases with increasing distance from the surface as dis-
cussed in Chapter
5.
Accordingly, the surface layer is thermally elongated
more than the subsurface layers and will experience compressive stresses
Wear
331
imposed by the bulk material. If this compressive stress exceeds the yield
stress, then a tensile residual stress will be induced in the surface after
cooling. It should also be noted that the temperature at the real area of
contact can be very high at high sliding speeds which results in reducing
the yield strength significantly and thus, increasing the stressed zone.
The tensile thermal stress on the surface can be calculated from
[
161:
where
4’
cL=
a=
PO
=
V=
ap
=
K=
P=
C=
E=
B=
heat flux caused by friction
=
pPOVap
coefficient of friction
coefficient of thermal expansion
pressure on the real area
of
contact
sliding velocity
m
m+%PGG
coefficient of heat partition
=
thermal conductivity
density
thermal capacity
modulus
of
elasticity
7
&
thermal diffusivity
=
A
combination of mechanically induced stresses and thermal stresses in the
nominal contact region, or in the real area of contact, generate surface
or
near surface cracks, which can propogate with repeated asperity action to
generate delamination of the surface layer [17] or wear debris from shallow
pits. The influence of the thermal effect becomes more significant at high
loads, high coefficient of friction, and high sliding speeds.
As
illustrated by the parametric analysis in Chapter
5,
the physical,
chemical, and thermal properties
of
the lubricant can have significant influ-
ence on the maximum surface temperature. These properties control the
amount
of
separation between rubbing surfaces and the thermal properties
of the chemical layers generated on them.
332
Chapter
8
8.7
DELAMINATION WEAR
Delamination wear denotes the mechanism whereby material loss occurs as
a result of the formation of thin sheets (delaminates) with thickness depen-
dent on the normal load and the coefficient of friction. The sequence of
events which leads to the delamination can be summarized as follows:
Surface tractions applied repeatedly by asperity action produce subsur-
Cracks are nucleated below the surface.
Further loading causes the cracks to extend and propagate joining
The cracks propagate parallel to the surface at a depth governed by the
After separation from the surface laminates may be rolled due to the
face deformation.
neighboring ones.
material properties and the coefficient of friction.
sliding action to form wear debris.
A comprehensive analysis of delamination wear can be found in Ref. 17.
8.8
ABRASIVE WEAR
Abrasive or cutting wear takes place when hard particles are present
between the rubbing surfaces. Such particles include metallic oxides, abra-
sive dust, and hard debris from the environment. These particles first pene-
trate the metal and then tear off relatively large particles from the surface.
It
is one
of
the most common forms of wear and can be manifested in scratch-
ing marks or gouging of the surfaces
[
18,
191.
The load and the size of the abrasive particles relative to the thickness
of
the lubricating film are major factors which affect the weight loss by abra-
sive wear. The equation for abrasive wear can be expressed
as:
NL
V=k-
3
0,s
where
V
=
wear volume
N
=
normal load
L
=
sliding distance
=
surface strength
k
=
wear coeficien
t
Wear
333
Representative values for
k
given by Rabinowicz are tabulated below:
It should be noted the abrasive wear may result from, or can be accel-
erated by, the wear particles themselves. Wear particles for unlubricated
steel can be as large as 50pm in size. For well-lubricated steel, they are in
the order of
2-3
pm. Clearance between well-lubricated surfaces should be at
least 4pm in order to allow the wear particles to leave the contact region.
8.9
CORROSIVE
WEAR
Corrosive or chemical wear takes place when the environmental conditions
produce a reaction product on one or both of the rubbing surfaces and this
chemical product is subsequently removed by the rubbing action. A com-
mon example is the corrosive wear of metals in air, which usually contains
humidity and other industrial vapors. Oxides or hydroxides of the metals are
continuously formed and removed. Carbonates and oxycarbonates may also
occur from the normal CO2 present in the air. Chlorides and oxychlorides
are known to occur in industrial environments or in near-ocean operations.
The use of an appropriate lubricant can inhibit the corrosion mechan-
ism and provide the necessary protection in a corrosive environment. On the
other hand, the lubricant itself may contain chemical elements, which react
with the metals. The degree
of
effectiveness of the lubricant in reducing
corrosive wear will depend on its chemical composition and the amount
of dissolved water which may naturally exist in it.
An example of intentionally inducing corrosive wear to prevent a more
severe condition of surface damage
is
the use of extreme pressure
(EP)
additives in the lubricant. This is a common practice when scoring, galling,
or scuffing is to be expected. The
EP
additive reacts with the surface at the
locations where high pressures and high speeds create high temperatures and
consequently catastrophic galling or seizure are replaced by mild corrosive
wear. References
20-26
contain more details and experimental data on the
subject for the interested reader.
8.10
FRETTING CORROSION
This type of surface damage generally occurs in mechanical assemblies such
as press fits and bolted joints due to the combination of high normal pres-
sure and very small cyclic relative motion. It is characterized by discolora-
tion of the mating surfaces and wearing away of the surfaces.
334
Chapter
8
Many examples can be cited in the literature of the existence of fretting
corrosion in machine parts and mechanical structures
[27-331.
It is reported
to be influenced by the hardness of the materials, the surface temperature, the
coefficient of friction, humidity, lubrication, and the chemical environment.
One of the early empirical formulas is that proposed by Uhlig
[30]
as:
N
w
=
(koP1’2
-
kl
P)
-
+
kzaPN
f’
where
W
=
total weight
loss
(mg)
P
=
pressure (psi)
N
-
number
of
cycles
f
=
frequency
(Hz)
a
=
slip distance
(in.)
ko,
k,
k2
and constants
The constants for his data are:
ko
=
5.05
x
10-6,
kl
=
1.51
x
10-*,
k2
=
4.16
x
10-6
Measures, which can be used to reduce fretting include the minimization
of
the relative movement, reducing friction, use
of
an appropriate dry or liquid
lubricant and increasing the surface resistance
to
abrasion.
8.1
1
CAVITATION WEAR
Cavitation is defined as the formulation of voids within or around a moving
liquid when the particles of the liquid fail to adhere to the boundaries
of
the
passage way. It can produce erosion pitting in the material when these voids
collapse. Cavitation was first anticipated by Leonard Euler in 1754 to occur
in hydraulic turbines. It is known to occur in ship propellers operating at
high speed
[34-361.
The mechanism
of
cavitation wear is generally explained by the forma-
tion of bubbles where the absolute pressure drops below the vapor pressure
of the surrounding liquid. These bubbles collapse at extremely high veloci-
ties producing very high pressures over microscopically small areas. The
smaller the size of the bubble, the smaller the velocity of collapse and con-
sequently, the smaller the pressures produced. There appears to be a corre-
Wear
335
lation between the rate of pitting and the vapor pressure and the surface
tension of the liquid.
The equilibrium of a vapor bubble can be expressed as:
2s
Pi
=
Pe
-
-
r
where
Pi
=
internal pressure
Pe
=
external pressure
S
=
surface tension
r
=
radius
of
the bubble
and
Pi
equals the vapor pressure.
The capillary energy
E
of the bubble can also be expressed as:
where
ro
=
radius of the bubble before collapse
This energy
of
collapse is generally considered to be the cause of cavitation
erosion pitting and wear.
8.12
EROSIVE WEAR
Erosive wear occurs due to the change
of
momentum of a fluid moving at
high speed. It has been observed in the wear of turbine blades and in the
elbows of high-speed hydraulic piping systems. In its extreme condition,
erosive wear
is
the mechanism utilized in water jet cutting systems. The
change in the fluid particle velocity
(A
V)
as it impinges on the metal surface
can create
a
high impact pressure which is a function of the density
of
the
fluid and the modulus of elasticity
of
the impacted material
[37,
381.
The
effect of the high pressures on wear is partly enhanced by the shearing action
of the liquid as it flows across the surface.
The pressure generated due to the change in velocity can be quantified
as:
P=(AV)&
336
Chapter
8
where
P
=
impact pressure
E
=
modulus of elasticity
of
the material
p
=
density
of
the material
Surface damage due to erosive wear can be reduced by elastomer coating
[39]
and cathodic protection
[40].
The latter process causes hydrogen to be
liberated and to act as a cushion for the impact.
Erosive wear
is
used to advantage in the cutting, drilling, and polishing
of brittle materials such as rocks. The erosive action can be considerably
enhanced by mixing abrasive particles in the fluid. Empirical equations for
the use of water jets with and without abrasives in cutting and drilling are
given later in the book.
REFERENCES
1.
2.
3.
4.
5.
6.
7.
8.
9.
10.
11.
12.
Hays, D., Wear Life Prediction in Mechanical Components,
F.
F.
Ling Ed.,
Industrial Research Institute, New York, NY, 1985,
p.5.
Kragelski,
I.
V., Friction and Wear, Butterworths, Washington, D.C., 1965.
Archard,
J.
F., “Contact and Rubbing of Flat Surfaces,”
J.
Appl. Phys.,
Vol.
24, 1953.
Archard,
J.
F., and Hirst, W., “The Wear of Metals Under Lubricated
Conditions,” Proc. Roy. Soc., 1956, A 236.
Barwell,
J.
T.,
and Strang, C.
D.,
“On the Law of Adhesive Wear,”
J.
Appl.
Phys., 1952, Vol. 23.
Rabinowicz, E., “Predicting the Wear
of
Metal Parts,” Prod. Eng., 1958, Vol.
29.
Rabinowicz, E., Friction and Wear
of
Materials, John Wiley
&
Sons, New
York, NY, 1965.
Krushchov, M. M., and Babichev, M. A., Investigation of the Wear of Metals,
USSR Acad. Science Publishing House, 1960.
Krushchov, K. K., and Soroko-Navitskaya, A. A., “Investigation of the Wear
Resistance of Carbon Steels,” Iav. Akad. Nauk, SSSR, Otd. Tekh. Nauk., 1955,
Vol. 12.
Mechanical Design and Power Transmission Special Report, Prod. Eng., Aug.
IS,
1966.
Bayer, R.
G.,
Shalkey, A.
T.,
and Wayson, A. R., “Designing for Zero Wear,
Mach. Des., Jan. 9, 1969.
Bayer,
R
G.,
and Wyason, R., “Designing for Measureable Wear,“ Mach. Des.,
Aug.
7,
1969.
Wear
33
7
13.
14.
15.
16.
17.
18.
19.
20.
21.
22.
23.
24.
25.
26.
27.
28.
29.
30.
31.
32.
33.
34.
Blok, H., “Les Temperatures de Surfaces dan les Conditions de Craissage sans
Pression Extreme,” Second World Petroleum Congress, Paris, June 1937.
Blok,
H.,
“The Dissipation of Frictional Heat,” Appl. Scient. Res., Sec. A,
1955,
Vol.
5.
Kelly, B. W., “A New Look at Scoring Phenomena of Gears,” SAE Trans.,
1953,
Vol.
61.
Barber, J. R., “Thermoplastic Displacement and Stresses Due to a Heat Source
Moving over the Surface of a Halfplane,” Trans. ASME, J. Eng. Indust., 1984,
pp. 636-640.
Suh, N. P., and coworkers, The Delamination Theory of Wear, Elsevier, New
York, NY,
1977.
Haworth, R.
D.,
“The Abrasion Resistance of Metals,” Trans. Am. Soc.
Metals, 1949,
Vol.
41, p. 819.
Avery, H.
S.,
and Chapin, H. J., “Hard Facing Alloys of the Chromium
Carbide Type,” Weld. J., Oct. 1952,
Vol.
31(10), pp. 917-930.
Uhlig,
H.
H., Corrosion Handbook,
J.
Wiley, New York,
NY,
1948.
Evans,
U.
R., Corrosion Protection and Passivity, E. Arnold, London,
England, 1946.
Avery, H.
S.,
Surface Protection Against Wear and Corrosion, American
Society for Metals, 1954, Chapter
3.
Larsen, R. G., and Perry, G.
L.,
Mechanical Wear, American Society for
Metals, 1950, Chapter
5.
Godfrey,
D.,
NACA Technical Note No. 2039, 1950.
Wright, K. H., Proc. Inst. Mech. Engrs, London,
lB,
1952, p. 556.
Row,
C.
N.,
“Wear
-
Corrosion and Erosion, Interdisciplinary Approach
to
Liquid Lubricant Technology,” NASA,
SP-3
18,
1973.
Almen,
J.
O.,
“Lubricants and False Brinelling
of
Ball and Roller Bearings,”
Mech. Eng., 1937,
Vol.
59, pp. 415422.
Temlinson, G. A., Thorpe,
P.
L.,
and Gough,
J.
H.,
“An Investigation of
Fretting Corrosion of Closely Fitting Surfaces,” Proc. Inst. Mech. Engrs,
Campbell, W. E., “The Current Status of Fretting Corrosion,” ASTM
Technical Publication,
No.
144,
June 1952.
Uhlig, H. H., “Mechanism of Fretting Corrosion,” J. Appl. Mech., 1954,
Vol.
21(4), p. 401.
Waterhouse, R. B., “Fretting Corrosion,” Inst. Mech. Engrs, 1955,
Vol.
Kennedy,
N.
G., “Fatigue of Curved Surfaces in Contact Under Repeated Load
Cycles,” Proc. Int. Conf.
on
Fatigue of metals, 1956, Inst. Mech. Engrs, Sept.
Oding,
I.
A., and Ivanova,
V.
S.,
Fatigue of Metals Under Contact Friction,”
Proc. of Int. Conf. on Fatigue
of
Metals, Inst. Mech. Engrs, 1956, pp. 408413.
Poulter,
T.
C., “Mechanism of Cavitation-Erosion,”
J.
Appl. Mech., March
1942.
1939,
Vol.
141, pp. 223-249.
169(59), pp. 1157-1 172.
1956, pp. 282-289.
338
Chapter
8
35.
Nowotny,
H.,
“Destruction
of
Materials by Cavitation,” V.D.I., May
2,
1942,
Vol.
86,
pp.
269-283.
36.
Mousson, J. M., “Pitting Resistance
of
Metals Under Cavitation Conditions,”
Trans.
ASME,
July
1937.
37.
Bowden, F.
P.,
and Brunton,
J.
H.,
“The Deformation of Solids by Liquid
Impact at Supersonic Speeds,” Proc. Roy. Soc.,
1961,
Vol.
A263,
p.
433.
38.
Bowden, F. P., and Field, J.
E.,
“The Brittle Fracture of Solids by Liquid
Impact, by Solid Impact, and by Shock,” Proc. Roy.
Soc.,
1964,
Vol.
A282,
p.
331.
39.
Kallas, D.
H.,
and Lichtman,
J.
Z.,
“Cavitation Erosion,,’ Vol.
1
of
Environmental Effects on Polymeric Materials, Chapter
2,
Wiley-Interscience,
New York,
NY,
1968.
40.
Plesset, M.
S.,
“On Cathodic Protection
in
Cavitation Damage,** J. Basic Eng.,
1960,
Vol.
82,
p.
808.
Case Illustrations
of
Surface Damage
9.1
SURFACE FAILURE
IN
GEARS
The factors influencing gear surface failures are numerous, and in many
cases their interrelationships are not completely defined. However,
it
can
be easily concluded that the gear materials, surface characteristics, and the
properties of the lubricant layer are to
a
great extent responsible for the
durability of the surfaces.
It is widely accepted that pitting is a fatigue phenomenon causing cracks
to develop at or below the surface. It is also known that lubrication is
necessary for the formation of pits [l]. The dependence of pitting on the
ratio of total surface roughness to the oil film thickness is suggested by
Dawson
E2-41.
Wear has been explained as a destruction of the material resulting from
repeated disturbances of the frictional bonds
[5].
Reduction or prevention or
wear may be accomplished by maintaining a lubricant film thickness above a
certain critical thickness
[6].
Recent work in elastohydrodynamic lubrication
[7-191 makes it possible to predict the thickness of the lubricant layer and
the pressure distribution within the layer. Scoring is believed to be a burning
or
tearing of the surfaces. This tearing is caused by metal-to-metal contact at
high speed when the lubricant film fails and cannot support the transmitted
load. The failure of the lubricant film has been attributed to a “critical
temperature”
of
the lubricant [20]. Experimental evidence shows that the
lubricant failure for any particular lubricant-material combination occurs at
a constant critical temperature [21, 221.
339
340
Chapter
9
9.1.1
Surface damage in gear systems is influenced by the following variables: load
intensity, geometry of the contacting bodies, physical properties of the sur-
faces, rolling and sliding velocities, properties
of
the lubricant, presence of
abrasive or corrosive substances, existence
of
surface layers and their che-
mical composition, surface finish, and surface temperature. According to the
elastohydrodynamic theory
[7-191,
most of these variables also govern the
thickness
of
the lubricant film, which suggests that the major role is played
by the lubricant layer in the control of surface damage.
The first step in structuring a design system
is
to identify the significant
parameters affecting the design. The fundamental parameters for the pro-
blem under consideration will be taken as:
The Significant Parameters for Surface Damage
Load intensity
W,
normal to the surface;
Oil inlet temperature
To;
Lubricant viscosity at
To
(PO);
Effective modulus
of
elasticity of teeth
E‘
=
l/[(l/E,)
+
(l/E2)];
Effective radius of curvature at contact
R’
=
l/[(l/Rl)
+
(1/R2)];
Rolling and sliding velocity
of
teeth in contact
U,
V;
Surface finish
S;
Pressure coefficient of viscosity of the lubricant
a;
Pressure-temperature coefficient of viscosity
y;
Thermal properties
of
the tribological system.
There are certain groups of these parameters, which are believed to collec-
tively affect surface damage. The most important of these groups are the
Hertzian contact stress, the lubricant film thickness, and the maximum
localized temperature rise in the film. Simplified expressions, which can be
used for these groups are:
Maximum Hertzian stress:
Maximum temperature rise:
AT
2
(0.0036)
(,<!
-
s)
W3/4Nj12
(9.2)
Minimum thickness
of
lubricant film:
h
=
(2.5
x
IO-’)R’(B
x
106)”
Case Illustrations
of
Surface Damage
where
34
I
(9.3)
and
c
=
1.1
for
B
5
IO-~
for
B
2
10-6
=
0.64
Although there is no uniformity of opinion
on
the nature of the role played
by
the Hertzian-type stress field in surface damage, there is general agree-
ment between investigators that the maximum Hertzian stress is a significant
parameter, whose value should be kept within certain bounds if damage to
the surface is to be avoided. The pressure distribution in the oil film between
lubricated rollers is also believed to conform closely to the Hertzian stress
distribution. The derivation of the equation for calculating the maximum
Hertzian stress, Eq.
(9.1),
can be found in many texts. The explanation for
Eqs.
(9.2)
and
(9.3)
is given in the following.
It
should be noted that the
above expressions are intentionally simplified to facilitate the illustration
of
the design procedure. Among the important factors neglected in these equa-
tion are the load distribution across the contact, the errors and the elastic
deflection of the teeth, and the effect of the variation of the coefficient of
friction on the maximum temperature
rise.
9.1.2
Maximum
Oil
Film Temperature
The temperature rise in the oil film
is
calculated according to AGMA guide
for Aerospace Spur and Helical Gears
where
[23].
This gives:
W
W,
=
tangential load per unit length of contact
=
-
cos
4
Np
=
pinion (rpm)
S
=
surface finish
(rms,
pin.)
4
=
pressure angle
p,,
=
radius of curvature for pinion tooth
pG
=
radius of curvature for gear tooth
mG
=
gear ratio
342
Chapter
9
Analysis of many examples
of
typical gears showed that the factor:
is approximately equal to
0.0036.
Therefore, for convenience, the maximum
temperature rise in the
oil
film can be calculated from
Eq.
(9.2).
9.1.3
Minimum
Oil
Film Thickness
The analytical, as well as the experimental results on film thickness reported
by many investigators
[7,
11-14, 16, 181 are plotted in Fig. 9.1 versus the
dimensionless parameter:
R'
E'R'
Because the oil inlet temperature is conveniently considered as the gear
blank temperature and because of the many unknowns in applying a general
equation to calculate the minimum film thickness between gear teeth, a
conservative design curve can be selected (shown in Fig. 9.1 by the lines
k)
which represents a safe lower limit. Since the equation is too con-
servative, especially for relatively thin films, the following alternative equa-
tion suggested by Dowson and Higginson [lO] may be used:
h
=
5
x
10-6(poR'U)'/2
(in.)
where
po
=
oil
viscosity at the
oil
temperature (poises)
Some design graphs are given in this section to illustrate the influence of the
design and operating parameters on the performance
of
conventional gears
with involute tooth profiles. These graphs can be useful in the initial selec-
tion of the main design variables, as well as in gaining qualitative under-
standing
of
the effect of the operating variables on the surface durability and
the dynamic behavior of cylindrical gears in mesh.
Case Illustrations
of
Surface Damage
343
104
k
10"
\
r
a-b-c
Oerign
Curve
0
Ref.
7
lrothermal
U
Ref.
7
Thermal
v
Ref.13Thermal
X
Experimental
Ref.
18,19
Ref. 11
lrothermal
-
Ref.
12
Isothermal
_
1
OS
,
1
.
I
1
0-'
1
0"
1
o=
Figure
9.1
Selection
of
design
curve
for
minimum film thickness.
9.1.4
Maximum Allowable
Oil
Sink
Temperature for Wear Avoidance
The nomogram given in Fig.
9.2
can be useful in understanding the inter-
action between the surface roughness and the lubricating oil for wear avoid-
ance in a particular gear pair. Notice the absence of load in the nomogram,
as it has little influence on the wear when an adequate lubrication film is
achieved. The graph is based on
a
simplified elastohydrodynamic lubrication
analysis where the speed
of
the gear (the shower element), the shaft center
distance, the tooth surface roughness, and the type of oil determine the
maximum allowable sink temperature necessary for preventing metal-to-
metal contact. The higher the temperature above the allowable sink tem-
perature, the higher the wear rate and the more influence the transmitted
load has on it. The nomogram can also guide the selection of an appropriate
oil cooling system when necessary.
344
Chapter
9
MAXIMUM ALLOWABLE
200
SINK
TEMPERATURE
4oo
1200
-
f
1400-
1600-
v)
1800-
W
a
5
2000-
w
(3
2200
-
2400
-
2600
-
2800
-
3000
Figure
9.2
Design chart
for
gear lubrication.
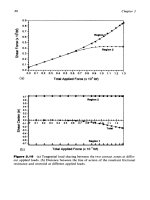
9.1.5
Most gear rating and design practices for surface durability are based on the
concept
of
contact fatigue resulting from the Hertzian stress field. This type
of
approach clearly ignores the effect of lubrication, surface roughness, and
Lubrication Factor for Surface Durability
Case Illustrations of Surface Damage
345
the relative sliding between the teeth. Figure
9.3
gives dimensionless rela-
tionships that can be used to quantify the reduction in useful life due to wear
and pitting which can occur due
to
inadequate lubrication. The life is nor-
malized with respect to the ideal case of full film lubrication without asperity
contacts. This is plotted as a function of the ratio of the elastohydrodynamic
film thickness,
ho,
to the surface roughness,
S
[24].
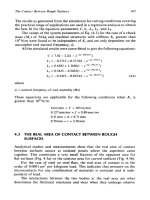
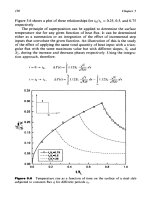
9.1.6
Dimensionless Maximum Instantaneous Temperature Rise on the
Tooth Surface
Figure
9.4
gives a dimensionless plot for the temperature rise at the starting
point of contact as
a
function
of
the number
of
teeth,
N,,,
in the pinion and
the gear ratio,
mc
[25].
The graphs are for standard teeth with
20"
pressure
angle, where:
1
0.1
0.01
1
E-3
0.01
0.1
1
h=ho/S
10
Figure
9.3
Life ratio for minimum wear with equal load.
346
Chapter
9
AT*
AV,
__ _ _-
14
10
22
26
30
34
30
NP
Figure
9.4
Temperature rise at the starting point
of
contact
(@
=
20").
ATP
=
maximum temperature on pinion dedendum at first point of contact
6TG
=
maximum temperature on gear tip at first point of contact
Aq
=
Blok
flash temperature which is based in equality
of
ATp
and
ATG
Cd
=
shaft center distance
op
=
angular velocity of the pinion
f
=
coefficient
of
friction
E,
=
effective modulus of elasticity of gear materials
w,
=
tangential load per unit length of contact
p,
k,
c
=
density, conductivity, and specific heat for the gear materials
and
Case Illustrations
of
Surface Damage
347
9.1.7
Qualitative Comparison Between the Nominal Hertz Contact
Stress and the Nominal Instantaneous Stress due
to
Thermal Shock
Here, a set of figures illustrate the conditions where thermal shock due to the
transient temperature rise on the surface and subsequent cooling in mixed
lubrication becomes significant when compared to the Hertz contact stress
[26].
Figures
9.5-9.8
show that surface stress resulting from thermal shock
should be given serious consideration for small number of teeth and high
pitch line velocity. The figures also show that using the stub teeth or tip
relief can considerably reduce the influence of thermal shock. The following
parameters are considered in the illustrative example:
Center distance, CD
=
loin. and 60in.
Gear ratio, GR
=
5
Pressure angle
=
20"
Coefficient of friction
=
0.05
Pinion speed
=
1800
rpm
500000
400000
300000
=
cn
P
v)
cn
Q)
W
5
200000
100000
0
C.D.
=
10
in.
N,=16
Standard
tooth
7
0
Nominal
contact
stress
I
0
1
000
2000 3000
Load
(I
bWin)
Figure
9.5
Nominal thermal and contact stress for standard gear teeth.
348
Chapter
9
C.D.
=
60
in.
Standard
tooth
400000
-
300000
-
n
v)
P
v)
v)
a
Y
3
200000
-
100000
-
0
Nominal
thermal
stress
0
Nominal
contact
stress
0
0
1
000
2000 3000
Load
(I
bflin)
Figure
9.6
Nominal thermal and contact stress for standard gear teeth.
9.1.8
Depth
of
Stressed Zone Below the Tooth Surface
It
is well known that the depth of pits increases with the increase in load and
size of the gear and decreases with speed. This cannot be explained by
Hertzian stresses alone and may be attributed to the influence
of
the tran-
sient thermal stresses generated at the mesh. Figures
9.9
and
9.10
give
a
comparative parametric representation of the depth
of
the zone below the
surface where significant stresses occur due to the Hertzian contact and the
transient heat generation respectively.
9.1.9
Dedendum Wear
of
Gears
Pitting and wear of gears usually occur in the dedendum region where
“negative sliding” takes place. The latter term characterizes the fact that
the dedendum is always the slowest element of the sliding surfaces. This
Case Illustrations
of
Surface Damage
C.D.
=
10
in.
-
Stub tooth
349
0
Nominal
thermal
stress
0
500
1000
1500
2000
2500
3000
Load
(I
bf/in)
Figure
9.7
Nominal thermal and contact stress
for
stub gear teeth.
condition results in higher temperature rise in the dedendum region and
consequently higher thermal stresses or thermal shock. The tooth surface
in the dedendum region
is
inherently subjected to cyclic tensile stress due to
bending. These two factors to one degree or another can play an important
role in initiating and propagating the surface cracks to form wear debris or
pits depending on the state
of
the stress, the microhardness, the metalurgical
structure, and the existence
of
defects of inclusions in the surface region.
9.2
ROLLING ELEMENT BEARINGS
Rolling element bearings represents some of the most critical components in
rotating machinery. Because of the ever-increasing demands on higher relia-
bility and longer life, these bearings are continuously subjected to extensive
350
500000
400000
300000
z
cn
P
U)
cn
0)
to
W
3
200000
100000
0
L
Chapter
9
Np=13
C.D.
=
60
in.
.
Stub
tooth
0
500
1000
1500
2000
2500
3000
Load
(Ibflin)
Figure
9.8
Nominal thermal and contact stress for stub gear teeth.
studies with a view towards improving their design, manufacturing, materi-
als, and lubrication.
As
in the case of gears, surface damage is the most
important factor controlling their useful life.
The desired requisites for steel used for rolling element bearings are:
High fatigue strength
High elastic strength
-
resistance to plastic indentation
Resistance
to
sliding or rubbing wear
Structural stability at operating temperatures
A
low level of nonmetallic inclusions and alloy or carbide segregation
Relative insensitivity to internal and external stress concentration
Resistance to environmental chemical corrosion
which serve as internal stress concentrating factors
Case Illustrations
of
Surface Damage
351
Figure
9.9
Nominal size
of
the
stressed
zones below the surface.
Rolling element bearing performance is strongly dependent upon the degree
of separation of the rolling elements and raceways by means of a lubricant
film. The ratio of the minimum film thickness under operating conditions
should be greater than
1.4,
otherwise any skidding which may occur inside
the bearing
will
cause rapid deterioration of its useful life.
9.2.1
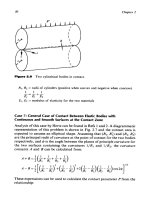
Contact Stress Calculations
The three types of contacts in rolling element bearings are illustrated in Fig.
9.1
1.
They represent circular, elliptical, and rectangular contacts respec-
tively. The stress distribution in the contact zone can be calculated accord-
352
0.25
0.2
.c
0
5
0.15
w
0
<
U)
6
s
c,
0.1
8
0
0.05
OO
Chapter
9
V
=
100
ft/min
7T-l
C.D.
=
60'
0
di
(thermal
zone)
G.R.
=
5
o
b
(Hertzian)
/I
I)
=
20"
1000
2000
3000
Normal
load
(Iblin.1
Figure
9.10
Nominal size of the stressed zones below the surface.
ing to the Hertz theory discussed in Chapter
2.
The maximum compressive
stresses for the three conditions are given
by:
3p0
40
=
-
2na2
where
PO
is the total transmitted load. The values
of
a
and
b
are determined
by the radii
of
curvature
of
the contacting bodies, as given in Chapter
2.
Case Illustrations
of
Surface Damage
353
A
B
C
Figure
9.1
1
Schematic representation
of
different types
of
rolling contacts.
9.2.2
Bearing Surface Fatigue Life
Rolling fatigue is a case of fatigue under combined stress where the material
in the contact zone is subjected
to
reversed subsurface shear stress under
high triaxial compressive stress
127-301.
Accordingly,
it
is not surprising that
hardened steel can sustain much higher reversed shear stresses
in
rolling
contact than in other loading conditions.
The statistical nature of bearing contact fatigue is evident in the scatter
of the life obtained for identical bearings tested under ideal conditions
[31-
351.
It is not unusual for the longest life in a group of
100
identical bearings
to be
50
times the life of the first bearing to fail. The probability of failure in
most bearing tests generally follows
a
Weibull distribution. Consequently,
the life for any desired probability of failure can be estimated with a con-
fidence level based on
50%
failure tests. The statistical nature of life can be
attributed to the fact that most fatigue spalls has been clearly associated
with nonmetalltic inclusions. Residual stresses can also influence the scatter
in bearing life.
The general equation used for estimating bearing life is:
354
Chapter
9
where
L,,
L2
=
life at load levels
1,
2
ql,
q2
=
the
corresponding maximum compressive
stress
on
the
surface
(PO)!,
=
applied loads on
the
bearing
Important factors which influence the life of bearings are the operating
temperature and the choice of clearance and lubricant
[34, 36, 371.
9.2.3
Failure
of
Lightly Loaded Bearings
It is not uncommon for early failures to occur in bearings which are loaded
far below their rated load, because they are selected based on size rather
than load. The rolling elements under such conditions usually undergo slid-
ing or skidding action against the race or the retainer. Excessive wear,
spalling, or scoring can result which significantly reduce the useful life or
lead to premature failure. One such failure is the development of surface
thermal cracks in retainers made of steel or aluminum, which propagate into
fracture and consequently cause catastrophic failure of the bearing. It is
interesting to note that this type
of
failure does not occur when the retainers
are made of bronze. Prevention
of
skidding under such conditions can be
achieved by the appropriate choice of clearance for the purpose of creating
an induced load
to
force a rolling action. Another approach is to use prop-
erly designed hollow rolling elements as illustrated by the experimental
study discussed in the following section.
9.2.4
An Experimental Investigation
of
Cylindrical Roller Bearings
Having Annual Rollers
Hollow roller bearings have long been used for heavy duty applications such
as the work rollers of
a
rolling mill. In such cases, the main purpose of using
hollow rollers is to install as many rollers as possible within a limited cir-
cumferential space in order to increase the bearing capacity
[38].
Annual roller bearings are expected to minimize skidding under low
loads and would be useful in marginally lubricated applications where
wear can be a problem. They may also improve load distribution between
rollers and better thermal characteristics. The expected result would be
lower temperature rise, reduced bearing wear, and longer life.
Besides the benefits of reduced skidding between the cage and roller set,
an additional benefit occurs when considering the theoretical fatigue life
of
high speed, radial roller bearings. As outlined by Jones
[39],
the centrifugal