Friction and Lubrication in Mechanical Design Episode 2 Part 7 ppsx
Bạn đang xem bản rút gọn của tài liệu. Xem và tải ngay bản đầy đủ của tài liệu tại đây (1.28 MB, 25 trang )
380
Chapter
9
remain near normal. The configuration of the joint is shown on Fig.
9.22A.
A
schematic diagram
is
given in Fig.
9.22B
to show the animal’s leg in
place with the static load and cyclic rubbing motion identified.
A
special
fixture is designed for applying constant compressive loads to the joint Fig.
9.23.
It
has a spring-actuated clamp which can be adjusted to apply static
(crest
09
,
Constant Compressive
Force (static)
-+/
Clamp
Figure
9.22
Schematic representation
of
applied load and rubbing motion.
Case
Illustrations
of Surface Damage
381
Figure
9.23
load.
Constraining rig showing the fixture for application
of
compressive
loads between 450g and
3.6kg.
The spring is calibrated for continuous
monitoring
of
the normal load which is applied to the rat joint through a
soft rubber pad.
Test
Specimens
The test specimens were all male white albino rats. Their weight varies from
300
to
350g.
The rats were maintained on mouse breeder blox and water.
The room temperature was kept between
80
and
84°F.
Nine rats were tested
in this study with each three specimens subjected to identical load levels.
Test
Plan
The right tibia of each rat was subjected to an alternating pull force between
0.0
and
90
g
at a rate of 1500 cycles/min. All the tests were conducted at this
value of the cyclic load with the compressive normal load fixed at
0.45,
0.9,
and
1.8
kg,
respectively. The duration
of
the testing was
2-3
hr every day for
a period of
14 days. After that period the rats were sacrificed and the
382
Chapter 9
different tests were performed on the joint. Only the temperature data were
obtained while the rats were tested.
9.6.2
Temperature Measurements
The temperature over the skin of the rat at the patella joint is measured by
thermocouples. The combination used is iron and constantan and the tem-
perature can be continuously recorded with an accuracy of
fO.
1
OF.
A
typical variation of temperature on both the loaded and unloaded
joints is shown in Fig.
9.24.
The compressive load on the test joint is 1.8 kg
in this case. The temperature on the test joint increased considerably during
the first loading period. The temperature rise tended
to
stabilize after the first
week of test to an approximately
2S°F
above that
of
the joint at rest. The
latter showed no detectable change throughout the test. Progressively lower
temperature rise resulted in the tests with the smaller compressive forces.
These results are in general agreement with those obtained by Smith and
Kreith
[94]
using thermocouples on patients with acute gouty arthritis,
rheumatoid patients, as well as normal subjects during exercise and bed rest.
9.6.3
Measurement
of
Changes in Mineral Content
The mineral content of the bone and the cartilage can be determined
through the absorption by bone of monochromatic low-energy photon
901
I
I I
I
I
I
I
I
I
0
2
4
6
8
10 12 14 16 18
20
Hours
of
Loading
Figure
9.24
Sample
of
skin temperature data near the joints.
Case Illustrations
of
Surface Damage
383
beam which originates in a radioactive source (iodine 125 at 27.3 keV). The
technique has been developed by Cameron and Sorenson
[95].
The source and the detector system are rigidly coupled by mechanical
means and are driven simultaneously in 0.025in. steps in a direction trans-
verse to the bone by a milling head attachment. Measurements of the trans-
mitted photon beam through the bone are made for a 1Osec interval after
each stop and are automatically used to calculate the mineral content.
A
typical summary result is shown in Fig.
9.25
where the change in bone
mineral ratio between the test joint and the one at rest are plotted as mea-
sured at different locations below the surface.
In
this case, the rat joint was
subjected to a 1.8 kg compressive load for approximately three hours daily
for a period of 14 days. It can be seen from the figure that the tested joint
showed a significantly higher mineral content ratio at 0.025in. below the
surface which gradually reaches
1
at
a
distance of approx. 0.075in. below
the surface. Progressively smaller increases in the mineral content ratio
resulted from the lower compressive loads. This result is interesting in
view of the finding of Radin et al.
[88]
that increased calcification and
stiffening of the rabbit joints occurred as a result of repeated high impact
load. It shows that increased calcification can occur as well due to rubbing
of the joint under static compression.
2.0
1.5
0
K
c
Q)
z
=
1.0
s
Y
0.0
1
I I
0.05
0.10
0.15
0.20
Distance
From
Tibia Joint (in)
Figure
9.25
Change in mineral content ratio
below
the surface.
9.6.4
The
surfiicc
textiirt'
and
condition
of
the
loaded and
thc
intact
joints
fiv
each
rat
are
in\.cstigated
by
riie;ins
of'
the biologicd
microscope
for
gcncral
ubscrvaticm.
histological
slides
for
thc
ccllular
structiirc.
and
tho
scanning
clect
1-011
111
icrosco
pc
for
close
in\w
t
iga
tivn
of'
t
tic
load-
bexi
ng
ii
t-ciis.
At
tlic
end
of
cxii
test.
thc. rat
is
sacrificed. Thc
joint
is
thcn
dissectcd
and
put
in
fixative
so
that
the
cclIs
rctain
thcir
shapc.
Thc tixatii'c
iisccf
is
0.
I
'!,,:)
~liitra-aldc.~i~,de.
When
\.icnui
iindcr
ii
biologiciil microscopc
to
a
magnification
01.
25
40
x.
considerable
~e;tr
01'
tlic
smooth
siirtiict's
cm
bc
observed
in
thc
loaded
joint
;is
sticnm
in
Fig
0.16
for
;i
static
compt-cssive
Investigation
of
Surface Characteristics
and
Cellular
Structure
load
of
1.8
kg.
The slides of the histology studies are prepared
at
four different sections
of the joint in both the tested and imniobilized joints. The cellular structure
is compared as shown in Fig. 9.27 for
a
conipressive load
of 1.8
kg and the
following differences are observed:
1.
2.
The surface is significantly rougher in the loaded joint
as
com-
pared
to
the one at rest.
The surfiice structure is compressed
at
some locations causing an
increase in the mineral content. This observation is supported by
the results of
the
photon absorption technique.
The procedure used for the electron microscope study of the structure of the
cartilage is explained in detail by Redhler and Zimniy
[96].
The specimens
from the cartilage are fixed in
0.1
(XI
glutra-aldehyde
in
Ringers solution.
The fixation takes approximately
4
hr. They are then passed through graded
acetone. The concentration
of
the acetone is changed from
50,
70.
90.
and
100%
for
;I
duration of
0.5
hr each. This is done
to
ensure
that
no moisture
exists which
may
cause cracking when coated
with
gold and palladium
alloys. The magnification used is
1000
3OOOx
and the areas seen :ire pri-
marily load bearing ;ireas. The differences observed among the
loadcd,
Fig.
9.28.
and the intact. Fig. 9.29. joints can
be
sunimrized in the following:
1
.
In
the
loaded specimens. the zoning which predominates in
the
normiil cartilage disappears. The upper surface is eroded. and the
radial pattern predominates throughout. The relatively
open
mesh underneath the surfiice is replaced
by
;I
closely
piicked
Figure
9.27
rest.
Section
of’
rat
.joint
tcsted
(a)
under
;i
1.8
kg
comprcssive
load:
(b)
at
Figure
9.28
Electron
microscope.
rcsults
showing
(a)
surface
roughness
for
joint
sutjrctcd
to
0.0
kg
nc~rnial
load:
(h)
surl'xc
pits
for
joint
subjected
to
I
.8
kg
COTII-
prcxsi\y
loiid:
(L*I
surfiicc
tear
ror
joint
suh.iectod
to
0.9
kg
compressive
10x1.
network
of
thick
come
fibers,
all
radial
in direction
;is
shown
in
Fig.
9.2k.
The
typc
of
the
surfim
of
the intact cartilage.
Fig.
9.29.
suggests
ii
trapped
pool
incchanisin
of
lubrication.
The
surtiicc
is
very
smooth
without
serious
asperities.
The
tibers
in
the
intact citrtilage
are
oriented
in
a11
directions.
whcreas
in
the
loaded
cartilage
they
reorient theinseiiw
in
a
radial
form.
Fig.
9.2Ka.
This
is
known
to
he
comnion
in
old,
arthritic
joints
[97].
4.
Deud
culls
can
be
seen
under
some
of
the loud-bearing
areas.
Fig.
9.28.
Similar
obsc.ri.ittions
have
been
reported
by
McCall
[97].
5.
The
surface
rc)iighn~s~
of
the
louded
cartilage
is
drastically
increiist'd. This in turn
causes
further
deterioration
of
the
joint.
6.
Pits
and
tears
appear
in
the
loaded
citrtilaze
;IS
illustrated in
Figs
9.28b and c.
2.
3.
3s
7
Figure
9.29
Figs.
9.2h
and
c.
(a).
(h)
Electron
microscope
results
for
the
Joint
at
rest
for
thc
rats
of
9.7
HEAT
GENERATION
AND SURFACE DURABILITY
OF
RAMP-BALL
CLUTCHES
9.7.1
Introduction
This section deals
with
the ttierm~il-reIat~d
probleins
and surface duriibility
of
ramp
ball
clutches. which arc
gencrdly
used
for
one-directional
load
transmission and
ciin
be
iitilizcd
In
duvcloping mechanical function
genera-
tors.
Thc
surfiice tcnipcrature rise undcr fluctuating
load
conditions is
pru-
dictcd
by
using
a
simplified one-dimensional
t
ransitlnt
heat transfer
model
that is found
to
be
in
good
agreement
with
finite clement analysis. The depth
of
fretting
wear
due
to repeated high-freqtrenq operation
is
t.valu:ited from
the vicwpoint
of
frictional energy
density.
A
simplified
niodel
for
fretting
\year
due to fluctuation
of
Ioxi
without
gross
slip in the wedging condition
is
proposed
by
qualitatively
guiding
the
design
of
the
clutch.
388
Chapter
9
It is well known that during sliding contact, the frictional energy is
transformed to thermal energy, resulting in high surface temperature at
the contact [98, 991.
If
the high heat flux is periodic, the sharp thermal
gradient might cause severe damage such as thermal cracking and thermal
fatigue. High temperature can also cause change of the material properties
of
the surface layer, acceleration of oxidation, poor absorption of oil, and
material degradation. High temperature may also occur at the asperity
contacts due to cyclic microslip, such as in fretting corrosion [lOO-l04].
In a rampball clutch (refer to Fig.
930),
the heat generated during its
operation can be classified into two categories:
Overrunning mode.
Usually the outer race rotates at a high speed
with respect to the inner race during the overrunning mode. The
balls, under the influence of the energizing spring, will always
contact both races and consequently produce a sliding frictional
force. This condition is similar
to
the case of lightly loaded ball
bearing.
Wedging mode.
The rampball clutch utilized in mechanical func-
tion generators [105] can be ideally designed to operate on the
principle of wedge. During the wedging mode, the combination
of
high oscillating pressure and microslip at the contact due to
load fluctuation generates frictional heat on the surfaces of the
balls and both races and, consequently may cause fretting-type
damage. This investigation focuses on the tribological behavior
in the wedging mode only because of its importance to the func-
tion generator application.
1.
2.
9.7.2
Analysis
of
the Wedging Condition
Many studies have been conducted on the temperature rise on the asperities
during sliding and in fretting contacts
[
100-1041.
Due to the nature of the contact and variation of Hertzian contact
stress, the magnitude and the extent of the microslip area is a function of
time. However, because of the high stiffness
of
the clutch system, the windup
angle is very small; consequently the center
of
the contact area does not
move appreciably. In order to simplify the analysis, the following assump-
tions are made:
1.
2.
3.
The contact area is a Hertzian circle area.
The center of the contact area remains unchanged.
Frictional heat is equally partitioned between the contacting sur-
faces due to the existence
of
thin, chemical, surface layers with
low conductivity.
Figure
9.30
tact
with
wedging
condition
and
corresponding
hysteresis.
(U)
Schematic
of
B
ramp-ball
clutch.
(b)
Schematic
of
fretting
con-
4.
All
surfaces not in contact are adiabatic.
According
to
Mindlin's stick-slip
model
[
1061.
the contact area
of
sphere on
a
flat subjected
to
a tangential force
is
a mixed
stick-slip
circle.
The boundary between the
slip
and stick regime
is a circle with radius:
(9.26)
390
Chapter
9
where
F
is the oscillatory tangential force and
g
is the coefficient of friction.
The stick circle shrinks with increasing tangential force, until the force
reaches a critical value,
Fcr
=
Ng.
At that instant, gross slip starts to occur.
Within the contact area, the shear stress distribution is given by:
(9.27)
The amount of microslip
in
the slip annulus is found
[107]
as follows:
6(r)
=
3(2
16Ga
-
[
[
1
-
;
sin-'
(31
[
1
-
2(y]
+
$
$I-@},
(9.29)
The maximum microslip (when gross slip is impending) is obtained by set-
ting
c
=
0:
3(2
-
V)PN
S(r)
=
16Ga
(9.30)
where
v
=
Poisson's ratio
G=-
is
the
shear
modulus
2(1
+
v)
For the wedging contact of a ramproller clutch, the relation between the
normal load and tangential force at the upper interface can be expressed as:
Substituting
Eq.
(9.31)
into
Eq.
(9.26)
yields:
p(1
tans
+cosa)
r3
L(*-
(9.31)
(9.32)
Equation
(9.32)
shows that the ratio
of
the radius
of
the stick circle
to
that
of the contact area is constant. If the ramp angle is properly chosen, the
sphere will never slip, no matter how large the tangential force is.
Case
Illustrations
of
Surface
Damage
391
Because no surface is perfectly smooth, the contact occurs only at dis-
crete asperities and the real contact area is
so
small that it leads to extremely
high local stress and high temperature rise under sliding condition. The real
contact area is approximately proportional to the normal load under elastic
contact condition. According to the Greenwood-Williamson elastic micro-
contact model
[log],
the average real contact pressure can be an order of
magnitude higher than the nominal contact pressure. Accordingly, if the
normal load is concentrated on the real contact area, the resulting stress
and heat flux can be very high.
9.7.3
Frictional Energy and Average Heat
Flux
The frictional energy generated per unit time during fretting contact is the
product of the interface shear stress (surface traction) and the amount
of
microslip per unit time on each point within the slip annulus:
where
D
=
roller diameter
=
2R,
a(f)
=
0.881
E,
for
steel with
Poisson's
ratio
U
=
0.3 (9.34)
(9.35)
(9.36)
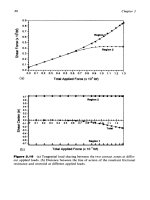
Equations
(9.36)
and
(9.37)
in the wedging condition are plotted in normal-
ized
form
as
shown in Figs
9.31
and
9.32,
respectively. The change of the
c
value with increasing ramp angle can
be
readily seen in Fig.
9.32.
For the impending gross slip conditon,
c
=
0,
Eq.
(9.32)
gives:
tan
a
p(1
+cosa)
=
'
(9.38)
1
s
E
$0.8
8
2
G
8
0.6
Y
8
U
G
w
8
0.4
Z
0.2
'0
0.41 49
-
~ ~
~~-
0.1
0.2
0.3
0.4
0.5
0.6
0.7
0.8
0.9
1
'h
AACC
1
0.8
3
I
0.6
IO.4
z
1
0.2
r
1
r
I
I
r
I
I
I
Ramp
an~lero.4149
Normalized
Distance
(da)
Figure
9.32
Normalized microslip distribution within the slip annulus as
a
func-
tion
of
the ramp angle.
Case Illustrations
of
Surface Damage
393
In this case, microslip occurs over the entire contact area and the corre-
sponding deflection can be expressed
as:
3(2
-
u)~N
1
6Gamax
6(r,
t)
=
(9.39)
Therefore, Eq.
(9.33)
can be rewritten as:
In Eq.
(9.40),
the double integral is the total tangential force,
pZV(t),
applied
on the ball. Therefore, the energy rate can be expressed as:
(9.41)
For the clutch, the normal force can be represented as a function of the
applied torque:
T(l)
1
+cosa
N(t)
=
n(b
+
l)R,
(z)
(9.42)
where
y1
is the number
of
balls;
b
is the ratio
of
the
radii
(Ri/Rr);
R,
and
R,
are the radii
of
an inner race and the balls, respectively.
Substituting Eq.
(9.38)
into
Eq.
(9.42)
yields:
(9.43)
If the applied torque can be expressed
as
the product of its magnitude
and a normalized continuous function
of
time
as
follows:
then, the frictional energy generated per unit time in the contact under
wedging conditions can be obtained by substituting
Eq.
(9.44)
into Eq.
(9.41):
(9.45)
394
Chapter
9
or
in normalized form:
We can also obtain the friction energy generated per cycle by integrating
Eq.
(9.45)
over one period,
T:
The average heat flux is found from:
'E
Q=-
74MX
where the radius
of
the maximum contact area is:
113
aman
=
1.1
I
(2+
2))
(9.48)
(9.49)
The average heat flux can be found by substituting
Eq.
(9.45)
and
(9.49)
into
Eq.
(9.48):
(9.50)
All
the equations derived above are based on the assumption of fretting
contact, that is, without
gross
slip.
For
the case of
gross
slip, the frictional
energy generated
per
unit time is:
.k
=
N(t)@ol&Ol
(9.51)
where
Ro
is the radius of an outer race and
&t)
is the angular velocity
of
the
outer race relative to the inner race. Accordingly, the average heat flux for
gross slip condition can be obtained by substituting
Eq.
(9.51)
into
Eq.
(9.48):
(9.52)
An illustrative example is considered by using the design parameters, listed
in Table
9.5,
for a steel clutch subjected
to
a 22.6N/m (2001bf-in.)
peak
torque.
Case Illustrations
of
Surface Damage
395
Table
9.5
Parameters Used
in
the Illustrations
Material
Hardness
Ramp angle
(a)
Radius ratio
(6)
Radius of the roller
(R,)
Young's modulus
(E)
Poisson's ratio
(U)
Coefficient
of
friction
(p)
Radius
of
the outer race
(Ro)
Thermal conductivity
(k)
Density
(p)
Specific density
(c)
4340
steel
352
BHN
0.4149
rad
4
3.8
mm
(0.15
in.)
2
x
10"
N/m2
(30
x
106
psi)
0.3
0.23
45
W/(m-OC)
(26
BTU/(hr-ft-OF))
7850
kg/m3 (490 lb/ft3)
(b
+
w,
0.42
kJ/(kg-"C)
(0.1
BTU/(lb-OF))
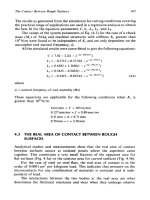
Assuming that the system is subjected to a periodic versed sine load:
To=22.6(
1
-
cos
2x9
)(N-m)
the corresponding average heat flux during the microslip condition is plotted
in Fig.
9.33.
9.7.4
Estimation
of
the Temperature Rise
One-Dimensional
Model
The temperature rise
of
a semi-infinite solid subjected to stationary uniform
heat supply over a circular area
was
first investigated by
Blok
[109].
In
the
same report,
Blok
also shows that if the same amount of heat flux has a
parabolic distribution the maximum temperature rise is
4/3
times as high as
the uniform distribution. Jaeger
[110]
also gives:
1.128Qfi
dz
AT(t)
=
(9.53)
where
Q
=
steady heat
flux
k
=
thermal conductivity
p
=
density
c
=
specific heat
396
Chapter
9
Torqi~ed2.6'(
1
-cos(!?pi'f"t))M
I
N-m
I I
I
I I
-2W'(l-~s(2'pi~f't))/2
lb-in
Frea=lSOHz
5-
4-
-
(v
E
g3
-
3
c
Is
I"
2-
1-
0-
0.3
0.25
'T
3
5
0.15
9
0.2
!E
2
c
I
0.1
0.05
0
0
0.1
0.2
0.3
0.4
0.5 0.6
0.7
0.8
0.9
1
Normalized
Time
Figure
9.33
to
versed sine load. (Time normalized
to
the period
T
of
the torque cycle.)
The average heat
flux
generated during the microslip condition due
The temperature rise of a ramp-ball clutch subjected to a versed sine load
can therefore be calculated by integrating
Eq.
(9.53)
after substituting
Eq.
(9.50)
as shown in Fig.
9.34
and
9.35.
From Fig.
9.34,
we can observe the
effect of cooling due to heat convection to the surrounding lubricant as the
contact area is reduced by microslip. This cooling effect causes the tempera-
ture rise
to
approach an asymptotic limit. The thickness of the lines in Fig.
9.35
represents the range of temperature fluctuation due to cooling.
Due to the extensive computation necessary over long periods, extra-
polation is undertaken
by
curve fitting of the results from a limited number
of cycles. The temperature rise within a limited time can be approximately
predicted by the following form:
AT(t)
=
/I&
(9.54)
where constant
B
can be obtained
by
curve-fitting the envelope of the results
given in Fig.
9.34.
The curves in Fig.
9.35
show the extrapolated results.
Case Illustrations
of
Surface Damage
397
Time
Figure
9.34
Temperature rise of
a rampball
clutch using one-dimensional
method under fretting contact condition
(two
cycles). (Time normalized to the period
of torque cycle.)
Finite Element
Analysis
The finite element method, based on
ANSYS
code, is used to verify the
accuracy of the result from the one-dimensional theory. Being axisymmetric,
a sphere can be modeled
by
using
a
90"
segment, with 10-point thermal
element
(SOLID87).
Instead of the average heat flux derived in the previous section, multiple
heat flux is used in the analysis for better results. The maximum contact area
is divided into four rings, as shown in
Fig. 9.36,
and each has
a
key point.
The heat flux history at each key point represents the local average heat flux
on corresponding annulus. Convective cooling is taken into consideration
outside the contact region in the finite element analysis in order to simulate
the effect of the lubricant.
The heat
flux
history of each key point can be found in differentia1 form:
(9.55a)
Q(r,
t)
=
0,
r
_<
c
or
rla
(9.55b)
of
Surface Damage
399
7-
0.4
where
r
=
al, a2, a3, a4
(referring to Fig.
9.36),
and
t
and
6
are described by
Eqs
(9.36)
and
(9.37),
respectively.
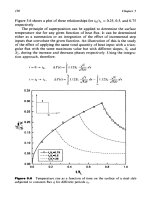
Figure
9.37
shows a typical heat flux history at every key point for one
cycle for the microslip condition. The input load is a versed sine load as
considered before.
Transient analysis is used throughout the finite element calculations.
The insulated surface and symmetric surfaces are, by definition, adiabatic,
therefore no other boundary conditions are necessary. Figures
9.38
and
9.39
show the solutions at
a1
(the central region of the contact) for load fre-
quency of
50
and
100
Hz,
respectively. By comparing the results with those
from the one-dimensional theory, the difference
is
found to be relatively
small in the first two cycles. However, a stronger cooling effect results for
longer load duration in the finite element method due to convection to the
lubricant.
I
I
r
I
I
I
I
I
I
Torque=22.6*(1 -cos(2'pi'Pt))/2
N-m
=200'(
1
-cos(2'pi'f9))/2
Ib-in
-
f=100
HZ
Figure
9.37
The heat flux at four key points under the fretting contact condition
(versed time pulse). (Time normalized to
a
period of the torque cycle.)
400
Chapter
r
11
I
I
I
I
I
I
I I
I
I
0.5
Li
g
0.4
f
0.3
3
E
L
k0.2
0.1
9
-
-
-
-
-
1-
$0.8-
E
0.6
J
at!
g0.4-
E
ug
8
0.2
Oh
h
s0.8
-
?
8
-
f
E
'C
-
8?
Time
(sec)
Figure
9.38
Temperature rise
of
a
rampball clutch using finite element method
(versed sine pulse,
50Hz).
9.7.5
Wear Depth Prediction
Due to the complex nature
of
the wear behavior in this case, a precise
prediction
of
the amount
of
wear is by no means an easy task. The great
majority
of
published wear equations apply
to
fixed sliding conditions,
usually without any measurement
of
temperature or energy produced
[
1
1
11.
The situation for fretting wear is even more ambiguous, because
no
single equation is available. Most of the investigations dealing with fretting
wear are case-study-type experiments under specific conditions. Kayaba and
Iwabuchi
[
1
121 report that fretting wear decreases with increasing tempera-
ture up to 300°C
(570"F),
and the trapped debris is Fe304, which has a
lubricating effect. Fretting wear at high temperatures has been receiving
particular attention
[
1
13-1 161. However, the results are inconsistent because
of
different materials, experimental conditions, and estimates of wear. The
influence
of
hardness and slip amplitude on the fretting wear are investi-
"0
0.001
0.002
0.003
0.004
0.005
0.006 0.007
0.008
0.009
0.01
Time
(sec)
Figure
9.39
Temperature rise
of a
rampball clutch using finite element method
(versed sine pulse,
100
Hz)
Case Illustrations
of
Surface Damage
40
I
gated by Kayaba and Iwabuchi [117]. It is also reported
[
1
181 that the wear
rate and the form of fretting damage depend on the chemical nature of the
environment and on whether the debris, mostly oxide, can escape. If the
ddbris, oxide or chemical compound, is trapped and acts as a buffer or
lubricant, then the wear rate may slow down considerably when the tem-
perature builds up to 200°C
(400°F)
[112].
The concept of frictional energy has been used to deal with adhesive and
abrasive wear in some models, including the Archard’s equation, in which
the debris is assumed to be hemispherical in shape. Rabinowicz
[
1191 con-
cludes that the ratio of frictional energy to material hardness is an important
factor in wear and may have some effect on debris size. Although the
hypothesis of hemispherical debris is questionable, the concept of energy
needed to generate debris makes the Archard’s model [120] a viable
approach for predicting wear depth.
Seireg and Hsue [121] indicate that the wear depth is dependent on the
temperature rise and the heat input at the contacting surfaces. Suzuki and
Seireg [I221 also provide evidence for the correlation between wear and
energy input. Due to the nature of fretting contact, the frictional energy
can be accumulated within a limited area with minimum convection to the
surroundings. Therefore, the energy accumulation can be used as
a
potential
tool to predict
Archard’s
respectively:
and
the fretting wear depth.
and Rabinowicz’s equations can be rewritten as follows,
v=
(?)(E)
=
(E)($)
(9.56)
(9.57)
In Eqs
(9.56)
and
(9.57),
Q
=
FpL/A
denotes the frictional energy density.
The yield strength,
S,
is about 1/3 of its Vickers hardness,
HI,.
Therefore,
from the energy standpoint, both abrasive and adhesive wear depth share a
common expression as follows:
Q
ha-
Ht,
In the case of a clutch switching between
the debris is not completely trapped as in
(9.58)
engagement and disengagement,
the conventional fretting case of
402
Chapter
9
fastened or press-fitted assemblies. Accordingly, this fretting process can be
assumed to be of the same type expressed in
Eq.
(9.58).
In order to quantify the relation between accumulated energy and fret-
ting wear depth, the work by Sat0 [123, 1241 has been adapted. In his series
of experiments, carried out on a glass plate in contact with a steel ball of
5
mm (0.2 in.) diameter, Sat0 obtains good agreement with other researchers
and suggests that the coefficient of friction increases steadily up to
0.5
as the
microslip annulus grows. After gross slip, amplitude
=
3 pm (1 20 pin.) at
9.8
N
(2.2 lbf) normal load, the coefficient of friction remains unchanged
and is considered
to
be
the sliding coefficient
of
friction.
Figure
9.40
shows the wear depth after
50,000
cycles plotted against the
oscillation amplitude [124]. At small amplitudes, the amount of wear is
found to be negative, because the debris is unable to escape from the stick
area and accumulates and wedges up within the contact area. For the clutch
case, the debris is not easily trapped; therefore, only the data corresponding
to the slip region are considered.
Based on Sato’s experimental data, the frictional energy density can be
calculated by the following equation:
Q
=
35.4Npal
(9.59)
7.5
A
E
5.0
E
?3
c
L
2.5
%
Ic
0
U
t
03
0.0
a
E
-2.5
Figure
9.40
Wear depth after
5000
fretting
cycles
(steel on
glass).
(From
Ref.
124.)
Case Illustrations
of
Surface Damage
403
where
Q
=
frictional energy density
N
=
normal load
p
=
coefficient of friction
a
=
amplitude (center-to-peak)
1
=
total number of cycles
The relation between wear depth and the energy input can then be obtained
by curve fitting.
A
linear fuction relating frictional energy density and
Vickers hardness
is
found as:
(9.60)
Q
h
=
0.147
-
H,,
where
h
=
fretting wear depth
H,
=
Vickers hardness
I
I
I
1
I
1
I
I
1
Torque=22.6‘(
1
-cos(2*pi’ft))/2
N-m
=200’(1 -ws(P*pi’ft))l2
Ib-in
0
0
0.1
0.2
0.3
0.4
0.5
0.6
0.7
0.8
0.9
1
Time
(sec)
Figure
9.41
Fretting wear prediction using
Eq.
(9.60).
404
Chapter
9
Equation
(9.60)
can be used for approximate prediction
of
the wear depth
of
a none-directional clutch. Considering the thermal loading conditions given
in Fig.
9.33
and using
Eq.
(9.60),
an illustrative example
of
the qualitative
prediction of clutch wear for different engagement frequencies is shown in
Fig.
9.41.
I.
2.
3.
4.
5.
6.
7.
8.
9.
10.
11.
12.
13.
14.
15.
16.
Way,
S.,
“Pitting Due to Rolling Contact,” ASME Trans., December 1934.
Dawson, P. H., “The Pitting of Lubricated Gear Teeth and Rollers,” Power
Transmiss., April-May 196 1.
Dawson, P. H., “Effect
of
Metallic Contact
on
the Pitting of Lubricated
Rolling Surfaces,” J. Mech. Eng. Sci., 1962,
vol.
4(1).
Dawson,
P.
H., “Contact Fatigue in Hard Steel Specimens with Point and Line
Contacts,” J. Mech. Eng. Sci., 1967, Vol. 9(1).
Kragelskii,
1.
V.,
Friction and Wear, Butterworths, 1965.
Feng, I-Ming, and Chang, C. M., “Critical Thickness of Surface Film in
Boundary Lubrication,” ASME
J.
Appl. Mech., September 1956, Vol. 23(3).
Cheng, H.
S.,
and Sternlicht, B., “A Numerical Solution for the Pressure,
Temperature and Film Thickness Between Two Infinitely Long, Lubricated
Rolling and Sliding Cylinders Under Heavy Loads,” ASME
J.
Basic Eng.,
September 1965, p. 695.
Dowson, D., and Higginson,
G.
R.,
“A Numerical Solution to the
Elastohydrodynamic Problem,” J. Mech. Eng. Sci., Vol. 6(
I),
p. 6.
Dowson, D., and Higginson,
G.
R.,
“The Effect of Material Properties on the
Lubrication
of
Elastic Rollers,”
J.
Mech. Eng. Sci., Vol.
2(3),
p.
188.
Dowson, D., and Higginson,
G.
R., Elastohydrodynamic Lubrication,
Pergamon Press, Oxford, 1966.
Archard,
G.
D., Gair, F. C., and Hirst, W., “The Elastohydrodynamic
Lubrication
of
Rollers,” Proc. Roy. Soc. (Lond.) 1961, Ser. A., Vol. 262, p. 51.
Dowson, D., and Whitaker, A.
V.,
“The Isothermal Lubrication of Cylinders,”
Trans. ASLE, 1965,
Vol.
8(3).
Cheng,
H.
S.,
“A Refined Solution to the
Thermal-Elastohydrodynamic
Lubrication of Rolling and Sliding Cylinders,” Trans. ASLE, October 1965,
Vol. 8(4).
Niemann,
G.,
and Gartner, F., “Distribution
of
Hydrodynamic Pressure on
Counterformal Line Contacts,” Trans. ASLE, July 1965,
Vol.
S(3).
Orcutt, F.
K.,
“Experimental Study
of
Elastohydrodynamic Lubrication,”
Trans. ASLE, October
1965,
Vol. 8(4).
Sibley, L.
B.,
and Orcott,
F.
K.,
“Elastohydrodynamic Lubrication of Rolling-
Contact Surfaces,” Trans. ASLE, 1962, Vol. 5, pp. 16&171.