Friction and Lubrication in Mechanical Design Episode 2 Part 8 ppsx
Bạn đang xem bản rút gọn của tài liệu. Xem và tải ngay bản đầy đủ của tài liệu tại đây (1.32 MB, 25 trang )
Case Illustrations
of
Surface Damage
405
17.
18.
19.
20.
21.
22.
23.
24.
25.
26.
27.
28.
29.
30.
31.
32.
33.
34.
35.
Kannel, J. W., Bell, J. C., and Allen, C. M., “Methods for Determining
Pressure Distributions in Lubricated Rolling Contact,” Trans. ASLE, 1965,
Vol. 8(3).
Crook, A. W., “The Lubrication of Rollers,” Phil. Trans. Roy. Soc. (Lond.),
1958, Ser. A, Vol. 250 (981), pp. 387-409.
Crook, A. W., “The Lubrication of Rollers,” Part
11,
Phil. Trans. Roy. Soc.
(Lond.), 1961, Ser. A, Vol. 254, p. 223.
Blok,
H.,
“The Flash Temperature Concept,” Wear, 1963, Vol. 6.
Kelley, B. W., and Leach, E.
F.,
“Temperature
-
The Key to Lubricant
Capacity,” Trans. ASLE, July 1965, Vol. 8(3).
Niemann, G., Rettig,
H.,
Lechner, “Scuffing Tests on Gear Oils in the
FZG
Apparatus,” ASLE Trans., 1961, Vol.
4,
pp. 71-86.
“Gear Scoring Design Guide for Aerospace Spur and Helical Power Gears,”
AGMA Information Sheet, 217.01, October 1965.
Seireg, A., and Conry, T., “Optimum Design of Gear Teeth for Surface
Durability,” Trans. ASLE, 1968, Vol.
1
1.
Taylor, T. C., and Seireg, A., “Optimum Design Algorithm for Gear Systems
Incorporating Surface Temperature,” ASME Trans., J. Mech, Transmiss.
Autom. Des., July 1985.
Dooner, D., and Seireg, A., The Kinetic Geometry of Gears: A Concurrent
Engineering Approach, Wiley Interscience, New York, NY, 1995.
Styri,
H.,
“Fatigue Strength of Ball Bearing Races and Heat Treated 52100
Steel Specimens,” Proc. ASTM, 1951, Vol. 51.
Fessler, H., and Ollerton, E., “Contact Stresses in Toroids Under Radial
Loads,’’ Br. J. Appl.
Phys.,
October, 1957, Vol.
8,
pp.
387-393.
Radzimovsky,
E.
I.,
“Stress Distribution and Strength Condition of Two
Rolling Cylinders Pressed Together,” Univ. Illinois Eng. Exper. Stat. Bull.
Ser. No. 408, Vol. 50(44), 1953.
Rowland, E.
S.,
“Resistance
of
Materials to Rolling Loads, an Engineering
Approach to Surface Damage,”
C.
Lipson, and L.
V.
Colwell (Eds), Univ. of
Michigan, 1958 Summer Conference on Wear of Metals.
Johnson, L. G., Ball Bearings Engineers Statistical Guide Book, New
Departure Division, General Motors Corporation, Bristol, Connecticut,
April, 1957.
Lieblein, J., and Zelen, M., “Statistical Investigation of the Fatigue Life of
Deep Groove Ball Bearings,”
J.
Res. Nat. Bur. Stand., November 1956, Vol.
57(5), Res. Pap. 2719, p. 273.
Macks, E. F., “The Fatigue
Spin
Rig
-
a New Apparatus for Rapidly
Evaluating Materials and Lubricants for Rolling Contact,” Lubr. Eng.,
October 1953, Vol. 9(5),
p.
254.
Butler, R.
H.,
and Carter,
T.
L., “Stress Life Relation of the Rolling Contact
Fatigue Spin Rig,” NACA Technical Note 3930, March 1957.
Butler, R.
H.,
Bear,
H.
R., and Carter, T. L., “Effect of Fiber Orientation on
Ball Failures Under Rolling Contact Conditions,” NACA Technical Note
3933, February 1957.
406
Chapter
9
36.
37.
38.
39.
40.
41
42.
43.
44.
45.
46.
47.
48.
49.
50.
51.
52.
53.
54.
55.
Carter,
T.
L., “Effect
of
Temperature
on
Rolling Contact Fatigue Life with
Liquid and Dry Powder Lubricants,” NACA Technical Note 4163, January
1958.
Barwell, F.
T.,
and Scott, D., “Effect
of
Lubricant on Pitting Failure
of
Ball
Bearings,” Engineering, July 6, 1956, p. 9.
Harris, T. A., “Optimizing the Design
of
Cluster Mill Rolling Bearings,”
ASLE Trans., April
1964,
Vol.
7,
pp. 127-132.
Jones, A. B., “The Dynamic Capacity of High Speed Roller Bearings,” MRC
Corp., Engineering Devel. Report
#7
(Circa 1947).
Harris, T. A., and Aaronson,
S.
F., “An Analytical Investigation
of
Cylindrical Roller Bearings having Annular Rollers, ASLE Trans., 1967,
Suzuki, A., and Seireg, A., “An Experimental Investigation
of
Cylindrical
Roller Bearings Having Annular Rollers,” ASME Trans., J. Lubr. Technol.,
October 1976, pp. 538-546.
Chichinadze, A. V., “Temperature Distribution in Disk Brakes,” Frict. Wear
Mach. (Translat. ASME), 1962, vol.
15,
pp. 259-275.
Fazekas,
G.
A.
G.,
“Temperature Gradients and Heat Stresses in Brake
Drums,” SAE Trans., 1953, Vol. 61, pp. 279-308.
Limpert, R., “Cooling Analysis
of
Disk Brake Rotors,” SAE Paper 750104.
Timoshenko,
S.
P., Strength of Material, Van Nostrand Company, Inc.,
Princeton, NJ, 1955.
Ashworth, R. J., El-Sherbiny, M., and Newcomb, T. P., “Temperature
Distributions and Thermal Distortions of Brake Drums,” Proc. Inst. Mech.
Engrs, 1977, Vol. 191, pp. 169-176.
Day, A. J., Harding, P. R. J., and Newcomb,
T.
P., “A Finite Element
Apporach to Drum Brake Analysis,” Proc. Inst. Mech. Engrs, 1979, Vol.
193, pp. 401406.
Evans, D. J., and Newcomb,
T.
P.,
“Temperatures Reached in Braking when
the Thermal Properties of Drum or Disk Vary with Temperature,” J. Mech.
Eng. Sci., 1961, Vol. 3(4), pp.
315-317.
Fensel, P. A., “An Axisymmetric Finite Element Analysis
of
Mechanical and
Thermal Stresses in Brake Drums,” SAE Paper 740321.
Johnson, M. R., Welch,
R.
E., and Yeung,
R.
S.,
“Analysis of Thermal
Stresses and Residual Stress Change in Railroad Wheels Caused by Severe
Drag Braking,” Trans. ASME, 1977, Ser. B, Vol. 99(1), pp. 18-23.
Ozisik, M. N., Heat Conduction, John Wiley
&
Sons, New York, NY, 1980.
Seireg, A. A., “A Method for Numerical Calculation of Stresses in Rotating
Disks with Variable Thickness,” University of Wisconsin Report, 1965.
Rainbolt,
J.
D.,
“Effect of Disk Material Selection on Disk Brake Rotor
Configuration,” SAE Paper 750733.
Rhee,
S.
K.,
and Byer, J.
E.,
“A Comparative Study by Vehicle Testing of
Copper Alloy and Gray Iron Brake Discs,” SAE Paper 720930.
Rhee,
S.
K.,
Rusnak, R. M., and Spurgeon, W. M., “A Comparative Study
of
Four Alloys for Automotive Brake Drums,” SAE Paper 690443.
Vol.
10,
pp. 235-242.
Case Illustrations
of
Surface Damage
407
56.
57.
58.
59.
60.
61.
62.
63.
64.
65.
66.
67.
68.
69.
70.
71.
72.
73.
74.
Monza, J. C., “Valeo Crown Brake,” SAE Paper 820027.
Kreith, F., and Bohn, M.
S.,
Principles of Heat Transfer, Harper
&
Row, New
York, NY, 1986.
Elbella, A. M., “Optimum Design of Axisymmetric Structures Subjected to
Thermal Loading,” Ph.D. Dissertation, University of Wisconsin-Madison,
August 1984.
Reigel, M.
S.,
Levy,
S.,
and Sliter, J. A., “A Computer Program for
Determining the Effect of Design Variation on Service Stresses in Railcar
Wheels,” Trans. ASME, November 1966, Ser.
B,
Vol. 88(4), pp. 352-362.
Timtner,
K.
H., “Calculation of Disk Brakes Components using the Finite
Element Method with Emphasis on Weight Reduction,” SAE Paper 790396.
Takeuti, Y., and Noda,
N.,
“Thermal Stress Problems in Industry 2: Transient
Thermal Stresses in a Disk Brake,” J. Therm. Stresses, 1979, Vol. 2, pp. 61-72.
Dike, G., “An Optimum Design of Disk Brake,” Trans. ASME, 1974, Ser. B,
Crow,
S.
C., “A Theory of Hydraulic Rock Cutting,’’ Int.
J.
Rock Mech.
Miner. Sci. Geomech. Abst., 1973, Vol. 10, pp. 567-584.
Crow,
S.
C., “Experiments in Hydraulic Rock Cutting,” Int. J. Rock Mech.
Miner. Sci. Geomech. Abst., 1975, Vol. 12, pp. 203-212.
Hashish, M., and duPlessis, M.
P.,
“Theoretical and Experimental
Investigation
of
Continuous Jet Penetration of Solid,” Trans. ASME,
J.
Eng. Indust., February 1978, Vol. 100, pp. 88-94.
Hashish, M., and duPlessis,
M.
P., “Prediction Equations Relating High
Velocity Jet Cutting Performance to Stand Off Distance and Multipasses,”
Trans. ASME, August 1979, Vol. 101, pp. 31 1-318.
Hood, M., Nordlund, R., and Thimons, E., “A Study of Rock Erosion Using
High-pressure Water Jets,” Int. J. Rock Mech. Sci. Miner. Geomech. Abst.,
Labus, T. J., “Material Excavation Using Rotating Water Jets,” Proc. 7th Int.
Sym. on Jet Cutting Tech., BHRA Fluid Engr., June 1984, Paper
No.
P3.
Rehbinder, G., “Some Aspects on the Mechanism of Erosion of Rock with a
High Speed Water Jet,” Proc. 3rd Int. Sym. on Jet Cutting Tech., BHRA Fluid
Engr., May 1976, Paper
No.
EI,
Chicago.
Rehbinder, G., “Slot Cutting in
Rock
with a High Speed Water Jet,” Int.
J.
Rock Mech. Miner. Sci. Geomech. Abst., 1977, Vol. 14, pp. 229-234.
Veenhuizen,
S.
D.,
Cheung,
J.
B.,
and Hill, J. R. M., “Waterjet Drilling of
Small Diameter Holes,” 4th Int. Sym. on Jet Cutting Tech., England, April
1978, Paper No. C3, pp. C3-3W3-40.
Iihoshi,
S.,
Nakao,
K.,
Torii,
K.,
and Ishii,
T.,
“Preliminary Study on Abrasive
Waterjet Assist Roadheader,” 8th Int. Symposium on Jet Cutting Tech.,
Durham, England, Sept., 1986, Paper #7, pp. 71-77.
Yu,
S.,
“Dimensionless Modeling and Optimum Design
on
Water Jet Cutting
Systems,” Ph.D. Thesis, University of Wisconsin-Madison, 1992.
Hood, M., Knight, G. C., and Thimos, E. D., “A Review of Jet Assisted Rock
Cutting,” ASME Trans., J. Eng. Indust., May 1992,
Vol.
114, pp. 196-206.
Vol. 96(3), pp. 863-869.
1990, Vol. 27(2), pp. 77-86.
408
Chapter
9
75.
Mogami, T., and Kubo,
K.,
“The Behavior
of
Soil
during Vibration,” Proc. of
3rd Int. Conf. of Soil Mech. Foundation Engineering,
1953,
Vol.
1,
pp.
152-
155.
76.
Savchenko, I., “The Effect
of
Vibration of Internal Friction in Sand,” Soil
Dynamics Collection
of
Papers, No.
32,
State Publishing House on
Construction and Construction Materials, Moscow, NTML Translations,
1958.
77.
Shkurenko, N.
s.,
“Experimental Data on the Effect of Oscillation on Cutting
Resistance
of
Soil,”
J. Agric. Eng. Res.,
1960,
Vol.
5(2),
pp.
226-232.
78.
Verma, B., “Oscillating Soil Tools
-
A Review,” Trans. ASAE,
1971,
pp.
79.
Choa,
S.,
and Chanceller, W., “Optimum Design and Operation Parameters
for a Resonant Oscillating Subsoiler,” Trans. ASAE,
1973,
pp.
1200-1 208.
80.
Kotb, A. M and Seireg, A., “On the Optimization of Soil Excavators with
Oscillating Cutters and Conveying Systems,” Mach. Vibr.,
1992,
Vol.
1,
pp.
64-70.
8
1.
Hohl,
M.,
and Luck, J. V., “Fractures of the Tibial Condyle: A Clinical and
Experimental Study,” J. Bone Joint Surg. (A),
1956,
Vol.
38,
pp.
1001-1018.
82.
Lack, C. H., and Ali,
S.
Y.,
“Cartilage Degradation and Repair,” Nat. Acad.
Sci., Nat. Res. Council, Washington, D.C.,
1967.
83.
Palazzi, A.
S.,
“On the Operative Treatment of Arthritis Deformation of the
Joint,” Acta Orthop. Scand.,
1958,
Vol.
27,
pp.
291-301.
84.
Weiss, C., Rosenberg, L., and Helfet, A. J., “Bone Surgery,” (A),
1968,
Vol.
50.
85.
Trias, A., “Cartilage, Degeneration and Repair,” Nat. Acad. Sci., Nat. Res.
Council, Washington, D.C.,
1967.
86.
Luck, J. V., “Cartilage Degradation and Repair,” Nat. Acad. Sci., Nat. Res.
Council, Washington, D.C.,
1967.
87.
Sokoloff, L., The Biology
of
Degenerative Joint Disease, University
of
Chicago Press, Chicago, IL,
1969.
88.
Radin,
E.
L., et al., “Response of Joints to Impact Loading
-
111,” J.
Biomech.,
1973,
Vol.
6,
pp.
51-57.
89.
Radin,
E.
L., and Paul, I. L., “Does Cartilage Compliance Reduce Skeletal
Impact Loads?” Arth. Rheum.,
1970,
Vol.
13,
p.
139.
90.
Radin,
E.
L., Paul,
1.
L., and Tolkoff, M. J., “Subchondral Bone Changes in
Patients with Early Degenerative Joint Disease,” Arth. Rheum.,
1970,
Vol.
14,
p.
400.
91.
Simon,
S.
R., Radin, E. L., and Paul,
I.
L., “The Response
of
Joint to Impact
Loading
-
11. In vivo Behavior of Subchondral Bone,” J. Biomech.,
1972,
Vol.
5,
p.
267.
92.
Seireg,
A.,
and Gerath, M., “An in vivo Investigation of Wear in Animal
Joints,” J. Biomech.,
1975,
Vol.
8,
pp.
169-172.
93.
Seireg, A., and Kempke, W., J. Biomech.,
1969,
Vol.
2.
94.
Smith, J., and Kreith, F., Arth. Rheum.,
1970,
Vol.
13.
1107-1
115.
Case
Illustrations
of
Surface
Damage
409
95.
Cameron, J. R., and Sorenson, J., “Cameron Photon Absorption Technique of
Bone Mineral Analysis,” Science,
1963,
Vol.
142.
96.
Redhler,
I.,
and Zimmy, L., Arth. Rheum.,
1972,
Vol.
15.
97.
McCall, J., Lubrication and Wear
of
Joints, J. B. Lippincott Company,
Philadelpha, PA,
1969,
pp.
30-39.
98.
Blok, H., “The Flash Temperature Concept,” Wear,
1963,
Vol.
6,
pp.
483494.
99.
Seif, M. A., and Abdel-Aal,
H.
A., “Temperature Fields in Sliding Contact by
a Hybrid Laser Speckle-Strain Analysis Technique,” Wear,
1995,
Vol.
181-
100.
Attia, M.
H.,
and D’Silva,
N.
S.,
“Effect
of
Motion and Process Parameters on
the Prediction
of
Temperature Rise in Fretting Wear,” Wear,
1985,
Vol.
106,
101.
Bowden,
F.
P., and Tabor, D., “Friction and Lubrication,” John Wiley, New
York,
NY,
1956.
102.
Gecim, B., and Winer,
W.
O.,
“Transient Temperature in the Vicinity of an
Asperity Contact,”
J.
Tribol., July
1985,
Vol.
107,
pp.
333-342.
103.
Tian,
X.,
and Kennedy, F. E., “Contact Surface Temperature Models for
Finite Bodies in Dry and Boundary Lubricated Sliding,” J. Tribol., July
1993,
Vol. 115, pp.
41 1418.
104.
Greenwood,
J.
A., and Alliston-Greiner, A.
F.,
“Surface Temperature in a
Fretting Contact,” Wear,
1992,
Vol.
155,
pp.
269-275.
105.
Chang, C. T., and Seireg, A., “Dynamic Analysis of a Ramp-Roller Clutch,”
ASME paper
No.
DETC
’97/VIB-4043, 1997.
106.
Mindlin, R. D., “Compliance of Elastic Bodies
in
Contact,’’ J. Appl. Mech.,
107.
Johnson, K. L., “Surface Interaction Between Elastically Loaded Bodies
Under Tangential Forces,” Proc. Roy. Soc. (Lond.),
1955,
A, Vol.
230,
p.
53
1.
108.
Greenwood,
J.
A., Williamson,
J.
B. P., “Contact of Nominally Flat Surface,”
Proc. Roy. Soc. (Lond.), Ser. A,
1966,
Vol.
295,
pp.
30&319.
109.
Blok, H., “Theoretical Study of Temperature Rise at Surfaces of Actual
Contact under Oilness Lubricating Conditions,” Proc. General Discussion
on Lubrication and Lubricants, Inst. Mech. Engrs, London,
1937,
Vol.
2,
110.
Jaeger,
J.
C., “Moving Sources of Heat and the Temperature at Sliding
Contacts,” Proc. Roy. Soc. (N.S.W.),
1942,
Vol.
56,
p.
203.
11
1.
Meng, H. C., and Ludema, K.
C.,
“Wear Models and Predictive Equations:
Their Form and Content,” Wear,
1995,
Vol.
181-183,
pp.
443-457.
112.
Kayaba, T., and Iwabuchi, A., “The Fretting Wear of
0.45%C
Steel and
Austenitic Stainless Steel from
20
to 650°C in Air,” Wear,
1981-1982,
Vol.
113.
Hurricks,
P.
L., and Ashford,
K.
S.,
“The Effects of Temperature
on
the
Fretting Wear of Mild Steel,” Proc. Inst. Mech. Engrs,
1969-1970,
Vol.
184,
p.
165.
114.
Feng, I. M., and Uhlig, H.
H.,
“Fretting Corrosion of Mild Steel
in
Air and in
Nitrogen,”
J.
Appl. Mech.,
1954,
Vol.
21,
p.
395.
183,
pp.
723-729.
pp.
203-224.
1949,
Vol.
71,
pp.
259-268.
pp.
222-235.
74,
pp.
229-245.
410
Chapter
9
115.
116.
117.
118.
119.
120.
121.
122.
123.
124.
Hurricks, P.
L.,
“The Fretting Wear of Mild Steel from Room Temperature to
2OO0C,” Wear, 1972, Vol. 19,
p.
207.
Bill,
R.
C., “Fretting Wear of Iron, Nickel and Titanium under Varied
Environmental Condition,” ASME, Proc. Int. Conf. on Wear of Materials,
Dearborn, MI, 1979,
p.
356.
Kayaba,
T.,
and Iwabuchi, A., “Influence of Hardness on Fretting Wear,”
ASME, Proc. Int. Conf. on Wear of Materials, Dearborn, MI, 1979, p. 371.
Jones, M. H., and Scott, D., “Industrial Tribology,” Elsevier, New York,
1983.
Rabinowicz, E., Friction and Wear of Materials, John Wiley and Sons, New
York, NY, 1965.
Archard,
J.
F.,
“Contact and Rubbing of Flat Surfaces,” J. Appl. Phys., 1953,
Seireg, A., and Hsue, E., “An Experimental Investigation of the Effect of
Lubricant Properties on Temperature and Wear in Sliding Concentrated
Contacts,” ASME-ASLE Int. Lubrication Conf., San Francisco, CA, Aug.
Suzuki, A., and Seireg, A., “An Experimental Investigation of Cylindrical
Roller Bearings Having Annular Rollers,” ASME,
J.
Tribol., Oct. 1976, pp.
Sato, J., “Fundamental Problems
of
Fretting Wear,” Proc. JSLE Int.
Tribology Conf., July 8-10, 1985, Tokyo, Japan, pp. 635-640.
Sato,
J.,
“Damage Formation During Fretting Fatigue,” Wear, 1988,
Vol.
125,
Vol. 24, pp. 981-988.
18-21, 1980.
538-546.
pp. 163-174.
10
Friction in Micrornechanisrns
10.1
INTRODUCTION
The emerging technology of micromechanisms and microelectromechanical
systems
(MEMS)
is integrating mechanical, material, and electronic sciences
with precision manufacturing, packaging, and control techniques to create
products as diverse as microminiaturized robots, sensors, and devices for the
mechanical, medical, and biotechnology industries. New types of micro-
mechanisms can now be built to measure very small movements and
produce extremely low forces. Such devices can even differentiate between
hard and soft objects
[l-31.
Although many of the advanced and still experimental processes which
are currently being investigated for the microelectronic devices can be
applied to the manufacturing
of
micromechanical components, the conven-
tional semiconductor processing based
on
lithography and etching still is
the predominant method. Other techniques include beam-induced etching
and deposition as well as the
LIGA
process which can be used for metal,
polymer, and ceramic parts.
The method
of
fabrication
known
as the sacrificial layer technique can
be employed to manufacture complex structures such as micromotors by
successive deposition and etching
of
thin films
[4-71.
The Wobble motor manufactured
of
silicon at the University of Utah is
driven by electrostatic forces generated by applying a voltage to the motor
walls. The micromotor developed at the University of California at Berkeley
is only
60
pm in diameter. Although some silicons have proven to be almost
as strong as steels, researchers in microfabrication technology are experi-
41
I
412
Chapter
10
menting with the mass production of metallic components. Examples of this
are gears made of nickel and gold which are approximately
50
pm thick and
can be made even smaller.
Microscopic parts and precise structural components are now being
created on silicon chips by depositing ultrathin layers
of
materials in some
areas and etching material away from others. Templates for batches of tiny
machines can be positioned using high-powered microscopes.
Scaling laws dictate that the ratio of surface area
to
volume ratio
increases inversely with size.
Because of their very large surface-area-to-volume ratios, adhesion,
friction, drag, viscous resistance, surface tension, and other boundary forces
dominate the behavior
of
these systems as they continue
to
decrease in size.
The surface frictional forces in MEMS may be
so
large as to prevent relative
motion. Understanding frictional resistance on a microscale is essential
to
the proper design and operation of such systems.
Some important factors which influence frictional resistance, besides
surface geometry and contamination, are other surface forces such as
electrostatic, chemical, and physical forces which are expected to be
significant for microcomponents. The influence of capillary action and
adsorbed gas films, environmental temperature and humidity is also
expected to be considerably greater in MEMS.
Although the frictional resistance and wear phenomena in MEMS are
far from being fully understood, this chapter presents illustrative examples
of frictional forces from measurements on sliding as well as rolling contacts
between materials of interest to this field.
10.2
STATIC FRICTION
A number of researchers have examined the frictional forces in microelectro-
mechanical systems. In recent experiments, the frictional properties of dif-
ferent materials were examined by sliding components made of different
materials under the same loading conditions.
Tai and Muller
[8]
studied the dynamic coefficient
of
friction in a vari-
able capacitance
IC
processed micromotor. Friction coefficients in the range
0.2
1-0.38 for silicon nitride-polysilicon surfaces were reported. Lim et al.
[9]
used a polysilicon microstructure to characterize static friction. They
reported friction coefficients of
4.9
f
1
.O
for coarse-grained polysilicon-
polysilicon interfaces and
2.5
f
0.5
for silicon nitride-polysilicon surfaces.
Mehregany et al.
[lO]
measured both friction and wear using a polysilicon
variable-capacitance rotary harmonic side-drive micromotor. They report a
frictional force of
0.15
mN at the bushings and
0.04
mN in the bearing of the
Friction in Micromechanisms
413
micromotor. Both the bushings and bearing surfaces were made of heavily
phosphorus-doped polysilicon. Noguchi et al.
[
1
11
examined the coefficient
of maximum static friction for various materials by sliding millimeter-sized
movers electrostatically. The value obtained (0.32) for the static friction
coefficient of silicon nitride and silicon surfaces in contact is smaller by a
factor of
8
that the one reported by Lim et al. [9]. However, the measured
values for the dynamic coefficient of friction are close to those reported in
Ref.
8.
Suzuki et al. [12] compared the friction and wear of different solid
lubricant films by applying them to riders and disks of macroscopic scale
and sliding them under the same loading conditions. Larger values of the
dynamic coefficient of friction (0,749) were obtained for silicon nitride and
polysilicon surfaces than the ones reported by Tai and Muller.
A
comprehensive investigation of the static friction between silicon and
silicon compounds has been reported by Deng and
KO
[13]. The materials
studied include silicon, silicon dioxide, and silicon nitride. The objectives
of
their study are to examine different static friction measurement techniques
and to explore the effects of environmental factors such as humidity, nitro-
gen, oxygen, and argon exposure at various pressures on the frictional
resistance.
Two types of tribological pairs were used. In the first group of experi-
ments, flat components of size
2
mm were considered. In the second group of
experiments, a 3 mm radius aluminum bullet-shaped pin with spherical end
coated with the test material is forced to slide on a flat silicon substrate. The
apparent area of contact in the second group was measured by a scanning
electron microscope and estimated to be in the order of
0.03-0.04
mm2.
The tests were performed in a vacuum chamber where the different
gases can be introduced. The effect
of
humidity was determined by testing
the specimens before and after baking them. The normal force was applied
electrostatically and was in the range of
10-3N.
The tangential force was
applied by a polyvinylide difluoride bimorph cantilever, which was cali-
brated to generate a repeatable tangential force from
0
to
8
x
10-4N.
Excellent correlation was obtained between the normal force and the
tangential force necessary to initiate slip. The slope of the line obtained by
linear regression of the data represents the coefficient of friction.
Their results are summarized in Tables 10.1 and 10.2 for the different
test groups.
Several significant conclusions were drawn from the study, which are
stated as:
Humidity in air was found to increase the coefficient of friction from
55%
to
157%.
414
Chapter
10
Table
10.1
Nitride)
Measurement Results from Experiment
A
(SiN,:
PECVD
Silicon
~~
10-5
Torr
(after
Air (before baking) Air (after braking) baking)
SIN, on SiN,a
0.62-0.84
0.62-0.84 0.53-0.71
SiOz on SiOz
0.54
f
0.03
0.21
f
0.03 0.36
f
0.02
SiOz
on
Si
0.48
f
0.02
0.31
f
0.03
0.33
f
0.03
aMeasured at different locations with maximum deviation
f0.03.
Source:
Ref.
13.
Exposure to argon produced no change in friction.
Exposure to nitrogen resulted in either no change or a decrease in the
Exposure
to
oxygen increased the frictional resistance.
coefficient
of
friction.
10.3
ROLLING FRICTION
Rolling element bearings are known to exhibit considerably lower frictional
resistance than other types of bearings. They are therefore expected to be
extensively used in MEMS because
of
their lower frictional properties,
improved life, and higher stability in carrying loads.
Microroller bearings can therefore play an important role in improving
the performance and reducing the actuation power of micromechanisms.
This section presents a review of the fabrication processes for such bearings.
Results are also given from tests on the frictional resistance at the onset
of
motion in bearings utilizing stainless steel microballs in contact with silicon
micromachined v-grooves with and without coated layers
[
141.
A
macro-
model
is
also described based
on
the concept
of
using the width of the
hysteresis loop in a full motion cycle of spring-loaded bearings to evaluate
the rolling friction and the effect
of
sliding on it. A test method is presented
for utilizing the same basic concept for test rolling friction in very small
microbearings
[
151.
10.3.1
Fabrication Processes
The silicon micromachined v-grooves are made using
3
in.,
0.1
R-cm
(100)
p-type silicon wafers
508
pm thick. The wafers were cleaned using a standard
RCA procedure.
A
thin layer
(700
A)
of thermal oxide was grown at 925°C.
A
3000
A
LPCVD silicon nitride was deposited on the thermal oxide. The
Friction
in
Micromechanisms
41s
Table
10.2
Measurement Results from Experiment
B
(SiN,: PECVD Silicon Nitride)
UHV
Air
(before
(-
5
x
10-l'
Ar
(c
10-6
N2
(<
10-6
O2
(<
10-('
baking)
Torr)
Torr)
Torr)
Torr)
R-N2' R-Ozc R-(02/N2)d
~~
SiN, on SIN,
0.55-0.85
0.40-0.70a
0.404.7@
Decrease from Increase
from
-
0.6
-
1.6
-
1.9
SiN, on Si
0.404.55a
0.35
f
0.05
0.35
f
0.05
0.35
f
0.05
Increase to
-
1.0
-
1.3
-
1.3
Si02
on
Si02
0.43
f
0.05
0.20
f
0.02
0.20
f
0.02
Decrease
to
Increase
to
-
0.8
-
3.8
-
5.0
Si02
on
Si
0.55
f
0.05
0.39
*
0.04
Decrease
to
Increase
to
-
0.5
-
1.4
-
2.7
0.58
to
0.35b
0.44
to
0.68b
0.45
f
0.05
0.75
f
0.05
0.55
f
0.04
0.15
f
0.02
0.20
f
0.02
aMeasured at different locations with maximum deviation
f0.05.
bMeasured at the same location with maximum deviation
fO.05.
'R-N2
and
R-02
are ratios
of
the coefficients of friction measured in nitrogen and oxygen to those measured in
UHV,
respectively.
dR-(Oz/Nz)
is the ratio of the coefficients
of
friction measured in oxygen
to
those measured in nitrogen.
Source:
Ref.
13.
416
Chapter
I0
samples were patterned photolithographically.
A
plasma etch
(CF4/O2)
was
used to etch the silicon nitride and thermal oxide to form the anisotropic
etch mask. The photoresist was removed using a chemical resist remover.
The samples were then cleaned in a solution of
NH40H:H202:H20
1: 1:6 in
an ultrasonic bath for
5
min. Prior to micromachining, the samples were put
in a dilute
HF
bath for 1Osec to remove the native oxide. The patterned
samples were immersed in a quartz reflux system containing an anisotropic
etchant solution of
KOH:H20
(40% by weight) at
60°C
constant tempera-
ture for 12hr. The micromachined samples were then immersed in a reflux
system containing concentrated phosphoric acid at 140°C for 2hr in order
to remove the silicon nitride and then in a buffered-oxide etch
(BOE
1:20)
bath for 1Omin to remove the thermal oxide. The samples were rinsed with
deionized
H20
and blow-dried with nitrogen gas [14].
10.3.2
Rolling Friction at the Onset
of
Motion
A
recent investigation by Ghodssi et
al.
[
141 utilized a tilting table with
0.0
1
'
incremental movement to study the tangential forces necessary to initiate
rolling motion of stainless steel microballs (285pm in diameter) in micro-
machined v-grooves
(3
10 pm wide, 163 pm deep, 10,000 pm long and
14,000pm edge to edge) with and without the deposited thin films.
A
sche-
matic representation of the bearing is given in Fig. 10.1. The average values
1
(loo)
surface
Figure
10.1
Schematic representation of the cross-sectional view of the test speci-
men. Dashed lines show the width of the etched v-groove
(w)
and the angle
13
between
the
(100)
surface and
(1 1
I)
plane. (From Ref.
14.)
Friction in Micromechanisms
41
7
of the frictional resistance at the onset
of
rolling friction obtained from
20
measurements in both directions of motion were found to be as follows for
the three test materials used for the grooves:
FT
=
0.046
+
0.0076FN
for the silicon grooves,
FT
=
0.059
+
0.0083FN
when a
0.3
pm silicon nitride thin film was deposited on the surface of the
grooves,
FT
=
0.036
+
0.0076FN
when a
0.5
pm sputtered-chromium thin film was deposited on the surface of
the grooves, where
FT
=
frictional force (mg) at the onset
of
rolling
FN
=
normal force
(mg)
10.3.3
Rolling Friction During Motion
The frictional resistance in rolling element bearings in micromechanical
systems has not yet been thoroughly investigated. The previous investigation
[14]
dealt only with the resistance at the onset of motion but not during the
rolling motion. In the study reported in
[IS],
a macro (scaled-up) model is
used to investigate the feasibility
of
measuring rolling friction on a micro-
scale. Such investigations can provide useful information on important fac-
tors which have to be taken into consideration in the design of an
experiment for reliable measurements on a microscale because the forces
required to sustain the rolling motion after the start are expected to be
extremely small.
10.3.4
The Macroscale Test
A
setup was designed as shown in Fig.
10.2
for the feasibility study.
It
represents a scaled-up model utilizing v-grooves
(4
in. long,
0.5
in. wide.
and
1.3
in. thick) in steel blocks and stainless steel balls
(0.375
in. in dia-
meter).
A
soft spring is attached to the top v-block or slider, at one end.
A
string is attached to the opposite end to apply the tangential force and is
Figure
t
0.2
An
experimental setup for characterizing
the
rolling friction
on
a
macroscale. This concept
can
be irnpleinented for ineasuring rolling friction
on
a
microscale.
supported by a pulley with
low
friction. The normal
load
as
well
as
the
tangential loads are applied by placing weights of known magnitude on
the top v-block and pouring sand in the container attached
to
the string
respectively.
The hysteresis in the setup is measured with and without the slider in
place. Figure 10.3 shows the measured applied force versus displacement for
the spring case and the
spring
with the slider case. First the string is attached
directly
to
the spring and
is
poured into the container and
the
displacement
is measured. Additional amounts of sand are added
to
yield an increased
applied force
up
to about
70gm.
Then sand is removed to reduce the applied
force
and
complete the hysteresis
loop
as
shown in Fig.
10.3.
In
the second
part of the experiment, the set
of
large model metal v-grooves and stainless
ball bearings are
used.
Two ball bearings arc positioned on the front and
rear of
a
v-groove. respectively. The other v-groove is put on top of the
ball
bearings and used
as
a
slider. The same procedure
is
performed
as
before
with increasing and decreasing applied normal loads.
In
this case the hyster-
esis
is
larger.
The
arrows in the figure show the difference between the
hysteresis loops which represent the rolling friction between the balls and
grooves. The normal load
in
this case
is
equal to
500gm.
It
can
be deduced
from the figure that the
rolling
friction
in
this case is equal to:
4.33
400
/l
=
-
=
0.00866
Friction in Micromechanisms
41
9
8
Figure
10.3
The measured force versus displacement for the system with and
without the bearing. The difference in hysteresis is due to the rolling friction in the
bearing.
The macroscale test serves a very useful function in quantifying the effect of
normal load on the relative sliding which takes place between the balls and
groove during the rolling action. This is monitored during the tests by
tracing the ball movement on the upper and lower v-grooves. The slide-
to-roll ratio
is
found to be significant and can be as high as
30%
in the
performed test.
10.3.5
The Microscale Test
A
microscale test setup is described in this section which can be utilized for
testing micromachined bearings. It is based
on
the same concept
as
the
macroscale test described in the previous section.
A
schematic representation
of
the setup
is
shown in Fig.
10.4.
Three
U
springs made of thin Ti-Ni wire are attached to each end
of
the top v-block.
The motive force can be gradually applied by activating the springs on one
end
of
the block by passing an electric current in the wire. The force can also
be applied by using polyvinylide difluoride bimorph cantilevers
[
131.
420
Chapter
10
Insulated
Frame
/
Displacement
Monitor
Figure
10.4
(a) Mechanical setup.
itoring systems.
Force
/Id
(b)
Force application and displacement mon-
The movement of the block can be monitored by optical encoders and
interferometers or by using a calibrated cathode follower
[
161. The system is
self-contrained and can be conveniently calibrated using a traveling micro-
scope. The hysteresis can be displayed on the screen of a cathode ray tube.
The springs can
be
designed to generate tangential forces in the microgram
range for any desired range
of
micromovements.
The effective use of microroller bearing in micromechanisms
is
highly
dependent on the accurate prediction of their frictional resistance. The
macormodel used in the reported study shows that the frictional resistance
during movement can be evaluated from the hysteresis loop obtained from
the spring supported upper block of the bearing. The friction in the bearing
is measured from the differential change of the width of the loop with
normal load. The observation of the behavior of the scaled-up model includ-
Friction in Micromechanisms
42
I
ing the observed slip was very helpful in the planning of the proposed
microscale test setup. The frictional resistance measured in
all
the performed
tests were found to be considerably lower (by orders of magnitude) than
those reported in the literature for microsliding bearings.
I.
2.
3.
4.
5.
6.
7.
8.
9.
10.
11.
12.
13.
14.
Hazelrigg,
G.
A., “Microelectromechanical Devices, an Overview,” SPIE, Vol.
1, Precision Engineering and Optomechanics, 1989, p.
1
14.
Hayashi, T., “Micro Mechanisms,” J. Robot. Mechatron., Vol. 3(
1).
Seireg, A., “Micromechanisms: Future Expectations and Design
Methodologies,”
1st
IFTOMM, Int. Micromechanism Symposium, Japan,
June 1-3, 1993, pp. 1-6.
Csepregi,
L.,
“Micromechanics: A Silicon Microfabrication Technology,”
Microelect. Eng., 1985, No. 3, p. 221.
Peterson, K. E., “Silicon as a Mechanical Material,” Proc. IEEE, 1982, Vol. 70,
p.
420.
Benecke, W., “Silicon Micromachining for Microsensors and Microactuators,”
Microelect. Eng., 1990, No. 11, p.
73.
Mehregany, M., Senturia,
S.
D.,
Lang, J. H., and Nagarkar, P., “Micromotor
Fabrication,” IEEE Trans. Electron Dev., September 1992, Vol. 38(9).
Tai,
Y.
C.,
and Muller,
R.
S.,
“Frictional Study of IC-Processed Micromotors,“
Sens. Actuat., 1990, A21-A23, pp. 180-183.
Lim, M.
G.,
Chang, J. C., Schultz,
D.
P., Howe,
R.
T., and White,
R.
M
“Polysilicon Microstructures to Characterize Static Friction,” Proc.
of
IEEE
Workshop on Micro Electro Mechanical Systems (MEMS), Napa Valley, CA,
Feburary 1990, pp. 82-88.
Mehregany, M., Senturia,
S.
D.,
and Lang,
J.
H.,
in “Technical Digest
of
IEEE
Solid State Sensors and Actuators Workshop,” Hilton Head Island, South
Carolina, June 1990, p. 17.
Noguchi,
K.,
Fujita, H., Suzuki,
M.,
and Yoshimura, N., “The Measurements
of Friction on Micromechatoronics Elements,’’ Proc.
of
the IEEE Workshop on
Micro Electro Mechanical Systems (MEMS), Nara, Japan, February 1991, pp.
Suzuki,
S.,
Matsuura,
T.,
Uchizawa,
M.,
Yura,
S.,
Shibata, H., and Fujita,
H.,
“Friction and Wear Studies on Lubricants and Materials Applicable to
MEMS,” Proc. of the IEEE Workshop on Micro Electro Mechanical
Systems (MEMS), Nara, Japan, February 199
1,
pp. 143- 147.
Deng, K., and
KO,
W. H., “A Study
of
Static Friction between Silicon and
Silicon Compounds,”
J.
Micromech. Microeng., 1992, Vol. 2, pp.
14-20.
Ghodssi,
R.,
Denton, D. D., Seireg, A. A., and Howland, B., “Rolling Friction
148-
1
53.
REFERENCES
in a Linear Microactuator,” JVST A, August 1993, Vol.
1
I,
No. 4, pp. 803-807.
422
Chapter
10
15.
Ghodssi,
R.,
Seireg, A., and Denton, D., “An Experimental Technique for
Measuring Rolling Friction in Micro-Ball Bearings,” Proc. First
IFTOMM
Int. Micromechanism Symp., Japan, June
1-3,
1993, pp. 144149.
16. Seireg, A., Mechanical System Analysis, International Textbook
Co.,
Scranton,
PA., 1969.
11
Friction-Induced Sound and Vibration
11.1
INTRODUCTION
The phenomenon
of
sound and vibration generation by rubbing action has
been known since ancient times. Its undesirable manifestation as in the case
of the squeal of chariot wheels has been remedied by the use of wax or fatty
lubricants. Friction-induced sound phenomena have been used to advantage
in developing musical instruments where rubbing strings causes them to
vibrate at their natural frequency and generate sound with predictable tones.
Modern advances in sound monitoring instrumentation are now mak-
ing
it
possible for the formation of cracks due to material fatigue to be
readily detected at an early stage by the acoustic emission caused by rubbing
at the crack site.
This chapter gives a brief introduction to the mechanism of sound gen-
eration. Two aspects
of
the phenomena will be considered. The first is the
rubbing noise due to asperity interaction and the resulting surface waves.
The second is the sound generated due to the vibration of a mechanical
element or structure, which is self-excited with its intensity controlled and
sustained by the rubbing action.
11.2
FRICTIONAL NOISE
DUE
TO
RUBBING
One of the major sources of noise in machines and moving bodies is friction.
Examples of the numerous studies of the noise generated by relative displa-
cements between moving parts of machines and equipment are reported in
423
424
Chapter
I!
Refs
1-6.
Only a few studies have been carried out to investigate the dis-
tinctive properties of such noise. In 1979 Yokoi and Nakai [7] concluded,
based upon experimental studies, that frictional noise could be classified into
two categories: rubbing noise which is generated when the frictional forces
between sliding surfaces are relatively small, and squeal noise which occurs
when those forces are high. In
1986,
Symmons and McNulty
[8]
investigated
the acoustic signals due to stick-slip friction by comparing the vibration and
noise emission from perspex-steel junction with those of cast iron-steel and
steel-steel junctions. The results indicated the presence
of
acoustic signals in
some sliding contact cases and not in others. An important consideration in
frictional noise is how sound due to sliding is influenced by surface rough-
ness and material properties.
An experimental investigation into the nature of the noise generated,
when a stylus travels over a frictional surface, has been carried out by
Othman et al.
[9],
using several engineering materials. The relation between
the sound pressure level
(SPL)
and surface roughness under various contact
loads was established. An acoustic device was designed and constructed to
be used as a reliable tool for measuring roughness. For each tested material,
it has been found that the filtered noise signal within a certain spectrum
bandwidth contains a specified frequency at which the amplitude is max-
imum. This frequency, called the dominating frequency, was found to be a
material constant independent of surface roughness and contact load.
It
was
also found that the dominating frequency for a given material is propor-
tional to the sonic speed in that material.
11.2.1
Experimental Setup
The device shown in Fig.
11.1
was constructed to study the relation between
frictional noise properties and surface roughness of the material. The main
features of the transducer shown schematically in Fig.
11.1
are a spring-
loaded stylus
(1)
(numbers refer to the components) attached to a rotating
disk
(2)
which is driven by a
DC
servomotor
(3).
The end
of
the spring has a
tungsten carbide tip
(4)
which constitutes the sliding element. The rotating
disk is dynamically balanced by a small mass
(5)
to minimize disk rotational
vibration. As the tip slides over the specimen surface
(6),
a
frictional noise is
generated. The noise intensity depends on surface material, roughness, slid-
ing velocity, and spring load. The load can be increased incrementally by
raising the moving plate
(7)
with the hydraulic jack
(8)
in order to compress
the spring, The movement is monitored by the dial gage (9). The load may
also be decreased by lowering the jack. The disk and spring rotate inside a
chamber
(10).
The chamber is internally covered by a foamy substance
(1 1)
which acts as a sound-insulating material that eliminates the surrounding
Figure
1
I ,I
Espcriinental
setup.
426
Chapter
I
I
noise. The chamber, which houses the
DC
motor, is lined with an additional
sound insulating material (12) at the interface between the motor and the
chamber. The contact load, exerted by the spring on the surface, is con-
trolled by the axial movement of the motor assembly relative to the chamber
by means of the threaded nut (1 3). The motor was selected to produce as low
a noise level as possible during operation. The frictional sound generated by
the stylus rotation is monitored by the microphone and the sound level
meter, B
&
K
type
2209
(14). The sound pressure signal is recorded by
spectral analysis by the storage oscilloscope (15) and is displayed
on
the
strip chart (16).
A
real-time spectrum analyzer
(17)
is used as well.
A
band-
pass filter (18) is used to select the frequency range of interest.
The spring tip was set to rotate by means of a 12V DC motor at a
constant speed of 1000 rpm over a circular path of 10mm radius. This
results in a linear circumferential speed of 1.05m/s, which was found to
produce repeatable noise spectra. The motor speed was checked regularly
by means of a stroboscope.
The faces of test specimens, approximately 80mm in diameter, were
turned to obtain a range of roughness from
1
to 20pm. Three different
specimen materials were used: steel
SAE
1040,
annealed yellow
a!
brass
(65 Cu-35 Zn), and commercial pure aluminurn 1100
(99.9
+
%
Al).
Table
1
1.1
lists the properties of these materials.
In
all tests, the spring stylus axis of rotation was offset 20mm from the
specimen center. This was to ensure that the stylus tip traveled across the lay
most of the time. The experiments were carried out in a 2
x
3
x
2
m sound-
insulated room where the background noise did not exceed 6dB.
11.2.2
Experimental Results and Discussion
The stiffness of the stylus spring used in the device was
5
10 N/m. For each
material tested, the sound pressure level
(SPL)
was recorded for the tip
circumferential speed of 1.05m/s. In order to compare the results, which
were obtained when using the transducer with conventional direct measure-
Table
1 1
.l
Material Properties
Elastic modulus Specific weight Sonic speed Surface wave
Material (GW (kN/m3)
(m/s)
speed
(m/s)
Steel
207 76.5 5196
3080
Brass
106
83.8
3415 1950
Aluminurn
71
26.6 5156
297
1
Friction-Induced Sound and Vibrations
42
7
ments of surface roughness, a commercial roughness meter (Talysurf 10;
Taylor and Robson Ltd.) was used. The
SPL
signals and the average rough-
ness readings that were obtained from both instruments are shown in Fig.
11.2. The contact loads at the stylus tip were 0.25,
0.50,
0.75,
and
1
.OO
N,
as
indicated in the figure. The relationship between the generated sound pres-
30
Contact
Load
-
0.26
N
20-
10
-
0.
Contact
Load
-
0.5 N
40-
-30-
0.
120-
0
Jj
10-
02
-I-
Contact
Load
=
0.6
N
Frequency
(kHz)
Figure
1
1.2
SPL
spectrum in frequency domain for different materials (contact
load
=
OSON,
all
cases).
428
Chapter
I
I
sure levels and average roughness was found to be a straight line on the log-
log scale, and thus could be expressed as follows:
(11.1)
where
F
is the contact force and
B,
C,
and
n
are experimental parameters.
This indicates that
SPL
can be used as a reliable alternative means of quan-
tifying the average surface roughness at a given location on the surface.
The
SPL
is analyzed after being filtered in the range from
400Hz
to
20
kHz to capture the relevant frequencies. The sound signals are converted
to one-third octave spectra by FFT computing spectrum analyzer.
A
sample
of spectra obtained is shown in Fig. 11.2 when the normal load is
0.5
N
and
the average surface roughness
R,
is
as indicated in the figure.
It
is clear that
the
SPL
has a peak value at a given frequency depending upon the material
under investigation. The variations in surface roughness and contact load
will alter only the magnitude of the maximum
SPL,
but not the frequency at
which this maximum occurs. This frequency is referred to as the dominating
frequency and was found to be 12.2, 12.1, and
7.8
kHz for steel, aluminum,
and brass, respectively. The sound signals are filtered for those frequency
bands and analyzed separately. The
SPL
spectra in the frequency domain are
observed at different contact loads for steel specimens. The results in this case
are shown in Fig.
1
1.3,
which indicates that the
SPL
is very sensitive to loads,
despite the fact that the general trend of the spectra stays almost the same.
The dominating frequency for each of the three materials tested was
found to vary linearly with the sonic speed,
U,
as well as the speed of wave
propagation over the surface
vR
(Rayleigh waves). The results are presented
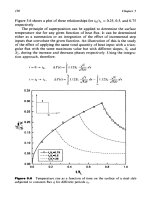
in Fig. 11.4 in which the surface speed
uR
was calculated from the following
expression
[
101:
(1
1.2)
(1
1.3)
where
E
=
modulus
of
elasticity
G
=
shear
modulus
o
=
specific weight
g
=
gravitational acceleration
Friclion- Induced Sound and Vibrations
40
30
20
429
-
Alumlnum,
R,
=
6pm
-
-
It is interesting to note that the SPL increases with increasing the contact
load when the sound signal
is
filtered at the dominating frequency. The
results also show that the filtered SPL increases linearly with roughness.