Friction and Lubrication in Mechanical Design Episode 2 Part 9 pps
Bạn đang xem bản rút gọn của tài liệu. Xem và tải ngay bản đầy đủ của tài liệu tại đây (1.21 MB, 25 trang )
430
Chapter
If
I
Figure
11.4
quency.
Correlation between speed of surface wave and dominating fre-
11.3
EFFECT
OF LUBRICATION ON NOISE REDUCTION
It
is generally accepted that frictional noise reduction can be achieved
through lubrication. This section provides a rational framework for quanti-
fying the role played by the lubricating
film
between the rubbing surfaces in
reducing the intensity of sound generated by relative motion.
The hypothesis considered in this section is that frictional rubbing noise
is the result of asperity penetration into the surface. The movement of the
asperity therefore disturbs the surface layer and generates surface waves.
The intensity
of
the sound can be assumed to be dependent on the depth of
penetration which can
in
turn be assumed to be proportional to the real area
Friction-Induced Sound and Vibrations
431
of contact.
As
discussed in Chapter
4,
the real area, as well as the frictional
resistance, change in an approximately linear function with the normal load.
It can therefore be assumed that the real area of contact between the lubri-
cated solids can be used as
a
quantitative indicator of the intensity of the
sound generated during sliding.
The roughness profile data given by McCool
[
1
I] for five different sur-
face finishing processes are used
to
determine the input parameters for the
Greenwood-Williamson microcontact model
[
121.
The model
is
then used to
compute the ratio of the real area
of
contact to the nominal area for the given
normal load and the thickness of the lubricant film separating the surfaces.
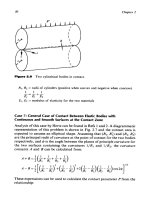
The model used for the illustration (Fig.
11.5)
is represented by two
rollers with radii
R,
=
R2
=
loin. subjected to a load
of
2000
lb/in. The
lubricant viscosity and speed are changed to produce different ratios of
film
thickness to surface roughness ranging from
0
to
3.0.
The considered surface
roughness conditions are given in Table 11.2.
Figure
11,s
Contact
model.
432
Chapter
11
Table
1
1.2
Roughness Conditions
Surface finishing rms roughness
0
Slope of the roughness
process (clin.) profile
1
Fine grinding 2.74
2
Rough grinding
21.5
3
Lapping
3.92
4 Polishing 1.70
5
Shot peening
45.9
0.01471
0.090
17
0.05254
0.01 157
0.07925
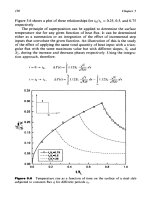
This ratio of the real area of contact to the nominal area, assuming
smooth surfaces, is given in Fig. 11.6. This ratio can be used to represent the
change in the relative sound intensity (dB) with lubrication for the different
surface finishing processes under the given load.
11.4
FRICTIONAL NOISE IN
GEARS
Gears are a well-known, major source
of
noise in machinery and equipment,
and it is no surprise that gear noise has been the subject of extensive inves-
Ratio
of
Total
Contact
Area
to
Nominal
Area
0.8
I
I I
I
I
a
I
1
2.0
2.5
3.0
Figure
11.6
for
different roughness and lubricant film conditions.
Ratio between the real area
A,./&
and nominal area
of
contact
A.
Friction-Induced Sound and Vibrations
433
tigations. The nature of gear noise is quite complex because of the multitude
of factors that contribute to it. The survey conducted by Welbourn
[
131 and
the comparative study presented by Attia
[14]
on gear noise revealed that the
published literature on the subject did not show how friction during the
mesh of the rough contacting teeth influences noise generation.
A
procedure for determining the effect of the different design and oper-
ating parameters on frictional noise in the gear mesh is presented by
Aziz
and Seirig
[
151. The Greenwood asperity-based model
[
121 with Gaussian
distribution of heights is utilized to evaluate the penetration of asperities in
the contacting surface of the teeth.
A
parametric relationship is developed
for relating the interpenetration of the asperities to the relative noise pres-
sure level (NPL) in the lubricated and dry regimes. Numerical results are
given in the following example to illustrate the effect of gear ratio, rough-
ness, load, speed, and lubricant viscosity on noise.
The frictional noise generated from a pair of helical involute steel gears
of 5 in.
(127
mm) center distance was calculated in both dry and lubricated
regimes for different design and operating parameters. The teeth are stan-
dard with a normal pressure angle equal to 25" and a helical angle equal to
31". The relation between the relative NPL and different gear ratios was
determined. Figures
1
1.7 and
1
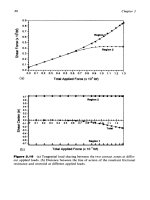
1.8 present the effect of change of load for
surface contact stresses 68.9, 689, 1378, and 1722.5 MPa
(
10,000,
100,000,
200,000, and 250,OOOpsi) on the relative NPL with an average surface
roughness of
0.005
mm
(CLA),
gear oil viscosity of
0.075
N-sec/m'
(0.075
Pa-sec), and pinion speeds of 1800 and
500
rpm, respectively. The
results show that the relative NPL increases with the increase of load for all
gear ratios. The rate of the relative NPL decreases as gear ratio increases.
When reducing the pinion speed from 1800 to
500
rpm the same trend
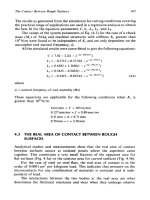
occurs but with higher noise levels, as shown in Fig. 11.8. This could be
attributed to the change in the film thickness and consequently the amount
of
penetration. This effect is clearly shown in Fig. 11.9 for surface contact
stress 689 MPa (100,000 psi), viscosity 0.075 N-sec/m2
(0.075
Pa-sec) and
surface roughness 0.005 mm.
The effect of change of surface roughness at different gear ratios on the
relative NPL is shown in Fig.
1
1.10
for contact stress 689 MPa
(100,000
psi),
pinion speed 1800 rpm, viscosity 0.075 N-sec/m2 (0.075 Pa-sec), and surface
roughness
0.0015,
0.002,
0.003,
and 0.005mm, respectively.
As
can be seen
in this figure, the relative NPL increases as would be expected with the
increase
of
surface roughness for every gear ratio since the number of aspe-
rities subject to deformation
is
high for higher roughness and consequently
the associated NPL becomes higher.
The effect of change of lubricant viscosity on the relative NPL at dif-
ferent gear ratios is presented in Fig.
11.1 1
for surface contact stress 689
434
Chapter
I I
U
=
0.005
mm
Contact Stress
-m-
68.9
MPa
-0-
689
MPa
-A-
1378
MPa
-F-
1722.5
MPa
0.15
-
0.10
I
I
I
I
I
.
I I
1
.o
1.5 2.0 2.5 3.0 3.5
Gear
Ratio
Figure
11.7
Effect of
load change
on
NPL.
'l'l'l'l'l'l
1
.o
1.5 2.0 2.5
3.0
3.5
Gear
Ratio
Figure
11.8
Effect of
load change
on
NPL.
Friction-Induced Sound and Vibrations
5
g
0.50-
-
3
0.45
1
0.40
-
0.35
-
0.30
-
435
0.50
-
0.45
-
0.40
-
0.35
-
0.30-
2
?
0.25-
a
0
K
5
0.20-
0.15
-
0.10
-
0.05
-
I
u-u-1-1-1
1
.o
1.5 2.0
2.5
3.0 3.5
Gear
Ratio
Figure
11.9
Effect
of
speed change on
NPL.
0.00
!
I
1
I
1
I
I
1
I
1
.o
1.5
2.0
2.5
3.0
3.5
Gear
Ratio
Figure
11.10
Effect
of
roughness
change
on
NPL.
436
Chapter
I I
0.40
-
0.10
1
I
I
I
I
I
I
I
1
.o
1.5
2.0
2.5
3.0
3.5
Gear
Ratio
Figure
11.1
1
Effect
of
viscosity change on
NPL.
MPa
(
100,000 psi), pinion speed
1800
rpm, surface roughness
0.005
mm and
viscosities
0.075, 0.15,
and
0.25
N-sec/m2
(0.075,
0.15, and
0.25
Pa-sec)
respectively.
It
can be seen that the relative NPL decreases with the increase
of
viscosity. This is attributed to the increase in the film thickness, which
causes a decrease in the penetration of asperities and the relative NPL.
The results from all the considered examples show that, as the gear ratio
increases, the relative NPL also increases. The reason is that with the
increase of the gear ratio, the transmitted load is decreased for the same
contact stress. Accordingly, the separation in the dry regime between the
mating teeth increases and the penetration decreases. While in the presence
of the lubricant, the film thickness is reduced due to the increase in gear
ratio, leading
to
an increase of penetration of the asperities. This results in
an increase in the ratio of penetration in lubricated regime
to
that in dry
regime, which gives rise
to
the increase of relative NPL.
It
can therefore be seen that the surface roughness effect as a contribut-
ing factor in the complex frictional gear noise spectrum could, to some
extent, be controlled. It could be reduced by improving the surface finish
of gear teeth through limiting their surface roughness to very low values,
and by using lubricating oils of high viscosities.
Friction-Induced Sound and Vibrations
437
Gear ratios of values greater than unity can have a significant effect
on increasing the
NPL
even with lower values of roughness. The devel-
oped procedure can be used to guide the designer in selecting the appro-
priate parameters for minimizing the frictional noise for any particular
application.
11.5
FRICTION-INDUCED VIBRATION AND NOISE
There are numerous cases in physical systems where sound due to vibrations
is developed and sustained by friction. Such cases are generally known as
self-excited
vibrations.
They are described as such because the vibration of
the system itself causes the frictional resistance to provide the necessary
energy for sustaining the motion. The frequency of the vibration is therefore
equal to (or close to) the natural frequency of the system. Some of the
common examples of self-excited (or self-sustained) vibrations are the chat-
ter vibration in machine tools and brakes, the vibration of the violin strings
due to the motion of the bow and numerous other examples of mechanical
systems subjected to kinetic friction.
We shall now consider as an illustration the well-known case of a single-
mass system vibrating in a self-excited manner under the influence of kinetic
friction, Fig.
1
1.12.
Assuming that
p
is
the coefficient of kinetic friction, and
N
is the normal force between the mass
m
and the frictional wheel, the
unidirectional frictional force acting on the mass will therefore be equal to
pN.
It is well known that the coefficient of kinetic friction is not
a
constant
value but diminishes slightly as the velocity of relative sliding increases (see
Fig.
1
1.13).
If, due to some slight disturbance, the mass starts
to
vibrate, the
frictional force
pN
will not remain constant but will be larger when the mass
moves in the direction of the tangential velocity
Vo
of the wheel than when it
moves opposite to it.
Assuming that the velocity of the oscillation
i
is much smaller than the
tangential velocity of the frictional wheel, the frictional force
p
N,
which is a
function of the relative velocity
(
Vo
-
X),
will therefore always be in the
direction
of
Vo.
Over a complete cycle of vibration, the frictional force
will therefore produce net positive work on the mass and the amplitude of
its vibration will build up.
In order to study this vibration, the equation of motion can be written
as:
mi
+
ci
+
kx
=
pN
=
(po
+
ai)N
(1
1.4)
438
m
Chapter
I
I
I
Figure
1
1
.12
Frictional drive for self-excited vibration.
Sliding
Velocity
Figure
1
1
.13
Coefficient of kinetic friction.
Friction-Induced Sound and Vibrations
439
where
c
=
coefficient of viscous damping
a
=
slope of the friction curve at
Vo
and can be considered constant
po
=
coefficient of kinetic friction at
Vo
relative velocity
=
for a small
.U
This equation can be rearranged as:
m.f
+
(C
-
aN)i
+
kx
=
N
(1
1.5)
The term
(c
-
aN),
which represents a net damping coefficient, will deter-
mine whether the vibration will be stopped or built up in a self-excited
manner. If
aN
<
c,
the resultant damping term will be positive and the
vibration will decay signifying the stability of the system.
On
the other
hand, if
aN
>
c,
a negative damping term will exist and the vibration will
build up as shown in Fig. 11.14a. The system in this case is unstable.
It is quite clear from the previous example that a quantitative knowl-
edge of the frictional force and damping functions
is
essential for any ana-
lysis of this type of self-excited vibration. Any variation in either function
due to increase in amplitude or velocity of the vibration can have consider-
able effect on the vibration.
11.5.1
The Phase-Plane4 Method
Because frictional forces are usually complex functions which require experi-
mentally obtained information, the phase-plane4 method
of
analysis is
particularly well suited for studies of self-excited vibration
[
101.
Assume that in the previous equation the resultant function
(c
-
aN)
was not a linear function of the velocity but rather
a
complicated function
f(x)
obtained experimentally. The equation of motion is now:
mjl
+f(i)
+
kx
=
puN
(1
1.6)
This equation can be written in the
S
form as:
i
+
U:(,
+
6)
=
0
(I
1.7)
(1
1.8)
440
Chapter
/I
IX
aN*C
Damped Vibration
X
aN=C
Limit
Cycle
Vibration
X
k
Wn
X
Figure
1 1
.14
Dynamic response.
where
aN*C
Setf
-
excited
Vibration
s
=
si.
+
so
1
6.i
=
-
f(i)
k
-1
k
=
-
pu,N
=
constant
Friction-Induced Sound and Vibrations
44
I
and the problem accordingly will transform to a free vibration with a con-
tinuously changing datum. The datum variation
6,
which in this hypothe-
tical case, is a function of the velocity
i
can be obtained at any instant of the
motion in the phase plane from the 6-curve. By successively plotting small
segments of the locus and changing the datum according to the new posi-
tion, the motion can be graphically represented in the phase plane. This
is
shown in Fig. 11.14b, which also shows that the motion is stable when the
vibration decays or a limit cycle is reached. The motion at the limit cycle will
be similar to a free undamped vibration.
Data representing different forms
of
self-excited vibration of the system
shown in Fig. 11.12 are shown in Fig. 11.15. The bearing block of the
frictional wheel is moved on the supporting wedge a predetermined amount
to produce a particular value of static friction. The motion of the block is
indicated by means
of
a dial gage. The driving motor is then run at different
speeds and the resulting vibration of the system is recorded.
It
should be
noted that the frequency of the motion is the same as the natural frequency
of the system and is independent of the motor speed.
This type of vibration develops as a result of the negative slope
of
the
friction-velocity function. This
is
generally the case, with varied degrees in
dry friction. The use of grease lubrication causes the frictional resistance to
increase with sliding speed, giving a positive slope and consequently avoid-
ing the self-excitation.
11.6
PROCEDURE FOR DETERMINATION OF THE FRICTIONAL
PROPERTIES UNDER RECIPROCATING SLIDING MOTION
It has been shown in the previous section that friction-induced self-excited
vibrations and noise are controlled by the functional dependency of kinetic
friction on the relative velocity between the rubbing surfaces. This relation-
ship has to be determined experimentally because it is a function of the
materials in contact, surface roughness, and lubrication condition.
The measurement of the coefficient of friction as a function of sliding
velocity has been the subject of many studies to determine the influence
of
such controlling factors as materials, surface roughness, temperature, and
lubrication condition. Most of the reported experiments utilized the pin-on-
disk tribometer apparatus
[16-191
and different types of transducers were
used to measure the frictional force directly or indirectly. This type
of
experiment is generally associated with excessive vibrations due to the rota-
tion
of
the motor and disk. The irregularities of the disk surface during
rotation can also produce variations
of
the measured coefficient of friction.
442
Figure
11
.15
Examples
of
self-excited
vibration.
Friction-Induced Sound and Vibrations
443
This was observed by Godfrey
[20]
who emphasized the importance of
avoiding external vibrations during friction measurements.
Bell and Burdekin
[
171 utilized acceleration and displacement measure-
ments during one cycle of the friction-induced vibration of slideways to
evaluate the frictional force as a function of the instantaneous velocity.
The force was calculated from the knowledge of the mass, stiffness, and
damping coefficient of the vibrating system by summing the inertia, damp-
ing, and restoring forces at each increment of the friction-induced cycle. In
1970,
KO
and Brockley
[
161 developed a technique for determining the fric-
tion-velocity characteristic by measuring the friction force versus displace-
ment in one cycle of a quasiharmonic friction-induced vibration using a pin-
on-disk apparatus. They reported that their technique proved useful in
reducing the effect of changes of the surface and external vibration.
In 1984, Aronov
[
181 investigated the interaction between friction, wear,
and vibration and their dependence on normal load and system stiffness
using a pin-on-disk apparatus. The friction-induced vibration, which has
been studied by several investigators [16-18, 21, 221, may be classified into
three types: stock-slip, vibration induced by random surface irregularities,
and quasiharmonic oscillation. These three types of vibration have been
observed under certain conditions, which depend on the normal load, sliding
speed, and the nature of the surfaces in contact. Tolstoi [23] was one of the
early investigators of the stick-slip phenomenon where the vibration in the
normal direction to the contact surface is usually of a sawtooth type caused
by changes in the coefficient of friction with the relative sliding velocity. The
vibration usually occurs when the sliding speed is sufficiently
low.
At rela-
tively low values of the normal load, normal vibration is produced due to
the surface irregularities and waviness. When the normal load and the slid-
ing speed are sufficiently high, quasiharmonic oscillations with nearly sinu-
soidal waveforms are produced.
KO
and Brockley [16] attempted to minimize the effect of external
vibration by using a one-cycle sequence triggering circuit and other elec-
tronic devices which permitted the measurement of the kinetic friction force
in the presence of friction-induced vibration. However, the problems asso-
ciated with nonuniformity
of
the disk surface and the reliability of the
measurement continue
to
present challenges to this approach.
Most analytical and experimental studies which are reported in the
literature on friction-induced vibration and friction force measurements
are based on a constant relative sliding speed.
Anand and Soom
[24]
analytically investigated the dynamic effects on
frictional contacts during acceleration from rest to a steady state velocity.
The study by Othman and Seireg [25] presents a procedure for evaluat-
ing the change of frictional force with relative velocity during reciprocating
444
Chapter
I1
sliding motion. It utilizes the friction-induced lateral vibration
of
a rod to
evaluate the parameters of the frictional function using a gradient search
which minimizes the error between the analytical response and the friction-
induced experimental vibrations. The use
of
sinusoidal sliding motion at the
resonant frequencies of the vibrating rod is found to considerably minimize
the effect of external vibrations on the experimental results.
The experimental model used for this purpose (Fig.
1
1.16) consists
of
a
cylindrical steel rod
(A),
which is pressed on a flexible rod (B), by means of a
load
N.
Because the contact area is small, the variations in surface rough-
ness are minimized within the frictional area and a steady-state surface
roughness can be rapidly achieved after few reciprocating cycles. The effect
of
external vibrations on the measurements is also minimized by operating
the reciprocating rod at resonant frequencies of the system.
The dynamic motion of the rod
B
(shown in Fig. 11.16a,b) when sub-
jected to a reciprocating frictional force can be modeled by three degrees
of
freedom representing the translation
x
and
y
at the midspan and the tor-
sional angle
8
about the axis of the rod. By appropriate selection
of
the rod
dimensions each
of
these movements can be represented by an elastically
supported single mass
yzz
because the oscillations can be uncoupled for all
practical purposes.
For small displacements, the governing equations for the motion of the
oscillatory rod
B
can be represented as:
where
,Y
is the coefficient of friction and
yi
is a function describing the
disturbance in the
y
direction resulting from surface waviness. The equa-
tions are essentially uncoupled due to the selection of widely separated
natural frequencies
on,,
wn2,
and
wn3.
It has been shown [I61 that in the case of stick-slip oscillation, the
friction force is time dependent during stick and velocity dependent during
slip, and in the case of a quasiharmonic oscillation, the motion is govenred
by the velocity dependent friction force only.
It is assumed in this study that the friction-velocity relationship is
approximated by an exponential function
of
the following form:
(11.12)
Friction-Induced Sound and Vibrations
445
Rider
Rod
@I
Figure
1 1-1
6
Dynamic model.
where:
U
=
sliding velocity
uo
=
exponential constant
pmax
and
pmin
=
maximum and minimum bound values of the coefficient
of
friction
Both the
x
and
y
accelerations were monitored during the tests and the latter
was found to be consistently negligible in all the performed tests. Because
446
Chapter
I
I
the
-Y
motion is designed to be the most dominant mode
of
oscillation, only
Eq. (1 1.10) is used for evaluating the parameters
of
the Eq. (1 1.12), which
produce the best fit with the experimental results. This is accomplished by
means of a multivariate gradient search to determine the values of
<,
uo,
pmin,
and
pmax,
which minimize the square of deviation between the calcu-
lated and experimental peaks of the acceleration response measured at the
center of the beam.
11.6.1
Experimental Arrangement
The main features of the experimental arrangement are shown in Fig.
11.17 where the two cylindrical steel rods
(A
and
B)
(UNS GlOlOO
CD)
with mutually perpendicular axes are used as a sliding pair. Rod
B
is
0.65m long and 0.0009m in diameter. It is supported at both ends such
that rotation about its axis
is
constrained. Rod
A
is connected to an
electromagnetic exciter (type
B&K
481
1
with a force rating of 310 N)
and acts as the reciprocating rider. The supporting structure and the
rider have natural frequencies far above those of the vibrating rod
B.
A
function generator is used to control the reciprocating motion of rod
A.
The
x
and
y
oscillations of rod
A
are measured by piezoelectric acceler-
ometers, which are fixed at its midspan.
A
standard vibration calibrator
(type
B
&
K
4291) is used to check the measuring instrument. The output
signals are amplified by a conditioning amplifier then fed to a storage
oscilloscope and a real-time spectrum analyzer (type
HP
3582A). A
chart recorder is also used to record the acceleration signals. The normal
load between the rods is controlled by a loading device, which does not
affect the natural frequency of rod
B.
11.6.2
Experimental Results and Computer Search Procedure
The natural frequency
wnz
and the damping ratio of rod
B
are determined
experimentally by impacting the rod in the
x
direction when the load is 20 N.
The system total equivalent vibrating mass is 0.49kg, which includes the
mass of the transducer attached to the rod. The equivalent rod stiffness in
the
x
direction is 7260 N/m. The natural frequency obtained from the peaks
of the response
is
found to be 21
.O
Hz. This value
is
also verified by the real-
time spectrum analyzer. The damping ratio, which is calculated using the
logarithmic decrement method, is found equal to 0.23.
In order to minimize the effect of the external vibration, the recipro-
cating frequencies for the test are selected to be equal to 1/3, 2/3,
1,
and 4/
3
of the natural frequency
on2
of the rod
B.
The dotted curves in Figs
1
1.18a-d are the experimental acceleration responses corresponding to the
Figure
I
1
.17
Experimental
setup.
44
7
I
Acceleration Amplitude
(m/sec2)
Q
P
9
!
0
A
0
0
P
0
I
A
Acceleration
Amplitude
(m/sec2)
~
P
0
U,
8
0
8
0
in
f
_
I
Friction-Induced Sound and Vibrations
449
Theoretical
Experimental
Time
(sec.)
(c)
12.0
2
6.0
U
z
3
6
I
!
O-O
Q
-6.0
,m
a
-1
2.0
Time (sec.)
(a
450
Chapter
II
selected four frequencies. The vibrations were also monitored in the nor-
mal
y
direction and were found to be orders of magnitude lower than
those in the
x
direction.
11.6.3 Evaluation
of
the Frictional Parameters
Equation (1 1.10) is solved numerically with assumed values of
p,,,,
pmin,
{,
and
uo.
A
gradient search technique is utilized with the objective of mini-
mizing the square error of the deviation between the peaks of the theoretical
and experimental acceleration curves as the objective function. The opti-
mum parameters for the considered cases are found to be as follows:
pmax
=
0.1
1,
p,in
=
0.06,
{
=
0.023, and
vo
=
0.8.
The corresponding theo-
retical acceleration waveforms for the different reciprocating frequencies are
shown by solid lines in Figs
1
1.18a-d. The evaluated friction-velocity curve
is shown in Fig. 11.19. Figure 11.20 illustrates the excellent correlation
between the experimental response spectra and the corresponding analytical
results obtained with the optimum parameters. It should be noted that the
same parameters for the frictional function were obtained for the different
frequencies of the reciprocating motion considered in the test.
Although good results were obtained by using an exponential function
for the friction-velocity characteristics and by using the peaks of the
response curve for computing the error function, the same approach can
be used by assuming other functions and minimizing the mean square error
-1.6
-0.8
0.00
0.8
1.6
Relative
Sliding
Velocity
(m/sec)
Figure
1
1
.19
Evaluated frictional coefficient versus sliding velocity.
Friction-Induced Sound and Vibrations
45
I
Q
P
t
c
0
‘0
E
Frequency
(Ht)
Figure
11.20
Comparison between the experimental
(-
-
-)
and theoretical
(-)
response spectrum for
ac
=
7
Hz
(a,/an2
=
1/3).
for the entire response curve. It should be noted that the value of
{
obtained
from the optimization procedure is identical to that obtained from the decay
of the experimental free vibration data.
REFERENCES
1. Jakobsen,
J.,
“On Damping
of
Railway Break Squeal,” Noise Control Eng.
J.,
Sept Oct. 1986, pp. 46-51.
2. Matsuhisa, H., and Sato,
S.,
“Noise from Circular Stone-Sawing Blades and
Theoretical Analysis of their Flexural Vibration,” Noise Control Eng.
J.,
Nov
Dec. 1986, pp. 96-102.
3. Houjoh,
H.,
and Umezawa,
K.,
“The Sound Radiated from Gears,” Trans.
4.
Lyon, R., “Noise Reduction and Machine Diagnostic and Educational
Challenge,” Noise Vibr. Control Wldwide, Sept. 1985, Vol. 16(8), pp. 221-224.
5. Fielding,
B.,
and Skorecki,
J.,
“Identification
of
Mechanical Source of Noise
in
a Diesel Engine; Sound Emitted
from
the Valve Mechanism,” Proc. Inst. Mech.
Engrs, 1966-67, Vol. 181, Part
I
(I), pp. 434446.
6.
Thompson,
J.,
“Acoustic Intensity Measurements for Small Engines,” Noise
Control Eng. J., Sept Oct. 1982, pp. 56-63.
7. Yokoi, M., and Nakai, M.,
“A
Fundamental Study on Frictional Noise,” Bull.
JSME, Sept. 1986, Vol. 52(481), pp. 2463-2471.
JSME, NOV. 1979, Vol. 22(173),
pp.
1665-1671.
452
Chapter
II
8.
9.
10.
1
I.
12.
13.
14.
15.
16.
17.
18.
19.
20.
21
22.
23.
24.
25.
Symmons, G., and McNulty, G., “Acoustic Output from Stick-Slip Friction,”
Wear, Dec.
1986,
Vol.
1
13(
I),
pp.
79-82.
Othman, M.
O.,
Elkholy, A. H., and Seireg, A. A., “Experimental Investigation
of Frictional Noise and Surface-Roughness Characteristics,” Exper. Mech.,
Dec.
1990,
pp.
328-331.
Seireg, A., Mechanical Systems Analysis, International Textbook Co.,
1969,
p.
412.
McCool, J.
I.,
“Relating Profile Instrument Measurements to the Functional
Performance of Rough Surfaces,” Trans. ASME, J. Tribol., April
1987,
Vol.
109,
pp.
264-270.
Greenwood,
J.
A., and Williamson,
J.
B. P., “Contact of Nominally Flat
Surfaces,” Proc. Roy. Soc. Lond. Series A,
1966,
Vol.
295,
pp.
300-319.
Welbourn, D.
B.,
“Fundamental knowledge of gear noise: a survey,“
1979
Conf. Noise and Vibration of Engine Transmissions, Cranfield Institute of
Technology, Institute of Mechanical Engineers.
Attia, A.
Y.,
“Noise of Gears: a Comparative Study,”
1989,
Proc. Int. Power
Transmission and Gearing Conf., Chicago, ASME, Vol.
2,
p.
773.
Aziz,
S.
M. A., and Seireg, A., “A Parametric Study of Frictional Noise in
Gears,” Wear,
1994,
Vol.
176,
pp.
25-28.
KO,
P. L., and Brockley, C. A., “The Measurement of Friction and Friction
Induced Vibration,” ASME J. Lubr. Technol. Trans., Oct.
1970,
pp.
543-549.
Bell, R., and Burdekin, M., “Dynamic Behavior of Plain Slideways,” Proc. Inst.
Mech. Engrs,
1966-1967,
Vol.
181,
Part
1,
No.
8,
pp.
169-184.
Aronov,
V.,
D’Souza, A. F., Kalpakjian,
S.,
and Shareef,
I.,
“Interactions
Among Friction Wear and Systems Stiffness Part
1:
Effect
of
Normal Load
and System Stiffness,” ASME J. Lubr. Tribol., Jan.
1984,
Vol.
106,
pp.
54-58.
Brockley, C. A., and KO. P. L., “Quasi-Harmonic Friction-Induced Vibration,”
ASME J. Lubr. Technol. Trans., Oct.
1970,
pp.
550-556.
Godfrey,
D.,
“Vibration Reduces Metal to Metal Contact and Causes an
Apparent Reduction in Friction,” Trans. ASLE, Apr.
1967,
Vol.
lO(2).
pp.
Earles,
S.
W. E., and Lee, C.
K.,
“Instabilities Arising from the Frictional
Interaction of a Pin-Disk System Resulting in Noise Generation,” J. Eng.
Indust., Feb.
1976,
pp.
81-86.
Aronov,
V.,
D’Souza, A. F., Kalpakjian,
S.,
and Shareef,
I.,
“Interactions
Among Friction, Wear, and System Stiffness
-
Part
2:
Vibrations Induced by
Dry Friction,” ASME J. Tribol. Trans., Jan.
1984,
Vol.
106,
pp.
59-64.
Tolstoi, D. M., “Significance of the Normal Degree of Freedom and Natural
Vibrations in Contact Friction,” Wear,
1967,
Vol.
10,
pp.
193-213.
Anand, A., and Soom,
A.,
“Roughness-Induced Transient Loading at a Sliding
Contact During Start-up,” ASME J. Tribol., Jan.
1984,
Vol.
106,
pp.
49-53.
Othman, M.
O.,
and Seireg, A., “A Procedure for Evaluating the Frictional
Properties of Hertzian Contacts under Reciprocating Sliding Motion,” Trans.
ASME, J. Tribol.,
1990,
Vol.
112,
pp.
361-364.
1
83- 192.
12
Surface
Coating
12.1
INTRODUCTION
In tribological systems, the load transfer, relative movement, wear, corro-
sion, and fatigue damage initiation occur at the surface. Advances in surface
coating technology can therefore have considerable impact on improving
the performance of such systems and extending their useful life.
The coated layer can be an adsorbed
film
of the lubricant or a chemical
layer formed by the reaction of the materials to the environment.
It
can also
be induced by surface treatment processes which have been known for
centuries such as cold working, carburizing, and induction hardening.
The other basic type of surface modification is surface coating. Until
recently, coatings were used exclusively as a corrosion inhibitor. Today,
engineered coatings can resist abrasive wear, change the friction coefficient,
act as a thermal barrier or conductor, and resist corrosion.
12.2
COATING PROCESSES
The methods by which surfaces are coated with thin films are often divided
into two groups:
1.
2.
Hot processes or chemical vapor deposition
(CVD)
Cold processes or physical vapor deposition
(PVD)
Coating properties such as microstructure, substrate adhesion, and wear or
abrasion resistance depend on the coating process.
453
4.54
Chapter
12
12.2.1
Chemical Vapor Deposition
Commercially available CVD hard coatings for tooling include titanium
carbide, hafnium carbide and nitride, and aluminum oxide. All of the coat-
ings are applied to a thickness in the range
5-9
pm, generally dictated by the
operational requirements for the coated surfaces.
The driving force of the process is the high temperature, typically in the
range 1750-195OoF, to which the work pieces are heated, which causes the
reactive gases to dissociate and the desired coating compound to form on
the work piece surfaces. For example, titanium tetahcloride (TiC14) would
be the reactive gas introduced to provide the titanium and pure nitrogen gas
(N2) or ammonia
(NH,)
would supply the nitrogen to form a TIN coating.
Hydrogen chloride gas (HC1) is also formed in this reaction and must be
neutralized for safe removal.
Chemical reactions that take place are given below:
2TiC14
+
4H2
+
N2
+
2TiN
+
8HC1
Or in the case of TIC coating:
TiCI,
+
CH4
+
Tic
+
4HCl
Similarly if A1203 is deposited, the gas mixture would consist
of
AIC13
(aluminum chloride),
H2
and CO2:
2AlC13
+
3CO2
+
3H2
+
A1203
+
3CO
+
6HC1
Important parameters influencing the deposition rate, composition, and
structure of the coatings are:
Temperature
Composition of the gas atmosphere
Flow rate of the gas in the coating chamber
Coating time
Due to high coating temperatures, steel parts must be heat treated after
coating.
It
is important that only components which have sufficient dimen-
sional tolerances be coated. In general, parts with tolerance of 0.001 in.
make excellent candidates for CVD coatings.
The CVD process is most commonly used for the coating of very large
quantities of cemented carbide tools. With respect to equipment for produc-
tion processes, some additional requirements must be fulfilled, such as large
number of components coated in one run with a uniform coating thickness,
a minimum rejection rate as a result of the high degree of reproducibility