Handbook of Corrosion Engineering Episode 1 Part 8 potx
Bạn đang xem bản rút gọn của tài liệu. Xem và tải ngay bản đầy đủ của tài liệu tại đây (351.65 KB, 40 trang )
S ϭ S
0
(298.15)
ϩ
͵
T
298.15
dT ϩ
Α
(3.5)
C
p
ϭ A ϩ B 10
Ϫ3
T ϩ C 10
5
T
Ϫ2
ϩ D 10
Ϫ6
T
2
(3.6)
The free energy (G) for each species considered was then calculated
with Eq. (3.7) and used to evaluate the stability of these species and
the predicted energy of reaction for each equilibrium (Table 3.4).
G ϭ H Ϫ TS (3.7)
Vapor pressures of species at equilibrium with either the metal or its
most stable oxide (i.e., Cr
2
O
3
) must then be determined. The boundary
between these regions is the oxygen pressure for the Cr/Cr
2
O
3
equilib-
rium expressed in Eq. (3.8).
2Cr
(s)
ϩ 1.5O
2(g)
ϭ Cr
2
O
3(s)
(3.8)
for which the equilibrium constant (K
p
) is evaluated with Eq. (3.9), giv-
ing an equilibrium pressure of oxygen calculated with Eq. (3.10).
Log K
p
ϭ (3.9)
Log(p
O
2
) ϭϪ Log K
p
Cr
2
O
3
ϭϪ17.90 (3.10)
The dotted vertical line in Fig. 3.2 represents this boundary. At low
oxygen pressure it can be seen that the presence of Cr
(g)
is independent
of oxygen pressure. For oxygen pressures greater than the Cr/Cr
2
O
3
equilibrium, the Cr
(g)
vapor pressure may be obtained from the equi-
librium expressed in Eq. (3.11).
0.5Cr
2
O
3(s)
ϭ Cr
(g)
ϩ 0.75O
2(g)
(3.11)
2
ᎏ
3
Ϫ⌬G
0
ᎏᎏ
2.303RT
H
tr
ᎏ
T
tr
Cp
ᎏ
T
228 Chapter Three
TABLE 3.3 Thermochemical Data for the Cr-O System at 1473 K
Species State H, kJиmol
Ϫ1
S, Jиmol
Ϫ1
иK
Ϫ1
G, kJиmol
Ϫ1
Cr Gas 422.02 207.58 116.25
Cr Solid 36.97 70.78 Ϫ67.29
Cr
2
O
3
Solid Ϫ993.71 276.68 Ϫ1401.27
CrO Gas 230.37 295.28 Ϫ204.57
CrO
2
Gas Ϫ12.73 351.72 Ϫ530.81
CrO
3
Gas Ϫ204.60 381.78 Ϫ766.96
O
2
Gas 39.67 257.73 Ϫ339.97
0765162_Ch03_Roberge 9/1/99 4:27 Page 228
The other lines in Fig. 3.2 are obtained by using similar equilibrium
equations (Table 3.4). The vapor equilibria presented in Fig. 3.2 show
that significant Cr
(g)
vapor pressures are developed at low-oxygen par-
tial pressure (e.g., at the alloy-scale interface of a Cr
2
O
3
-forming alloy)
but that a much larger pressure of CrO
3(g)
develops at high-oxygen par-
tial pressure. This high CrO
3(g)
pressure is responsible for the thinning
of Cr
2
O
3
scales by vapor losses during exposure to oxygen-rich environ-
ments.
3.1.3 Two-dimensional isothermal stability
diagrams
When a metal reacts with a gas containing more than one oxidant, a
number of different phases may form depending on both thermodynam-
ic and kinetic considerations. Isothermal stability diagrams, usually
constructed with the logarithmic values of the activities or partial pres-
sures of the two nonmetallic components as the coordinate axes, are use-
ful in interpreting the condensed phases that can form. The
metal-sulfur-oxygen stability diagrams for iron, nickel, cobalt, and
chromium are shown in Figs. 3.3 to 3.6. One important assumption in
these diagrams is that all condensed species are at unit activity. This
assumption places important limitations on the use of the diagrams for
alloy systems.
3.2 Kinetic Principles
The first step in high-temperature oxidation is the adsorption of oxygen
on the surface of the metal, followed by oxide nucleation and the growth
High-Temperature Corrosion 229
TABLE 3.4 Standard Energy of Reactions for the Cr-O
System at 1473 K
Reaction ⌬G
0
, kJиmol
Ϫ1
2 Cr
(s)
ϩ 1.5 O
2
ϭ Cr
2
O
3
Ϫ756.72
Over Cr
(s)
Cr
(s)
ϭ Cr
(g)
183.54
Cr
(s)
ϩ 0.5 O
2
ϭ CrO
(g)
32.71
Cr
(s)
ϩ O
2
ϭ CrO
2(g)
Ϫ123.54
Cr
(s)
ϩ 1.5 O
2
ϭ CrO
3(g)
Ϫ189.71
Over Cr
2
O
3
0.5 Cr
2
O
3(s)
ϭ Cr
(g)
ϩ 0.75 O
2
561.90
0.5 Cr
2
O
3(s)
ϭ CrO
(g)
ϩ 0.25 O
2
411.07
0.5 Cr
2
O
3(s)
ϩ 0.25 O
2
ϭ CrO
2(g)
254.81
0.5 Cr
2
O
3(s)
ϩ 0.75 O
2
ϭ CrO
3(g)
188.65
0765162_Ch03_Roberge 9/1/99 4:27 Page 229
230 Chapter Three
Ni
NiO
NiS
NiS
2
Ni
3
S
2
Ni
3
S
4
NiSO
4
Log pO
2
10-50 -30 -20 -10 0-40
Log pS
2(g)
0
-40
-30
-20
-10
Figure 3.4 Stability diagram of the Ni-S-O system at 870°C.
Log pO
2
Log pS
2(g)
Fe
Fe
0.95
O
Fe
2
O
3
Fe
3
O
4
FeS
1+x
FeS
2
FeSO
4
Fe
2
(SO
4
)
3
10-50
0
-30 -20 -10 0-40
-40
-30
-20
-10
Figure 3.3 Stability diagram of the Fe-S-O system at 870°C.
0765162_Ch03_Roberge 9/1/99 4:27 Page 230
High-Temperature Corrosion 231
Co
CoO
Co
3
O
4
Co
3
S
4
CoSO
4
Log pO
2
10-50 -30 -20 -10 0-40
Log pS
2(g)
0
-40
-30
-20
-10
Figure 3.5 Stability diagram of the Co-S-O system at 870°C.
Cr
CrO
2
Cr
2
O
3
CrS
Cr
2
S
3
Cr
2
(SO
4
)
3
Log pO
2
10-50 -30 -20 -10 0-40
Log pS
2(g)
0
-40
-30
-20
-10
Figure 3.6 Stability diagram of the Cr-S-O system at 870°C.
0765162_Ch03_Roberge 9/1/99 4:27 Page 231
of the oxide nuclei into a continuous oxide film covering the metal
substrate. Defects, such as microcracks, macrocracks, and porosity may
develop in the film as it thickens. Such defects tend to render an oxide
film nonprotective, because, in their presence, oxygen can easily reach
the metal substrate to cause further oxidation.
3.2.1 The Pilling-Bedworth relationship
The volume of the oxide formed, relative to the volume of the metal
consumed, is an important parameter in predicting the degree of pro-
tection provided by the oxide scale. If the oxide volume is relatively
low, tensile stresses can crack the oxide layers. Oxides, essentially rep-
resenting brittle ceramics, are particularly susceptible to fracture and
cracking under such tensile stresses. If the oxide volume is very high,
stresses will be set up that can lead to a break in the adhesion between
the metal and oxide. For a high degree of protection, it can thus be
argued that the volume of the oxide formed should be similar to that
of the metal consumed. This argument is the basis for the Pilling-
Bedworth ratio:
PB ϭϭ
where W ϭ molecular weight of oxide
D ϭ density of the oxide
n ϭ number of metal atoms in the oxide molecule
d ϭ density of the metal
w ϭ atomic weight of the metal
PB ratios slightly greater than 1 could be expected to indicate “opti-
mal” protection, with modest compressive stresses generated in the
oxide layer. Table 3.5 provides the PB ratio of a few metal/oxide sys-
tems.
4
In practice, it has been found that PB ratios are generally poor
predictors of the actual protective properties of scales. Some of the rea-
sons advanced for deviations from the PB rule include
8
■
Some oxides actually grow at the oxide-air interface, as opposed to
the metal-oxide interface.
■
Specimen and component geometries can affect the stress distribu-
tion in the oxide films.
■
Continuous oxide films are observed even if PB Ͻ 1.
■
Cracks and fissures in oxide layers can be “self-healing” as oxidation
progresses.
■
Oxide porosity is not accurately predicted by the PB parameter.
Wd
ᎏ
nDw
volume of oxide produced
ᎏᎏᎏᎏ
volume of metal consumed
232 Chapter Three
0765162_Ch03_Roberge 9/1/99 4:27 Page 232
■
Oxides may be highly volatile at high temperatures, leading to non-
protective properties, even if predicted otherwise by the PB parameter.
3.2.2 Micromechanisms and rate laws
Oxide microstructures.
On the submolecular level, metal oxides con-
tain defects, in the sense that their composition deviates from their
ideal stoichiometric chemical formulas. By nature of the defects
found in their ionic lattices, they can be subdivided into three cate-
gories:
8
A p-type metal-deficit oxide contains metal cation vacancies. Cations
diffuse in the lattice by exchange with these vacancies. Charge neu-
trality in the lattice is maintained by the presence of electron holes
or metal cations of higher than average positive charge. Current is
passed by positively charged electron holes.
An n-type cation interstitial metal-excess oxide contains interstitial
cations, in addition to the cations in the crystal lattice. Charge neu-
trality is established through an excess of negative conduction elec-
trons, which provide for electrical conductivity.
An n-type anion vacancy oxide contains oxygen anion vacancies in
the crystal lattice. Current is passed by electrons, which are present
in excess to establish charge neutrality.
High-Temperature Corrosion 233
TABLE 3.5 Oxide-Metal Volume
Ratios of Some Common Metals
Oxide/metal
Oxide volume ratio
K
2
O 0.45
MgO 0.81
Na
2
O 0.97
Al
2
O
3
1.28
ThO
2
1.30
ZrO
2
1.56
Cu
2
O 1.64
NiO 1.65
FeO (on ␣-Fe) 1.68
TiO
2
1.70–1.78
CoO 1.86
Cr
2
O
3
2.07
Fe
3
O
4
(on ␣-Fe) 2.10
Fe
2
O
3
(on ␣-Fe) 2.14
Ta
2
O
5
2.50
Nb
2
O
5
2.68
V
2
O
5
3.19
WoO
3
3.30
0765162_Ch03_Roberge 9/1/99 4:27 Page 233
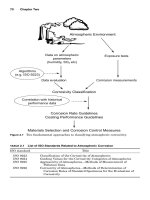
Electrochemical nature of oxidation reactions. High-temperature oxida-
tion reactions proceed by an electrochemical mechanism, with some
similarities to aqueous corrosion. For example, the reaction
M ϩ
1
ր
2
O
2
→ MO
proceeds by two basic separate reactions:
M → M
2ϩ
ϩ 2e
Ϫ
(anodic reaction)
and
1
ր
2
O
2
ϩ 2e
Ϫ
→ O
2Ϫ
(cathodic reaction)
The growth of an n-type cation interstitial oxide at the oxide-gas
interface is illustrated in Fig. 3.7. Interstitial metal cations are liber-
ated at the metal-oxide interface and migrate through the interstices
of the oxide to the oxide-gas interface. Conduction band electrons also
migrate to the oxide-gas interface, where oxide growth takes place. For
the n-type anion vacancy oxide, film growth tends to occur at the met-
al-oxide interface, as shown in Fig. 3.8. Conduction band electrons
migrate to the oxide-gas interface, where the cathodic reaction occurs.
The oxygen anions produced at this interface migrate through the
oxide lattice by exchange with anion vacancies. The metal cations are
provided by the anodic reaction at the metal-oxide interface.
In the case of the p-type metal deficit oxides, metal cations produced
by the anodic reaction at the metal-oxide interface migrate to the
oxide-gas interface by exchange with cation vacancies. Electron charge
is effectively transferred to the oxide-gas interface by the movement of
electron holes in the opposite direction (toward the metal-oxide inter-
face). The cathodic reaction and oxide growth thus tend to occur at the
oxide-gas interface (Fig. 3.9).
The important influence of the diffusion of defects (excess cations,
cation vacancies, or anion vacancies) through the oxide film on oxida-
tion rates should be apparent from Figs. 3.7 to 3.9. Conduction elec-
trons (or electron holes) are much more mobile compared to these
larger defects and therefore are not important in controlling the reac-
tion rates. For example, if nickel oxide (NiO) is considered as a p-type
metal deficient oxide, the oxidation rate of nickel depends on the dif-
fusion rate of cation vacancies. If this oxide is doped with Cr
3ϩ
impu-
rity ions, the number of cation vacancies increases to maintain charge
neutrality. A higher oxidation rate is thus to be expected in the pres-
ence of these impurities. By this mechanism, a nickel alloy containing
a few percentages of chromium does indeed oxidize more rapidly than
pure nickel.
9
From these considerations, a clearer picture of require-
234 Chapter Three
0765162_Ch03_Roberge 9/1/99 4:27 Page 234
ments for protective oxides has emerged. Oxide film properties impart-
ing high degrees of protection include
■
Good film adherence to the metal substrate
■
High melting point
■
Resistance to evaporation (low vapor pressure)
High-Temperature Corrosion 235
Metal Substrate
Oxide
Gas
M
2+
M M
2+
+ 2e
-
1/2O
2
+ 2e
-
O
2-
O
2-
+ M
2+
MO
e
-
Figure 3.7 Schematic description of the growth of a cation interstitial n-type oxide occur-
ring at an oxide-gas interface.
Metal Substrate
Oxide
Gas
O
2-
M M
2+
+ 2e
-
1/2O
2
+ 2e
-
O
2-
O
2-
+ M
2+
MO
e
-
anion
vacancies
Figure 3.8 Film growth of an n-type anion vacancy oxide occurring at a metal-oxide
interface.
0765162_Ch03_Roberge 9/1/99 4:27 Page 235
■
Thermal expansion coefficient similar to that of the metal
■
High temperature plasticity
■
Low electrical conductivity
■
Low diffusion coefficients for metal cations and oxygen anions
Basic kinetic models. Three basic kinetic laws have been used to char-
acterize the oxidation rates of pure metals. It is important to bear in
mind that these laws are based on relatively simple oxidation models.
Practical oxidation problems usually involve alloys and considerably
more complicated oxidation mechanisms and scale properties than
considered in these simple analyses.
Parabolic rate law. The parabolic rate law [Eq. (3.12)] assumes that the
diffusion of metal cations or oxygen anions is the rate controlling step
and is derived from Fick’s first law of diffusion. The concentrations of
diffusing species at the oxide-metal and oxide-gas interfaces are
assumed to be constant. The diffusivity of the oxide layer is also
assumed to be invariant. This assumption implies that the oxide layer
has to be uniform, continuous, and of the single phase type. Strictly
speaking, even for pure metals, this assumption is rarely valid. The
rate constant, k
p
, changes with temperature according to an
Arrhenius-type relationship.
x
2
ϭ k
p
t ϩ x
0
(3.12)
where x = oxide film thickness (or mass gain due to oxidation, which
is proportional to oxide film thickness)
236 Chapter Three
Metal Substrate
Oxide
Gas
M
2+
M M
2+
+ 2e
-
1/2O
2
+ 2e
-
O
2-
O
2-
+ M
2+
MO
e
-
M
2+
M
3+
+ e
-
M
3+
+ e
-
M
2+
electron
holes
cation
vacancies
Figure 3.9 Schematic description of a cathodic reaction and oxide growth occurring at
the oxide-gas interface.
0765162_Ch03_Roberge 9/1/99 4:27 Page 236
t = time
k
p
= the rate constant (directly proportional to diffusivity of ionic
species that is rate controlling)
x
0
= constant
Logarithmic rate law. The logarithmic rate law [Eq. (3.13)] is a following
empirical relationship, which has no fundamental underlying mecha-
nism. This law is mainly applicable to thin oxide layers formed at rel-
atively low temperatures and therefore is rarely applicable to
high-temperature engineering problems.
x ϭ k
e
log(ct ϩ b) (3.13)
where k
e
ϭ rate constant and c and b are constants.
Linear rate law and catastrophic oxidation. The linear rate law [Eq. (3.14)] is
also an empirical relationship that is applicable to the formation and
buildup of a nonprotective oxide layer:
x ϭ k
L
t (3.14)
where k
L
ϭ rate constant.
It is usually to be expected that the oxidation rate will decrease with
time (parabolic behavior), due to an increasing oxide thickness acting
as a stronger diffusion barrier with time. In the linear rate law, this
effect is not applicable, due to the formation of highly porous, poorly
adherent, or cracked nonprotective oxide layers. Clearly, the linear
rate law is highly undesirable.
Metals with linear oxidation kinetics at a certain temperature have
a tendency to undergo so-called catastrophic oxidation (also referred
to as breakaway corrosion) at higher temperatures. In this case, a
rapid exothermic reaction occurs on the surface, which increases the
surface temperature and the reaction rate even further. Metals that
may undergo extremely rapid catastrophic oxidation include molyb-
denum, tungsten, osmium, rhenium, and vanadium, associated with
volatile oxide formation.
9
In the case of magnesium, ignition of the
metal may even occur. The formation of low-melting-point oxidation
products (eutectics) on the surface has also been associated with cat-
astrophic oxidation. The presence of vanadium and lead oxide
contamination in gases deserves special mention because they pose a
risk to inducing extremely high oxidation rates.
3.3 Practical High-Temperature Corrosion
Problems
The oxidation rate laws described above are simple models derived from
the behavior of pure metals. In contrast, practical high-temperature cor-
rosion problems are much more complex and involve the use of alloys.
For practical problems, both the corrosive environment and the high-
High-Temperature Corrosion 237
0765162_Ch03_Roberge 9/1/99 4:27 Page 237
temperature corrosion mechanism(s) have to be understood. In the
introduction, it was pointed out that several high-temperature corrosion
mechanisms exist. Although considerable data is available from the lit-
erature for high-temperature corrosion in air and low-sulfur flue gases
and for some other common refinery and petrochemical environments,
small variations in the composition of a process stream or in operating
conditions can cause markedly different corrosion rates. Therefore, the
most reliable basis for material selection is operating experience from
similar plants and environments or from pilot plant evaluation.
10
There are several ways of measuring the extent of high-temperature
corrosion attack. Measurement of weight change per unit area in a
given time has been a popular procedure. However, the weight
change/area information is not directly related to the thickness (pene-
tration) of corroded metal, which is often needed in assessing the
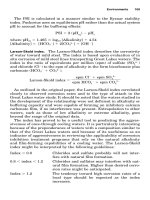
strength of equipment components. Corrosion is best reported in pene-
tration units, which indicate the sound metal loss. A metallographic
technique to determine with relative precision the extent of damage is
illustrated in Fig. 3.10.
11
The parameters shown in Fig. 3.10 relate to
cylindrical specimens and provide information about the load-bearing
section (metal loss) and on the extent of grain boundary attack that can
also affect structural integrity.
When considering specific alloys for high-temperature service, it is
imperative to consider other properties besides the corrosion resis-
tance. It would be futile, for example, to select a stainless steel with
high-corrosion resistance for an application in which strength require-
ments could not be met. In general, austenitic stainless steels are sub-
stantially stronger than ferritic stainless steels at high temperatures,
as indicated by a comparison of stress rupture properties (Fig. 3.11)
and creep properties (Fig. 3.12).
11
The various high-temperature cor-
rosion mechanisms introduced earlier are described in more detail in
the following sections. The common names for the alloys mentioned in
these sections are listed in Table 3.6 with their Unified Numbering
System (UNS) alloy number, when available, and their generic type.
The composition of these alloys can be found in App. E.
3.3.1 Oxidation
Oxidation is generally described as the most commonly encountered
form of high-temperature corrosion. However, the oxidation process
itself is not always detrimental. In fact, most corrosion and heat-
resistant alloys rely on the formation of an oxide film to provide corro-
sion resistance. Chromium oxide (Cr
2
O
3
, chromia) is the most common
of such films. In many industrial corrosion problems, oxidation does not
occur in isolation; rather a combination of high-temperature corrosion
238 Chapter Three
0765162_Ch03_Roberge 9/1/99 4:27 Page 238
mechanisms causes material degradation when contaminants (sulfur,
chlorine, vanadium, etc.) are present in the atmosphere. Strictly speak-
ing, the oxidation process is only applicable to uncontaminated air and
clean combustion atmospheres.
For a given material, the operating temperature assumes a critical
role in determining the oxidation rate. As temperature is increased, the
rate of oxidation also increases. Sedriks has pointed out important dif-
ferences in temperature limits between intermittent and continuous
service.
11
It has been argued that thermal cycling in the former causes
cracking and spalling damage in protective oxide scales, resulting in
lower allowable operating temperatures. Some alloys’ behavior
(austenitic stainless steels) follows this argument, whereas others (fer-
ritic stainless steels) actually behave in the opposite manner.
11
Increased chromium content is the most common way of improving oxi-
dation resistance.
High-Temperature Corrosion 239
D
D
2
= diameter of metal unaffected by intergranular attack
D
1
Intergranular
attack
D
1
= diameter of apparently useful metal
D
2
D = original diameter
Massive
attack
Figure 3.10 Metallographic method of measuring hot corrosion attack.
0765162_Ch03_Roberge 9/1/99 4:27 Page 239
Apart from chromium, alloying additions used to enhance oxidation
resistance include aluminum, silicon, nickel, and some of the rare
earth metals. For oxidation resistance above 1200°C, alloys that rely
on protective Al
2
O
3
(alumina) scale formation are to be preferred over
those forming chromia.
12
Increasing the nickel content of the
austenitic stainless steels up to about 30%, can have a strong benefi-
cial synergistic effect with chromium.
Fundamental metallurgical considerations impose limits on the
amount of alloying additions that can be made in the design of engi-
neering alloys. Apart from oxidation resistance, the mechanical prop-
240 Chapter Three
850
Stress (MPa)
150
650 750
Temperature (
o
C)
550
50
100
Ferritic
Austenitic
Figure 3.11 Ranges of rupture strength (rupture in 10,000 h) for typical fer-
ritic and austenitic stainless steels.
0765162_Ch03_Roberge 9/1/99 4:27 Page 240
erties must be considered together with processing and manufacturing
characteristics. Metallurgical phases that can result in severe embrit-
tlement (such as sigma, Laves, and Chi phases) tend to form in highly
alloyed materials during high-temperature exposure. In the presence
of embrittling metallurgical phases, the ductility and toughness at
room temperature are extremely poor. A practical example of such
problems involves the collapse of the internal heat-resisting lining of a
cement kiln. Few commercial alloys contain more than 30% chromium.
Silicon is usually limited to 2% and aluminum to less than 4% in
wrought alloys. Yttrium, cerium, and the other rare earth elements
are usually added only as a fraction of a percent.
10
High-Temperature Corrosion 241
Stress (MPa)
200
50
100
800600 700
Temperature (
o
C)
400
Ferritic
Austenitic
150
500
Figure 3.12 Ranges of creep strength (1% in 10,000 h) for typical ferritic and
austenitic stainless steels.
0765162_Ch03_Roberge 9/1/99 4:27 Page 241
242 Chapter Three
TABLE 3.6 Common Names and UNS Alloy Number of Alloys Used in High-
Temperature Applications (Compositions Given in App. E)
Common name UNS alloy number Generic family
6 R30016 Ni-, Ni-Fe-, Co-base alloy
25 R30605 Ni-, Ni-Fe-, Co-base alloy
188 R30188 Ni-, Ni-Fe-, Co-base alloy
214 N07214 Ni-, Ni-Fe-, Co-base alloy
230 N06230 Ni-, Ni-Fe-, Co-base alloy
263 N07041 Ni-, Ni-Fe-, Co-base alloy
304 S30400 Austenitic stainless steel
310 S31000 Austenitic stainless steel
316 S31600 Austenitic stainless steel
330 S33000 Austenitic stainless steel
333 N06333 Ni-, Ni-Fe-, Co-base alloy
410 S41000 Martensitic stainless steel
430 S43000 Ferritic stainless steel
446 S44600 Ferritic stainless steel
556 R30556 Ni-, Ni-Fe-, Co-base alloy
600 N06600 Ni-, Ni-Fe-, Co-base alloy
601 N06601 Ni-, Ni-Fe-, Co-base alloy
617 N06617 Ni-, Ni-Fe-, Co-base alloy
625 N06625 Ni-, Ni-Fe-, Co-base alloy
718 N07718 Ni-, Ni-Fe-, Co-base alloy
825 N08825 Ni-, Ni-Fe-, Co-base alloy
2205 S31803 Duplex stainless steellex
1Cr-0.5Mo K11597 Steel
2.25Cr-1Mo K21590 Steel
253 MA S30815 Austenitic stainless steel
5Cr-0.5Mo K41545 Steel
6B R30016 Ni-, Ni-Fe-, Co-base alloy
800 H N08810 Ni-, Ni-Fe-, Co-base alloy
9Cr-1Mo S50400 Steel
ACI HK J94224 Cast SS
Alloy 150(UMCo-50) Ni-, Ni-Fe-, Co-base alloy
Alloy HR-120 Ni-, Ni-Fe-, Co-base alloy
Alloy HR-160 Ni-, Ni-Fe-, Co-base alloy
Carbon Steel G10200 Steel
Copper C11000 Copper
Incoloy DS Ni-, Ni-Fe-, Co-base alloy
Incoloy 801 Ni-, Ni-Fe-, Co-base alloy
Incoloy 803 Ni-, Ni-Fe-, Co-base alloy
Inconel 602 Ni-, Ni-Fe-, Co-base alloy
Inconel 671 Ni-, Ni-Fe-, Co-base alloy
Multimet R30155 Ni-, Ni-Fe-, Co-base alloy
Nickel N02270 Ni-, Ni-Fe-, Co-base alloy
René 41 Ni-, Ni-Fe-, Co-base alloy
RA330 N08330 Ni-, Ni-Fe-, Co-base alloy
S N06635 Ni-, Ni-Fe-, Co-base alloy
Waspaloy Ni-, Ni-Fe-, Co-base alloy
X N06002 Ni-, Ni-Fe-, Co-base alloy
0765162_Ch03_Roberge 9/1/99 4:27 Page 242
An interesting approach to circumvent the above problems of bulk
alloying is the use of surface alloying. In this approach, a highly
alloyed (and highly oxidation resistant) surface layer is produced,
whereas the substrate has a conventional composition and metallurgi-
cal properties. Bayer has described the formation of a surface alloy
High-Temperature Corrosion 243
0.01
0.1
1
10
100
0.001 0.01 0.1 1
Penetration (mm)
Carbon steel
Nickel
Alloy 617
S31000
S30400
Alloy 800 H
S41000
9Cr 1 Mo
PO
2
(atma)
Figure 3.13 Effect of oxygen partial pressure upon metal penetration of some common
alloys by oxidation after exposure for 1 year at 930°C.
0765162_Ch03_Roberge 9/1/99 4:27 Page 243
containing as much as 50% aluminum, by using a pack cementation
vapor aluminum diffusion process.
13
The vapor aluminum-diffused
surface layer is hard and brittle, but the bulk substrate retains the
properties of conventional steels.
Extensive testing of alloys has shown that many alloys establish
parabolic time dependence after a minimum time of 1000 h in air at tem-
244 Chapter Three
0.001
0.01
0.1
1
10
550 600 650 700 750 800 850 900 950 1000 1050
Temperature (°C)
Penetration (mm)
Carbon steel
9Cr 1 Mo
Nickel
S41000
S31000
Alloy 800 H
Alloy 617
S30400
Figure 3.14 Effect of temperature upon metal penetration of some common alloys by oxi-
dation after exposure for 1 year to air.
0765162_Ch03_Roberge 9/1/99 4:27 Page 244
peratures above 900°C. If the surface corrosion product (scale) is
removed or cracked so that the underlying metal is exposed to the gas,
the rate of oxidation is faster. The influence of O
2
partial pressure on oxi-
dation above 900°C is specific to each alloy, as illustrated for some com-
mon alloys in Fig. 3.13. Most alloys do not show a strong influence of the
O
2
concentration upon the total penetration. Alloys such as Alloy HR-
120, and Alloy 214 even exhibit slower oxidation rates as the O
2
concen-
tration increases. These alloys are rich in Cr or Al, whose oxides are
stabilized by increasing O
2
levels. Alloys, which generally exhibit
increased oxidation rates as the O
2
concentration increase, are S30400,
S41000, and S44600 stainless steels and 9Cr-1Mo, Incoloy DS, alloys
617, and 253MA. These alloys tend to form poor oxide scales.
2
Most alloys tend to have increasing penetration rates with increas-
ing temperature for all oxygen concentrations. Some exceptions are
alloys with 1 to 4% Al such as alloy 214. These alloys require higher
temperatures to form Al
2
O
3
as the dominant surface oxide, which
grows more slowly than the Cr
2
O
3
that dominates at lower tempera-
tures. Figure 3.14 summarizes oxidation after 1 year for some common
alloys exposed to air.
2
The alloy composition can influence metal penetration occurring by
subsurface oxidation along grain boundaries and within the alloy
grains, as schematically shown in Fig. 3.15.
2
Most of the commercial
heat-resistant alloys are based upon combinations of Fe-Ni-Cr. These
alloys show about 80 to 95% of the total penetration as subsurface oxi-
dation. Some alloys change in how much of the total penetration
occurs by subsurface oxidation as time passes, until long-term behav-
ior is established, even though the corrosion product morphologies
may remain constant. Alloys vary greatly in the extent of surface scal-
ing and subsurface oxidation. Tests were conducted in flowing air at
980, 1095, 1150, and 1250°C for 1008 h. The results of these tests, in
terms of metal loss and average metal affected (metal loss and inter-
nal penetration), are presented in Table 3.7.
1
3.3.2 Sulfidation
Sulfidation is a common high-temperature corrosion-failure mecha-
nism. As the name implies, it is related to the presence of contamination
by sulfur compounds. When examining this form of damage microscop-
ically, a “front” of sulfidation is often seen to penetrate into the affected
alloy. Localized pitting-type attack is also possible. A distinction can be
made between sulfidation in gaseous environments and corrosion in the
presence of salt deposits on corroding surfaces. Only the former is con-
sidered in this section; the latter is included in the section on salt and
ash deposit corrosion. Lai has divided gaseous environments associated
with sulfidation into the following three categories:
12
High-Temperature Corrosion 245
0765162_Ch03_Roberge 9/1/99 4:27 Page 245
TABLE 3.7 Results of 1008-h Static Oxidation Tests on Iron, Nickel, and Cobalt Alloys in Flowing Air at
Different Temperatures
Temperature, °C
980 1095 1150 1250
Loss, Affected, Loss, Affected, Loss, Affected, Loss, Affected,
Alloy mm mm mm mm mm mm mm mm
214 0.0025 0.005 0.0025 0.0025 0.005 0.0075 0.005 0.018
601 0.013 0.033 0.03 0.067 0.061 0.135 0.11 0.19
600 0.0075 0.023 0.028 0.041 0.043 0.074 0.13 0.21
230 0.0075 0.018 0.013 0.033 0.058 0.086 0.11 0.20
S 0.005 0.013 3.01 0.033 0.025 0.043 Ͼ 0.81 Ͼ 0.81
617 0.0075 0.033 3.015 0.046 0.028 0.086 0.27 0.32
333 0.0075 0.025 0.025 0.058 0.05 0.1 0.18 0.45
X 0.0075 0.023 0.038 0.069 0.11 0.147 Ͼ 0.9 Ͼ 0.9
671 0.0229 0.043 0.038 0.061 0.066 0.099 0.086 0.42
625 0.0075 0.018 0.084 0.12 0.41 0.46 Ͼ 1.2 Ͼ 1.2
Waspaloy 0.0152 0.079 0.036 0.14 0.079 0.33 Ͼ 0.40 Ͼ 0.40
R-41 0.0178 0.122 0.086 0.30 0.21 0.44 Ͼ 0.73 Ͼ 0.73
263 0.0178 0.145 0.089 0.36 0.18 0.41 Ͼ 0.91 Ͼ 0.91
188 0.005 0.015 0.01 0.033 0.18 0.2 Ͼ 0.55 Ͼ 0.55
25 0.01 0.018 0.23 0.26 0.43 0.49 Ͼ 0.96 Ͼ 0.96
150 0.01 0.025 0.058 0.097 Ͼ 0.68 Ͼ 0.68 Ͼ 1.17 Ͼ 1.17
6B 0.01 0.025 0.35 0.39 Ͼ 0.94 Ͼ 0.94 Ͼ 0.94 Ͼ 0.94
556 0.01 0.028 0.025 0.067 0.24 0.29 Ͼ 3.8 Ͼ 3.8
Multimet 0.01 0.033 0.226 0.29 Ͼ 1.2 Ͼ 1.2 Ͼ 3.7 Ͼ 3.7
800H 0.023 0.046 0.14 0.19 0.19 0.23 0.29 0.35
RA330 0.01 0.11 0.02 0.17 0.041 0.22 0.096 0.21
S31000 0.01 0.028 0.025 0.058 0.075 0.11 0.2 0.26
S31600 0.315 0.36 Ͼ 1.7 Ͼ 1.7 Ͼ 2.7 Ͼ 2.7 Ͼ 3.57 Ͼ 3.57
S30400 0.14 0.21 Ͼ 0.69 Ͼ 0.69 Ͼ 0.6 Ͼ 0.6 Ͼ 1.7 Ͼ 1.73
S44600 0.033 0.058 0.33 0.37 Ͼ 0.55 Ͼ 0.55 Ͼ 0.59 Ͼ 0.59
246
0765162_Ch03_Roberge 9/1/99 4:27 Page 246
■
Hydrogen-hydrogen sulfide mixtures or sulfur vapor of a highly
reducing nature
■
Moderately reducing mixed gas environments that contain mixtures
of hydrogen, water, carbon dioxide, carbon monoxide, and hydrogen
sulfide
■
Sulfur dioxide-containing atmospheres
In the first category, sulfides rather than protective chromia are ther-
modynamically stable. Hydrogen-hydrogen sulfide mixtures are found in
catalytic reformers in oil refining operations. Organic sulfur compounds
such as mercaptans, polysulfides, and thiophenes, as well as elemental
sulfur, contaminate practically all crude oils in various concentrations
and are partially converted to hydrogen sulfide in refining operations.
Hydrogen sulfide in the presence of hydrogen becomes extremely corro-
sive above 260 to 288°C. Sulfidation problems may also be encountered
at lower temperatures. Increased temperatures and higher hydrogen
sulfide contents generally lead to higher degradation rates.
For catalytic reforming, the 18Cr-8Ni austenitic stainless steels
grades are considered to be adequately resistant to sulfidation. The
High-Temperature Corrosion 247
Uncorroded
alloy
External scale
Internal corrosion
products
Corroded
grain boundaries
Total
penetration
Internal
penetration
Figure 3.15 Schematic view of total penetration measurement for a typical corrosion
product morphology.
0765162_Ch03_Roberge 9/1/99 4:27 Page 247
use of stabilized grades is advisable. Some sensitization is unavoidable
if exposure in the sensitizing temperature range is continuous or long
term. Stainless equipment subjected to such exposure and to sulfida-
tion corrosion should be treated with a 2% soda ash solution or an
ammonia solution immediately upon shutdown to avoid the formation
of polythionic acid, which can cause severe intergranular corrosion
and stress cracking.
10
Vessels for high-pressure hydrotreating and oth-
er heavy crude fraction upgrading processes (e.g., hydrocracking) are
usually constructed of one of the Cr-Mo alloys. To control sulfidation,
they are internally clad with one of the 300 series austenitic stainless
steels. In contrast, piping, heat exchangers, valves, and other compo-
nents exposed to high-temperature hydrogen-hydrogen sulfide envi-
ronments are usually entirely constructed out of these austenitic
stainless alloys. Figure 3.16 illustrates the corrosion behavior of
austenitic steels as a function of hydrogen concentration and temper-
ature.
11
In some designs alloy 800H has been used for piping and head-
ers. In others, centrifugally cast HF-modified piping has been used.
10
The effects of temperature and H
2
S concentration upon sulfidation
of alloys often used in oil refining services are shown in Figs. 3.17 to
3.21, which represent the metal losses expected after 1 year of expo-
sure (note the decreasing corrosion penetration scale in Figs. 3.18 to
3.20). The carbon steel line, in Fig. 3.17, stops for lower concentrations
of H
2
S because FeS is not stable and the steel does not corrode in such
environment.
2
Increasing the temperature and H
2
S concentration
increases the sulfidation rate. It is typical that a temperature increase
of 55°C will double the sulfidation rate, whereas increasing the H
2
S
concentration by a factor of 10 may be needed to double the sulfidation
rate. Therefore, changes of H
2
S concentration are generally less sig-
nificant than temperature variations.
Increasing the Cr content of the alloy greatly slows the sulfidation,
as seen in progression from 9Cr-1Mo, S41000, S30400, 800H, 825, and
625 (Fig. 3.21). The ranges of H
2
S concentration represented in these
figures span the low H
2
S range of catalytic reformers to the high H
2
S
concentrations expected in modern hydrotreaters. A summary of max-
imum allowable temperatures that will limit the extent of metal loss
by sulfidation to less than 0.25 mm is shown in Table 3.8 for several
gas compositions of H
2
S-H
2
at a pressure of 34 atm, which is similar to
hydrotreating in an oil refinery.
2
The maximum allowable tempera-
tures for alloys exposed to different gas pressures and compositions
can be evaluated with this information.
In the second category, the presence of oxidizing gases such as H
2
O
(steam) or CO
2
slow the sulfidation rate below that expected if only the
H
2
S-H
2
concentrations were considered. This can be important because
gases, which are thought to contain only H
2
S-H
2
, often also contain
some H
2
O. For example, a gas, which has been well mixed and equili-
248 Chapter Three
0765162_Ch03_Roberge 9/1/99 4:27 Page 248
brated with water at room temperature, may contain up to 2% water
vapor in the gas. Sulfidation rate predictions based only upon the
H
2
S-H
2
concentrations may overestimate the rate of metal loss. The
precise mechanism of how H
2
O slows sulfidation by H
2
S is still unclear,
although numerous studies have confirmed this effect. This slowed cor-
rosion rate is sometimes called sulfidation/oxidation because it repre-
High-Temperature Corrosion 249
0.01
250 300 350 400 450 500 550 600 650 700 750
0.10
1.00
10.00
Temperature (°C)
Hydrogen Sulfide (%)
0.51
0.38
0.25
0.18
0.13
0.10
0.076
0.051
0.025
Lines of constant
corrosion rates (in mm • y
-1
)
Figure 3.16 Effect of temperature and hydrogen sulfide concentration on corrosion rates
of austenitic stainless steels for exposure longer than 150 h.
0765162_Ch03_Roberge 9/1/99 4:27 Page 249
sents a transition between the rapid corrosion of sulfidation and the
slow corrosion of oxidation of alloyed metals containing either Cr or Al.
2
Atmospheres high in sulfur dioxide are encountered in sulfur fur-
naces, where sulfur is combusted in air for manufacturing sulfuric
acid. Lower levels of sulfur dioxide are encountered in flue gases when
fossil fuels contaminated with sulfur species are combusted. It has
250 Chapter Three
10
0.001
0.0001
0.001
0.01
0.1
1
0.01 0.1
P H
2
S (atm)
Penetration (mm)
S30400
S4100
Carbon steel
Alloy 625
Alloy 800 H
9Cr 1 Mo
Alloy 825
Figure 3.17 Effect of H
2
S partial pressure upon sulfidation corrosion after 1 year in H
2
-
H
2
S gases at 34 atm and 540°C.
0765162_Ch03_Roberge 9/1/99 4:27 Page 250
been pointed out that relatively little corrosion data exist for engi-
neering alloys in these atmospheres.
12
Beneficial effects (retardation of
sulfidation) of chromium alloying additions and higher oxygen levels
in the atmosphere have been noted.
A tricky situation can arise when designing equipment that
requires resistance for variable times of exposure to multiple envi-
High-Temperature Corrosion 251
0.0
0.5
1.0
1.5
2.0
2.5
3.0
3.5
4.0
4.5
5.0
260 310 360
100 ppm H
2
S
10 ppm H
2
S
1 ppm H
2
S
410 460 510
Temperature (°C)
Figure 3.18 Effect of temperature upon sulfidation corrosion of 9Cr-1Mo after 1 year in
H
2
-H
2
S gases at 34 atm.
0765162_Ch03_Roberge 9/1/99 4:27 Page 251
ronments such as oxidizing and sulfidizing conditions. If oxidation
times dominate significantly over sulfidation, it may be prudent to
select a high-nickel, high-chromium alloy. Alloys such as HR-120,
HR-160, 602CA, or 45TM belong to this category. If sulfidation domi-
nates, low-nickel, high-iron, high-chromium alloys are more appro-
252 Chapter Three
0.0
0.5
1.0
1.5
2.0
2.5
3.0
3.5
4.0
260 310 360
100 ppm H
2
S
10 ppm H
2
S
1 ppm H
2
S
410 460 510
Penetration (mm)
Temperature (°C)
Figure 3.19 Effect of temperature upon sulfidation corrosion of S41000 after 1 year in
H
2
-H
2
S gases at 34 atm.
0765162_Ch03_Roberge 9/1/99 4:27 Page 252