Handbook of Corrosion Engineering Episode 1 Part 14 ppsx
Bạn đang xem bản rút gọn của tài liệu. Xem và tải ngay bản đầy đủ của tài liệu tại đây (523.78 KB, 34 trang )
ing area. Different borescopes are designed to provide direct, forward
oblique, right angle, and retrospective viewing of the area in question.
Fiberscopes. Fiberscopes are bundles of fiber optic cables that transmit
light from end to end. They are similar to borescopes, but they are flex-
ible. They can be inserted into openings and curled into otherwise
inaccessible areas. They also incorporate light sources for illumination
of the subject area and devices for bending the tip in the desired direc-
tion. Like borescope images, fiberscope images are formed at an ocular
or eyepiece.
Video imaging systems. Video imaging systems (or “videoscopes”) consist of
tiny charge-coupled device (CCD) cameras at the end of a flexible probe.
Borescopes, fiberscopes, and even microscopes can be attached to video
imaging systems. These systems consist of a camera to receive the
image, processors, and a monitor to view the image. The image on
the monitor can be enlarged or overlaid with measurement scales.
Images can also be printed on paper or stored digitally to obtain a per-
manent record. Video images can be processed for enhancing and ana-
lyzing video images for flaw detection. Specialized processing
algorithms may be applied which can identify, measure, and classify
defects or objects of interest.
Advanced methods. Moiré interferometry is a family of techniques that
visualize surface irregularities. Many variations are possible, but the
technique most applicable to corrosion detection is shadow moiré
(sometimes called projection moiré) for surface height determination.
The structured light technique is geometrically similar to projected or
shadow moiré methods, and can be thought of as an optical straight-
edge. Instead of fringe contours, the resultant observation is the
departure from straightness of a projected line. The surface profile can
be calculated using image processing techniques.
D-Sight has the potential to map areas of surface waviness as well
as to identify cracks, depressions, evidence of corrosion, and other
surface anomalies. D-Sight is a method by which slope departures
from an otherwise smooth surface are visualized as shadows. It can be
used in direct visual inspection or combined with photographic or
video cameras and computer-aided image processing. The concept of
D-Sight is related to the schlieren method for visualizing index of
refraction gradients or slopes in an optical system. One possible prob-
lem with D-Sight is that the technique shows virtually every devia-
tion on the surface, regardless of whether it is a defect or a normal
result of manufacture.
470 Chapter Six
0765162_Ch06_Roberge 9/1/99 5:02 Page 470
Liquid penetrant inspection. The liquid penetrant NDE method is
applied to detection of faults that have a capillary opening to the test
object surface. The nature of this NDE method demands that attention
be given to material type, surface condition, and rigor of cleaning.
Liquid penetrant inspection can be performed with little capital expen-
diture, and the materials used are low in cost per use. This technique
is applicable to complex shapes and is widely used for general product
assurance.
This technique is easy, completely portable, and highly accurate if
performed properly. It detects open-to-the-surface crack indications.
Rigorous surface cleaning is required. This technique is applicable
only to cleaned surfaces; unclean ones will give unsatisfactory results.
It is readily used on external and accessible surfaces that have been
subjected to minimal corrosion deterioration and can be cleaned. It
readily detects any open-to-the-surface cracks, surface defects, and
pitting.
Magnetic particle inspection. Magnetic particle inspection is applied to
the detection of surface-connected or near-surface anomalies in test
objects that are made from materials that sustain a magnetic field.
Special equipment is required in order to induce the required magnet-
ic field. Procedure development and process control are required in
order to use the proper voltage, amperage, and mode of induction. Test
object materials must be capable of sustaining an induced magnetic
field during the period of inspection. The concentration and mode of
application of the magnetic particles must be controlled. Material
characteristics or surface treatments which result in variable magnet-
ic properties will decrease detection capabilities. Magnetic particle
inspection can be performed with little capital expenditure and, as
with the liquid penetrant technique, the materials used are low in cost
per use, the technique is applicable to complex shapes, and it is wide-
ly used for general product assurance.
Magnetic inspection can be portable. It requires only a magnetiza-
tion power source, such as that provided by an electrical outlet. It is
most frequently used in evaluating the quality of weld deposits and
subsurface weld indications such as cracks. This is the preferred
method for detecting cracks in deaerators, for example.
Radiographic inspection. Radiographic inspection is a nondestructive
method of inspecting materials for surface and subsurface disconti-
nuities. This method utilizes radiation in the form of either x-rays or
gamma rays, both of which are electromagnetic waves of very short
wavelength. The waves penetrate the material and are absorbed,
depending on the thickness or the density of the material being
Corrosion Maintenance through Inspection and Monitoring 471
0765162_Ch06_Roberge 9/1/99 5:02 Page 471
examined. By recording the differences in absorption of the trans-
mitted waves, variations in the material can be detected. The varia-
tions in transmitted waves may be recorded by either film or
electronic devices, providing a two-dimensional image that requires
interpretation. The method is sensitive to any discontinuities that
affect the absorption characteristics of the material.
The techniques and technologies of x-ray radiography have most to
do with the design of the x-ray tube itself. There are many different
types of tubes used for special applications. The most common is the
directional tube, which emits radiation perpendicular to the long axis
of the tube in a cone of approximately 40°. Another type is the
panoramic tube, which emits x-rays in a complete 360° circle. This
type of tube would be used, for example, to examine the girth welds in
a jet engine with a single exposure.
■
Real-time radiography. This is the new form; it presents an instant
image, much like a video camera. It is mostly used for examining the
surfaces of piping beneath insulation with the insulation in place. It
is completely portable, and its operators are required to be licensed.
This technique allows the instant viewing of a radiographic image
on a cathode-ray tube. The image may be captured on any electron-
ic medium in use today. This electronic/digital imaging technique is
the only data retention system available.
■
Classical radiography. This is similar to a medical radiograph that
generates a film record. It is a completely portable inspection proce-
dure, and extensive training and licensing of personnel are required.
This technique is used to examine piping for interior corrosion and
deposits, weld quality, and conditions of internal valving or compo-
nents. A limitation is that it cannot be used on piping systems filled
with water or other liquids, since the radiation cannot penetrate
water. Extensive calibration and destructive verification of actual
conditions allow achievement of a high level of confidence in the
radiographic technique.
Advances in the use of radiography are being made that involve
using computers and high-powered algorithms to manipulate the data.
This is termed computed tomography, or CT scanning. By scanning a
part from many directions in the same plane, a cross-sectional view of
the part can be generated, and a two-dimensional view of the internal
structure may be displayed. The tremendous advantage of this method
is that internal dimensions can be measured very accurately to deter-
mine such conditions as wall thinning in tubes, size of internal dis-
continuities, relative shapes, and contours. More advanced systems
can generate three-dimensional scans when more than one plane is
scanned. CT scanning is costly and time-consuming. Radiography in
472 Chapter Six
0765162_Ch06_Roberge 9/1/99 5:02 Page 472
general and CT scanning in particular are extremely useful in vali-
dating and calibrating other, less complex and less costly methods.
Radioisotope sources can be used in place of x-ray tubes.
Radioisotope equipment has inherent hazards, and great care must be
taken with its use. Only fully trained and licensed personnel should
work with this equipment. As with x-rays, the most common method
of measuring gamma ray transmission is with film.
Compton backscatter imaging (CBI) is emerging as a near-surface
NDE measurement and imaging technique. CBI can detect critical
embedded flaws such as cracks, corrosion, and delaminations in metal
and composite aircraft structures. In CBI, a tomographic image of the
inspection layer is obtained by raster scanning the collimated source-
detector assembly over the object and storing the measured signal as
a function of position. Rather than measuring the x-rays that pass
through the object, CBI measures the backscattered beam to generate
the image. This enables single-sided measurement.
Eddy-current inspection. When an electrically conductive material is
exposed to an alternating magnetic field that is generated by a coil of
wire carrying an alternating current, eddy currents are induced on
and below the surface of the material. These eddy currents, in turn,
generate their own magnetic field, which opposes the magnetic field of
the test coil. This magnetic field interaction causes a resistance to cur-
rent flow, or impedance, in the test coil. By measuring this change in
impedance, the test coil or a separate sensing coil can be used to detect
any condition that would affect the current-carrying properties of the
test material. Eddy currents are sensitive to changes in electrical con-
ductivity, changes in magnetic permeability (the ability of a material
to be magnetized), the geometry or shape of the part being analyzed,
and defects. Among these defects are cracks, inclusions, porosity, and
corrosion.
Eddy-current methods are used to measure a variety of material
characteristics and conditions. They are applied in the flaw detection
mode for the detection of surface-connected or near-surface anomalies.
The test objects must be electrically conductive and be capable of uni-
form contact by an eddy-current probe. Special equipment and spe-
cialized probes are required to perform the inspection. Procedure
development, calibration artifacts, and process control are required to
assure reproducibility of response in the selected test object.
Initially, eddy-current devices utilized a meter to display changes of
voltage in the test coil. Currently, phase analysis instruments provide
both impedance and phase information. This information is displayed on
an oscilloscope or an integrated LCD display on the instrument. Results
of eddy-current inspections are obtained immediately. The other type of
Corrosion Maintenance through Inspection and Monitoring 473
0765162_Ch06_Roberge 9/1/99 5:02 Page 473
eddy-current instrument displays its results on planar form on a screen.
This format allows both coil impedance components to be viewed. One
component consists of the electrical resistance due to the metal path of
the coil wire and the conductive test part. The other component consists
of the resistance developed by the inducted magnetic field on the coil’s
magnetic field. The combination of these two components on a single
display is known as an impedance plane.
Automated scanning is performed using an instrumented scanner
that keeps track of probe position and automated signal detection so
that a response map of the test object surface can be generated.
Resolution of the inspection system is somewhat dependent on the
fidelity of the scan index and on the filtering and signal processing
that are applied in signal detection. A scan map can be generated by
automated eddy-current scanning and instrumentation systems.
The results of eddy-current inspection are extremely accurate if the
instrument is properly calibrated. Most modern eddy-current instru-
ments are relatively small and battery-powered. In general, surface
detection is accomplished with probes containing small coils (3 mm
diameter) operating at a high frequency, generally 100 kHz and above.
Low-frequency eddy current (LFEC) is used to penetrate deeper into a
part to detect subsurface defects or cracks in the underlying structure.
The lower the frequency, the deeper the penetration. LFEC is general-
ly considered to be between 100 Hz and 50 kHz.
A major advantage of eddy-current NDE is that it requires only min-
imal part preparation. Reliable inspections can be performed through
normal paint or nonconductive materials up to a thickness of approxi-
mately 0.4 mm. Eddy-current technology can be used to detect surface
and subsurface flaws on single- and multiple-layered materials.
Advanced methods
Scanned pulsed eddy current. This technique for application of eddy-
current technology uses analysis of the peak amplitude and zero
crossover of the response to an input pulse to characterize the loss of
material. This technology has been shown to measure material loss on
the bottom of a top layer, the top of a bottom layer, and the bottom of a
bottom layer in two-layer samples. Material loss is displayed according
to a color scheme to an accuracy of about 5 percent. A mechanical bond
is not necessary, as it is with ultrasonic testing. The instrument and
scanner are rugged and portable, using conventional coils and commer-
cial probes. The technique is sensitive to hidden corrosion and provides
a quantitative determination of metal loss.
Magneto-optic eddy-current imaging. Magneto-optic eddy-current
(MOI) images result from the response of the Faraday magneto-optic
sensor to the weak magnetic fields that are generated when eddy cur-
rents induced by the MOI interact with defects in the inspected mate-
474 Chapter Six
0765162_Ch06_Roberge 9/1/99 5:02 Page 474
rial. Images appear directly at the sensor and can be viewed directly
or imaged by a small CCD camera located inside the imaging unit. The
operator views the image on the video monitor while moving the imag-
ing head continuously along the area to be inspected. In contrast to
conventional eddy-current methods, the MOI images resemble the
defects that produce them, making the interpretation of the results
more intuitive than the interpretation of traces on a screen. Rivet
holes, cracks, and subsurface corrosion are readily visible. The image
is in video format and therefore is easily recorded for documentation.
Ultrasonic inspection. Ultrasonic inspection, one of the most widely
used NDE techniques, is applied to measure a variety of material
characteristics and conditions. Ultrasonic examination is performed
using a device which generates a sound wave through a piezoelectric
crystal at a frequency between 0.1 and 25 MHz into the piece being
examined and analyzes the return signal. The device measures the
time it takes for the signal to return and the amount and shape of
that signal. It is a completely portable device that requires only that
the probe be in direct contact with a clean surface in order to obtain
accurate information.
Test objects must support propagation of acoustic energy and have a
geometric configuration that allows the introduction and detection of
acoustic energy in the reflection, transmission, or scattered energy
configurations. The frequencies of the transducer and the probe diam-
eter have a direct effect on what is detected. Lowering the testing fre-
quency increases depth of penetration, while increasing the probe
diameter reduces the beam spread. Increasing the frequency also
increases the beam spread for a given diameter.
Manual scanning is performed using instruments that have an oscil-
loscope-type readout. Operator interpretation uses pattern recogni-
tion, signal magnitude, timing, and respective hand-scan position.
Variations in instrument readout and variations in scanning can be
significant. Automated scanning is performed using an instrumented
scanner that keeps track of probe position and automated signal detec-
tion (time, phase, and amplitude), so that a response map of the inter-
nal structure of the test object can be generated. The resolution of the
system is somewhat dependent on the fidelity of the scan index and on
the filtering and signal processing that are applied in signal detection.
A scan map may be generated by automated ultrasonic scanning and
instrumentation systems.
The most fundamental technique used is that of thickness testing. In
this case, the ultrasonic pulse is a compression or longitudinal wave
that is sent in a perpendicular direction into the metal being measured.
The signal reflects off the back wall of the product being analyzed, and
Corrosion Maintenance through Inspection and Monitoring 475
0765162_Ch06_Roberge 9/1/99 5:02 Page 475
the time of flight is used to establish the thickness. There are instru-
ments that allow the testing to be conducted through paint coatings.
This is done by looking at the waveform and selecting the area that rep-
resents the actual material, not the signal developed by the coatings.
Techniques have been developed that employ different types of
waves, depending on the type of inspection desired. Compression
waves are the type most widely used. They occur when the beam
enters the surface at an angle near 90°. These waves travel through
materials as a series of alternating compressions and dilations in
which the vibrations of the particles are parallel to the direction of the
wave travel. This wave is easily generated and easily detected, and
has a high velocity of travel in most materials. Longitudinal waves are
used for the detection and location of defects that present a reasonably
large frontal area parallel to the surface from which the test is being
made, such as corrosion loss and delaminations. They are not very
effective, however, for the detection of cracks which are perpendicular
to the surface.
Shear or transverse waves are also used extensively in ultrasonic
inspection; these are generated when the beam enters the surface at a
moderate angle. Shear-wave motion is similar to the vibrations of a
rope that is being shaken rhythmically: Particle vibration is perpen-
dicular to the direction of propagation. Unlike longitudinal waves,
shear waves do not travel far in liquids. Shear waves have a velocity
that is about 50 percent of that of longitudinal waves in the same
material. They also have a shorter wavelength than longitudinal
waves, which makes them more sensitive to small inclusions. This also
makes them more easily scattered and reduces penetration.
Surface waves (Rayleigh waves) occur when the beam enters the mate-
rial at a shallow angle. They travel with little attenuation in the direc-
tion of the propagation, but their energy decreases rapidly as the wave
penetrates below the surface. They are affected by variations in hard-
ness, plated coatings, shot peening, and surface cracks, and are easily
dampened by dirt or grease on the specimen.
Lamb waves, also known as plate waves and guided waves, occur
when ultrasonic vibrations are introduced at an angle into a relative-
ly thin sheet. A lamb wave consists of a complex vibration that occurs
throughout the thickness of the material, somewhat like the motion of
surface waves. The propagation characteristics of lamb waves depend
on the density, elastic properties, and structure of the material as well
as the thickness of the test piece and the frequency of the vibrations.
There are two basic forms of lamb waves: symmetrical (dilational) and
asymmetrical (bending). Each form is further subdivided into several
modes, which have different velocities that can be controlled by the
angle at which the waves enter the test piece. Lamb waves can be used
476 Chapter Six
0765162_Ch06_Roberge 9/1/99 5:02 Page 476
for detecting voids in laminated structures, such as sandwich panels
and other thin, bonded laminated structures.
Advanced methods
Dripless bubbler. One of the most promising improvements in
ultrasonic testing technology is the dripless bubbler. This is a devel-
opment not in the ultrasonic probe itself but in the mechanism for
employing it consistently on curved, irregular, vertical, and inverted
surfaces. The dripless bubbler itself is a pneumatically powered device
that holds a water column between the ultrasonic probe and the
inspected surface. With software control of the movement of the probe,
a fast and accurate map of the inspected surface can be obtained.
Laser ultrasound. There is also emerging interest in the area of
laser ultrasonics, or laser-based ultrasound (LUS). The innovation is
the use of laser energy to generate sound waves in a solid. This obvi-
ates the need for a couplant between the transducer and the surface of
the inspected material. The initial application of this new technology
seems to be directed toward process control. However, the technology
can also be applied for thickness measurement, inspection of welds
and joints, surface and bulk flaw detection on a variety of materials,
and characterization of corrosion and porosity on metals.
Thermographic inspection. Thermographic inspection methods are
applied to measure a variety of material characteristics and condi-
tions. They are generally applied in the flaw detection mode for the
detection of interfaces and variation of the properties at interfaces
within layered test objects. Test objects must be thermally conductive,
and the test object surface must be reasonably uniform in color and
texture. This technique uses the infrared energy associated with the
part or system being examined. It is noninvasive and gives a photo-
graphic image of the thermal conditions present on the surface being
examined. It can be used to accurately measure metal temperatures to
establish whether brittle or overheated conditions exist. The method is
a volume inspection process and therefore loses resolution near edges
and at locations of nonuniform geometry change.
Manual inspection is performed using manual control of the thermal
pulse process and human observation and interpretation of the thermal
images produced as a function of time. A false-color thermal map pre-
sentation may be used to aid in discrimination of fine image features
and pattern recognition. The thermal map may be recorded on video-
tape as a function of time. Automated scanning is performed using an
instrumented scanner which reproducibly introduces a pulse of ther-
mal energy into the test object and synchronizes pulse introduction
with the “start time” for use in automated image readout. Automated
readout is effected via preprogrammed digital image processing and is
Corrosion Maintenance through Inspection and Monitoring 477
0765162_Ch06_Roberge 9/1/99 5:02 Page 477
test object– and inspection procedure–specific. Several techniques have
been developed that use this temperature information to characterize
the thermal properties of the sample being tested.
Many defects affect the thermal properties of materials. Examples
are corrosion, debonds, cracks, impact damage, and panel thinning.
With judicious application of external heat sources, these defects can be
detected by an appropriate infrared survey. Uses of thermography tech-
niques currently range from laboratory investigations to field equip-
ment. Thermography, in its basic form, has the limitation that it
measures only the surface temperature of the inspected structure or
assembly. Therefore, it does not provide detailed insight into defects
or material loss located more deeply in the structure. Because it is an
area-type technique, it is most useful for identifying areas that should
be inspected more carefully using more precise techniques, such as
eddy-current and ultrasonic methods.
Thermal wave imaging overcomes some of these limitations by mea-
suring the time response of a thermal pulse rather than the tempera-
ture response. The thermal pulse penetrates multiple layers when
there is a good mechanical bond between the layers. The benefits of
thermal wave imaging technology include the ability to scan a wide
area quickly and to provide fast, quantitatively defined feedback with
minimal operator interpretation required.
Advanced methods. The raw image displayed by an IR camera conveys
only information about the temperature and emissivity of the surface
of the target it views. To gain information about the internal structure
of the target, it is necessary to observe the target either as it is being
heated or as it cools. Since it takes heat from the surface longer to
reach a deeper obstruction than to reach a shallow one, the effect of a
shallow obstruction appears at the surface earlier than that of a deep
one. The thermal response to a pulse over time, color-coded by time of
arrival, is displayed as a two-dimensional, C-scan image for interpre-
tation by the operator.
Dual-band infrared computed tomography uses flash lamps to excite
the material with thermal pulses and detectors in both the 3–5- and
the 8–12-m ranges to obtain the results. This technique gives three-
dimensional, pulsed-IR thermal images in which the thermal excita-
tion provides depth information, while the use of tomographic
mapping techniques eliminates deep clutter.
6.6.3 Data analysis
When an NDE process is applied to a test object, the output response
to an anomaly within the test object will depend on the form of detec-
478 Chapter Six
0765162_Ch06_Roberge 9/1/99 5:02 Page 478
tion, the magnitude of the feature that is used in detection, and the
relative response magnitude of the material surrounding the anom-
aly. In an ultrasonic inspection procedure, for example, the ampli-
tude of the response from an anomaly within a structure may be
used to differentiate the response from the grain structure (noise)
surrounding the anomaly. If the ultrasonic procedure (measure-
ment) is applied repetitively to the same anomaly, a distribution of
responses to both the anomaly and the surrounding material will be
obtained.
The measured response distribution reflects the variance in the
NDE measurement process and is typical of that obtained for any mea-
surement process. The response from the surrounding material con-
stitutes the baseline level for use in discrimination of responses from
internal anomalies. The baseline response may be termed noise, and
both the discrimination capability and anomaly sizing capability of the
NDE procedure are dependent on the relative amplitudes and the rate
of change of the anomaly response with increasing anomaly size
(slope). The considerable flaw-to-flaw variance and the variance in sig-
nal response to flaws of equal size cause increased spread in the prob-
ability density distribution of the signal response. If a threshold
decision (amplitude) level is applied to the responses, clear flaw dis-
crimination (detection) can be achieved, as shown in Fig. 6.42. If the
same threshold decision level (acceptance criterion) is applied to a set
of flaws of a smaller size (as shown in Fig. 6.43), clear discrimination
cannot be accomplished.
In this example, the threshold decision level could be adjusted to
a lower signal magnitude to produce detection. As the signal magni-
tude is adjusted downward to achieve detection, a slight increase in
the noise level will result in a “false call.” As the flaw size decreas-
es, the noise and signal plus noise responses will overlap. In such
cases, a downward adjustment in the threshold decision level (to
detect all flaws) will result in an increase in false calls. Figure 6.44
shows an example in which the threshold decision level (acceptance
criterion) has been adjusted to a level where a significant number of
false calls will occur. In this example, a slight change in flaw signal
distribution will also result in failure to detect a flaw. The NDE pro-
cedure is not robust and is not subject to qualification or certifica-
tion for purposes of primary discrimination. The procedure may,
however, be useful as a prescreening tool, if it is followed by anoth-
er procedure that provides discrimination of the residuals. For
example, a neural network detection process structured to provide
discrimination at a high false call rate may be a useful in-line tool if
other features are used for purposes of discrimination after the
anomaly or variance is identified.
Corrosion Maintenance through Inspection and Monitoring 479
0765162_Ch06_Roberge 9/1/99 5:02 Page 479
480 Chapter Six
Probability density distribution
Signal + Noise
Noise
Signal amplitude
Threshold
Decision Level
Figure 6.42 Flaw detection at a threshold signal level.
Probability density distribution
Signal + Noise
Noise
Signal amplitude
Threshold
Decision Level
Flaws not
detected
(misses)
Figure 6.43 Failure to detect smaller flaws at the same threshold signal level.
0765162_Ch06_Roberge 9/1/99 5:02 Page 480
References
1. Moreland, P. J., and Hines, J. G., Hydrocarbon Processing, 17(1):1–31 (1978).
2. Timmins, P. F., Predictive Corrosion and Failure Control in Process Operations,
Materials Park, Ohio, ASM International, 1996.
3. Horvath, R. J., The Role of the Corrosion Engineer in the Development and
Application of Risk-Based Inspection for Plant Equipment, Materials Performance,
39:70–75 (1998).
4. Wheaton, R., The Components of Reliability, />1998.
5. Douglas, J., The Maintenance Revolution, EPRI Journal, 20(3):6–15 (1995).
6. Nowlan, F. S., and Heap, H. F., Reliability Centered Maintenance, AD/AAo66-579,
Washington, D.C., National Technical Information Service, 1978.
7. Nowlan F. S., and Heap, H. F., Reliability Centered Maintenance, Dolby Access
Press, 1979.
8. Griffiths, D., Evolution of Computerized Asset Management and Maintenance,
1998.
9. Coullahan R., and Siegfried, C., Life Cycle Asset Management, Facilities
Engineering Journal (1996).
10. Marshall, W., Condition Assessment Linked to Predictive Maintenance Modeling: A
Valuable Management Tool, , 1998.
11. Douglas, J., Solutions for Steam Generators, EPRI Journal, 20(3):28–34 (1995).
12. Corrosion Monitoring System Enables Utility to Avoid Relining Stack and Ducts,
EPRI RP1871-17, Palo Alto, Calif., Electric Power Research Institute, 1990.
13. NRC, Steam Generator Tube Issues, , 1998.
14. Hoffman, C., 20,000-Hour Tuneup, Air & Space, 12:39–45 (1997).
15. Townley, N. J., Roberge, P. R., and Little, M. A., Corrosion Maintenance through
Knowledge Re-Use: The CP140 Aurora, Canadian Aeronautics and Space Journal,
43:189–194 (1997).
16. Zollars, B., Salazar, N., Gilbert, J., et al., Remote Datalogger for Thin Film Sensors,
Houston, Tex., NACE International, 1997.
17. Kelly, R. G., Yuan, J., Jones, S. H., Blanke, W., Aylor, J. H., Wang, W., and Batson,
A. P., “Embeddable Microinstruments for Corrosion Monitoring,” in Corrosion 97,
Houston, Tex., NACE International, 1997, pp. 1–12.
Corrosion Maintenance through Inspection and Monitoring 481
Probability density distribution
Signal amplitude
Noise
False calls
Signal + Noise
Threshold
Decision Level
Figure 6.44 Threshold decision level results in false calls.
0765162_Ch06_Roberge 9/1/99 5:02 Page 481
18. Dean, S. W., Overview of Corrosion Monitoring in Modern Industrial Plants, in
Moran, G.C., and Labine, P. (eds.), Corrosion Monitoring in Industrial Plants Using
Nondestructive Testing and Electrochemical Methods, ASTM STP 908, Philadelphia,
American Society for Testing and Materials, 1986, pp. 197–220.
19. Cooper, G. L., Sensing Probes and Instruments for Electrochemical and Electrical
Resistance Corrosion Monitoring, in Moran, G. C., and Labine, P. (eds.), Corrosion
Monitoring in Industrial Plants Using Nondestructive Testing and Electrochemical
Methods, ASTM STP 908, Philadelphia, American Society for Testing and Materials,
1986, pp. 237–250.
20. Denzine, A. F., and Reading, M. S., An Improved, Rapid Corrosion Rate
Measurement Technique for All Process Environments, Materials Performance,
37:35–41 (1998).
21. Britton, C. F., and Tofield, B. C., Effective Corrosion Monitoring, Materials
Performance, 4:41–44 (1988).
22. Milliams, D. E., and Van Gelder, K., Corrosion Management, Materials
Performance, 35:13–15 (1996).
23. Wietek, B., “Monitoring the Corrosion of Steel in Concrete,” F.I.P. Symposium on
Post-Tensioned Concrete Structures, Slough, U.K., Concrete Society, 1996.
24. Flis, J., Pickering, H. W., and Osseo-Asare, K., Assessment of Data from Three
Electrochemical Instruments for Evaluation of Reinforcement Corrosion Rates in
Concrete Bridge Components, Corrosion, 51:602–609 (1995).
25. Elsener, B., and Bohni, H., Potential Mapping and Corrosion of Steel in Concrete, in
Berke, N. S., Chaker, V., and Whiting, D. (eds.), Corrosion Rates of Steel in Concrete,
ASTM STP 1065, Philadelphia, American Society for Testing and Materials, 1990,
pp. 143–156.
26. Macdonald, D. D., Urquidi-Macdonald, M., Rocha-Filho, R. C., et al., Determination
of the Polarization Resistance of Rebar in Reinforced Concrete, Corrosion,
47:330–335 (1991).
27. Jafar, M. I., Dawson, J. L., and John, D. G., Electrochemical Impedance and
Harmonic Analysis Measurements on Steel in Concrete, in Scully, J. R., Silverman,
D. C., and Kendig, M. W. (eds.), Electrochemical Impedance: Analysis and
Interpretation, ASTM STP 1188, Philadelphia, American Society for Testing and
Materials, 1993, pp. 384–403.
28. Schiessl, P., and Raupach, M., “Macrocell Steel Corrosion in Concrete Caused by
Chlorides,” Second CANMET/ACI International Conference on Durability of
Concrete, Montreal, Canada, CANMET, 1991, pp. 565–583.
29. Weiermair, R., Hansson, C. M., Seabrook, P. T., and Tullmin, M., “Corrosion
Measurements on Steel Embedded in High Performance Concrete,” 1996. Third
CANMET/ACI Conference on Performance of Concrete in Marine Environment,
CANMET, St. Andrews by the Sea, 1996, pp. 293–308.
30. Bertocci, U., A Comparison of Electrochemical Noise and Impedance Spectroscopy
for the Detection of Corrosion in Reinforced Concrete, in Kearns, J. R., Scully, J. R.,
Roberge, P. R., et al. (eds.), Electrochemical Noise Measurement for Corrosion
Applications, ASTM 1277, Montreal, American Society for Testing and Materials,
1996, pp. 39–58.
31. Roberge, P. R., Tullmin, M. A. A., Grenier, L., et al., Corrosion Surveillance for
Aircraft, Materials Performance, 35:50–54 (1996).
32. Winters, M. A., Stokes, P. S. N., and Nichols, H. F., Simultaneous Corrosion and
Fouling Monitoring under Heat Transfer in Cooling Water Systems, in Kearns, J. R.,
Scully, J. R., Roberge, P. R., Reichert, D. L., and Dawson, J., Electrochemical Noise
Measurements for Corrosion Applications, STP 1277, Philadelphia, American
Society for Testing and Materials, 1996, pp. 230–246.
33. Walsh, T. G., “Continuous On-Line Weld Corrosion Monitoring for the Oil and Gas
Industry,” in Revie, R. W., and Wang, K. C., International Conference on Pipeline
Reliability, Ottawa, Canada, CANMET, 1992, pp. 17-1–17-7.
34. Agarwala, V. S., “Chemical Sensors for Integrity of Coatings,” Tri-Service Conference
on Corrosion, 1992, pp. 315–325.
482 Chapter Six
0765162_Ch06_Roberge 9/1/99 5:02 Page 482
35. Johnson, R. E., and Agarwala, V. S., “Fluorescence Based Chemical Sensors for
Corrosion Detection,” in Corrosion 97, Houston, Tex., NACE International, 1997, pp.
1–5.
36. Butler, M. A., and Ricco, A. J., Chemisorption-induced Reflectivity Changes in
Optically Thin Silver Films, Applied Physics Letters, 53:1471–1473 (1988).
37. Smyrl, W. H., and Butler, M. A., Corrosion Sensors, The Electrochemical Society
Interface, 2:35–39 (1993).
38. Bennett, K. D., and McLaughlin, L. R., “Monitoring of Corrosion in Steel Structures
using Optical Fiber Sensors,” in Proceedings of SPIE—The International Society for
Optical Engineering, 1995, 2446:48–59.
39. Poland, S. H., Duncan, P. G., Alcock, M. A., Zeakes, J., Sherrer, D., Murphy, K. A.,
and Claus, R. O., “Corrosion Sensing Technique Using Metal Coated Fiber Optic,”
Strain Gages—40th International Symposium, Anaheim, Calif., 1995.
40. Ahlberg, H., Lundquist, S., Tell, R., et al., Laser Spectroscopy for In Situ Ammonia
Monitoring, Spectroscopy Europe, 6:22 (1994).
41. Mendoza, E. A., Khalil, A. N., Sun, Z., et al., “Embeddable Distributed Moisture and
pH Sensors for Non-Destructive Inspection of Aircraft Lap Joints,” in Proceedings of
SPIE—The International Society for Optical Engineering, 1995, 2455:102–112.
42. Fuhr, P. L., Ambrose, T. P., Huston, D. R., et al., Fiber Optic Corrosion Sensing for
Bridges and Roadway Surfaces, in Proceedings of SPIE—The International Society
for Optical Engineering, 1995, 2446:2–8.
43. Cosentino, P., Grossman, B., Shieh, C., et al., Fiber-Optic Chloride Sensor
Development, Journal of Geotechnical Engineering, 121(8): 610–617 (1995).
44. Fuhr, P. L., and Huston, D. R., Corrosion Detection in Reinforced Concrete
Roadways and Bridges via Embedded Fiber Optic Sensors, Smart Materials and
Structures, 7(2):217–228 (1998).
45. Melle, S. M., Liu, K., and Measures, R. M., A Passive Wavelength Demodulation
System for Guided-Wave Bragg Grating Sensors, IEEE Photonics Technology
Letters, 4:515–518 (1992).
46. Bray, D. E., and Stanley, R. K., Nondestructive Evaluation, New York, McGraw-Hill,
1989.
47. Rummel, W. D., and Matzkanin, G. A., Nondestructive Evaluation (NDE)
Capabilities Data Book. Austin, Tex., Nondestructive Testing Information Analysis
Center (NTIAC), 1997.
Corrosion Maintenance through Inspection and Monitoring 483
0765162_Ch06_Roberge 9/1/99 5:02 Page 483
485
Acceleration and
Amplification of
Corrosion Damage
7.1 Introduction 486
7.2 Corrosion Testing 488
7.2.1 Corrosion tests and standards 491
7.2.2 Examples of corrosion acceleration 500
The anodic breakthrough method for testing anodized
aluminum 500
Intergranular anodic test for heat-treatable aluminum alloys 505
The corrosion resistance of aluminum and aluminum-lithium
alloys in marine environments 507
7.2.3 Laboratory tests 512
Cabinet tests 513
Immersion testing 516
High-temperature/high-pressure (HT/HP) testing 517
Electrochemical test methods 522
7.2.4 Field and service tests 555
Selecting a test facility 557
Types of exposure testing 557
Optimizing test programs 559
7.3 Surface Characterization 562
7.3.1 General sensitivity problems 566
7.3.2 Auger electron spectroscopy 566
7.3.3 Photoelectron spectroscopy 567
7.3.4 Rutherford backscattering 568
7.3.5 Scanning probe microscopy (STM/AFM) 569
7.3.6 Secondary electron microscopy and scanning Auger
microscopy 571
SEM 571
SAM 572
7.3.7 Secondary ion mass spectroscopy 572
References 574
Chapter
7
0765162_Ch07_Roberge 9/1/99 5:41 Page 485
sometimes receives a damaging heat treatment, and the heating and
cooling causes residual stresses in the structure. Weld spatter and
weld oxides tend to drastically reduce the corrosion resistance of
stainless steels, for example.
■
Heat treatment. A large group of iron-based alloys has been found to
be susceptible to rapid intergranular attack in a wide range of plant
environments when the compositions at the grain boundaries have
been changed by equilibrium segregation of alloying elements, espe-
cially the precipitation of carbides, nitrides, and other intermetallics.
These changes are a result of exposure of the alloys during produc-
tion of mill forms (rods, sheet, plates, and tubes) to temperatures at
which solid-state reactions occur preferentially at grain boundaries.
Because welding operations are used in the production of tubes from
sheet material and during shop fabrication and field erection, there
are further opportunities for the exposure of alloys to the range of
temperatures that may result in the depletion of essential chromium.
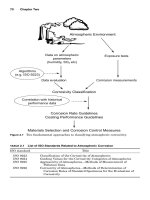
Figure 7.1 illustrates the weld decay zone as a function of the weld-
ing temperature of a stainless steel containing what was a common
carbon content only a decade ago. The extent of sensitization for a giv-
en temperature and time was found to depend very much on the car-
bon content. An 18-8 stainless steel containing more than 0.1% C may
be severely sensitized after heating for 5 min at 600°C, whereas a sim-
ilar alloy containing 0.06% C is affected less. The physical properties
of stainless steels do not change greatly after sensitization. Because
precipitation of chromium carbide accompanies sensitization, the alloy
becomes slightly stronger and slightly less ductile. Damage occurs
only upon exposure to a corrosive environment, with the alloy corrod-
ing along grain boundaries at a rate depending on the severity of the
environment and the extent of sensitization.
Acceleration and Amplification of Corrosion Damage 487
Heat-affected zone (HAZ)
Weld nugget
Weld decay
100
°
C1000
°
C2000
°
C2500
°
C
1500
°
C3000
°
C
Figure 7.1 Weld decay zone as a function of the welding temperature of stainless steel.
0765162_Ch07_Roberge 9/1/99 5:41 Page 487
Corrosion tests are an important tool for a variety of industrial
tasks that can vary greatly over the life of a system. A decision that
makes economic sense at design time may not make any sense by the
time the same system is in its 20th year of operation. In some process
applications, the materials selected may have been the optimum
choice for the initial operating conditions. However, unintended
minor changes in the operating conditions can easily increase the cor-
rosivity of a process. For tests to yield meaningful results, knowledge
of the environment that exists under actual service conditions is nec-
essary. Quite often the water quality within a plant, under normal
operating conditions, differs significantly from that at the intake to
the plant. In order to conduct realistic corrosion tests, these varia-
tions must be taken into account. The bulk environmental conditions
can be clean seawater, e.g., around offshore structures and some pow-
er stations. In other instances the water is polluted or brackish, while
in still other cases, e.g., ships, a variety of water qualities will be
encountered during service.
1
Some of the factors leading to corrosion damage can be reproduced
relatively easily by creating a situation favorable to their occurrence.
However, other factors depend entirely on the development of local
defects that often become visible only after long and highly variable
periods of exposure, such as the effects caused by the neutral salt
spray test commonly known as ASTM B 117, Method for Salt Spray
(Fog) Testing. When an experiment or test is planned, many factors
have to be considered. The following list enumerates some of the most
standard considerations for the design of a test program:
2
■
What are the objectives of the test?
■
How should the results be interpreted?
■
How can the information be integrated with earlier or other tests?
■
How many specimens are available, and what is their production
schedule (batch, sequential)?
■
How many factors control the specimen’s behavior?
■
How many factors are to be included in the tests?
■
Which of these factors interact and which have negligible interaction?
■
What type of data are to be measured?
■
Is the sample homogeneous?
■
How representative is the sample?
■
Are the tests destructive?
■
How expensive are the tests and/or specimens?
Acceleration and Amplification of Corrosion Damage 489
0765162_Ch07_Roberge 9/1/99 5:41 Page 489
■
How much control is there over testing?
■
How difficult would it be to include human errors of different kinds
in the planning?
With such a long list of questions and the continuously increasing
number of testing methods, it is important to simplify the design of
test plans by adopting a testing strategy that relates requirements to
the main test parameters. The decision tree presented in Fig. 7.2 has
been developed to facilitate the selection of tests designed to verify
the susceptibility of steels to various forms of stress corrosion crack-
ing (SCC). The strategy would be to start with the most severe and
least expensive SCC test, i.e., the slow strain-rate test, in which a
bar made from the relevant material is exposed to the environment
of interest and slowly monotonically strained to fracture.
3
When
cracks are found, the susceptibility of the material should then be
further evaluated by performing a battery of other tests designed to
differentiate among the various mechanisms leading to SCC and
hydrogen embrittlement.
Statistical methods are essential for determining the significance lev-
els of results and corresponding material specifications. Corrosion resis-
tance is only one of many characteristics of a material. Together with the
physical, mechanical, and fabrication properties, the corrosion resistance
determines the applicability of a material for a specific purpose. These
properties may be measured or verified by tests. However, unlike physi-
cal and mechanical results, which can be used immediately, corrosion
resistance results are often presented in a descriptive or qualitative
manner and therefore are difficult to utilize. In order to use the results
of these tests for life prediction, consideration of the methodologies pre-
sented in Chap. 4, Modeling, Life Prediction, and Computer Applications,
is recommended.
Test methods for determining corrosion resistance are specific and
must be based on the conditions prevailing and the materials to be
used, including coatings and other protective measures planned for
the specific application. All these details, including the specification
ranges for significant variables, must be determined from individual-
ly formulated tests based on the desired service life and other require-
ments of an application. The emphasis placed on the individual
characteristics of a test program and the evaluation methods for each
metal-environment combination does not preclude the possibility of
standardizing the testing and evaluation methods because many
applications are identical or similar and the information gathered
from one system is applicable to others.
490 Chapter Seven
0765162_Ch07_Roberge 9/1/99 5:41 Page 490
one of the largest institutions of this kind. ASTM is a not-for-profit
organization that provides a forum for producers, users, ultimate con-
sumers, and those having a general interest to meet on common
ground and write standards for materials, products, systems, and ser-
vices. There are 132 ASTM main technical committees, and each is
divided into subcommittees. The subcommittee is the primary unit in
this organization, as it comprises the highest degree of expertise in
any given area. Subcommittees are further subdivided into task
groups. Committee G-1, Corrosion of Metals, is thus subdivided into
the following subcommittees:
G01.02 Terminology
G01.03 Computers in Corrosion
G01.04 Atmospheric Corrosion
G01.05 Laboratory Corrosion Tests
G01.06 Stress Corrosion Cracking and Corrosion Fatigue
G01.07 Galvanic Corrosion
G01.08 Corrosion of Nuclear Materials
G01.09 Corrosion in Natural Waters
G01.10 Corrosion in Soils
G01.11 Electrochemical Measurements in Corrosion Testing
G01.12 In-Plant Corrosion Tests
G01.14 Corrosion of Reinforcing Steel
G01.91 Standing Committee on Editorial Review
G01.93 Standing Committee on Long Range Planning
G01.95 Standing Advisory Committee for ISO/TC 156
G01.96 Standing Committee on Awards
G01.97 Publicity, Symposia and Workshops
G01.99 Standing Committee on Liaison
G01.99.01 Corrosion of Implant Materials
Besides its regular standard-development meetings, the G-1 com-
mittee has sponsored an impressive series of highly focused technical
symposia that have led to the publication of over 1300 special techni-
cal publications (STP). Committee G-1 has also produced some gener-
ic reference documents summarizing state-of-the-art information
related to corrosion testing. One such publication, Corrosion Tests and
Standards, is a very valuable source of information for planning cor-
rosion tests.
4
The information contained in that publication summa-
rizes the efforts of over 400 experts in the field of corrosion testing
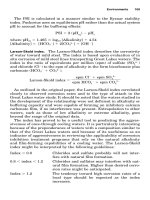
and evaluation. The ASTM corrosion test handbook is highly redun-
492 Chapter Seven
0765162_Ch07_Roberge 9/1/99 5:41 Page 492
dant by design, and its users will find considerable overlap of subject
matter (Fig. 7.3). For example, a specific type of corrosion can be thor-
oughly discussed in the section Testing for Corrosion Types and in the
section Testing in Environments. If a specific metal or alloy is sus-
ceptible to that type of corrosion, the subject would also be discussed
in the appropriate chapter in Materials Testing. And when a specific
industry is involved, the appropriate chapter under Testing in
Industries would include a discussion on testing for that type of cor-
rosion in that industry. The test handbook is divided into the follow-
ing five main sections:
1. Types of tests. Each chapter includes basic principles, describes
test techniques and important variables, discusses testing consid-
erations such as specimen preparation and evaluation, and includes
pertinent standards used.
2. Testing for Corrosion Types. Each chapter provides an overview
and includes a description of the basic principles and factors con-
trolling the type of corrosion.
3. Testing in Environments. The chapters in this section provide a
description of each environment, including factors and variables
affecting corrosion rates and mechanisms, and the unique charac-
teristics of testing in the specific environment.
4. By Materials. This section includes a discussion of the nature of
each material, such as the effects of composition, alloying, metal-
lurgical treatments, microstructure, surface effects, and natural
protective films on the corrosion behavior.
5. Testing in Industries. The chapters in this section provide an
overview of the unique situations encountered by various indus-
tries, and how corrosion tests are used to combat the corrosion prob-
lems faced in these industries.
The development of laboratory corrosion tests should be based on a
previous determination of the dominant corrosion factors. Even if the
preferred practice is to design such tests so that they represent the
most severe conditions for the type of corrosion involved, it is still
important to investigate the kinetic components involved in corrosion
problems in order to understand the mechanisms and causes for fail-
ure. With these points in mind, it is useful to consider how realistic
corrosion acceleration may be achieved. Raising the temperature can
be useful but may cause changes in the form and nature of hydrous
gels, which are often important in the initial stages of corrosion.
5
Increasing the concentration or corrosiveness of salt spray, for exam-
ple, may not necessarily be appropriate during cyclic testing, since
Acceleration and Amplification of Corrosion Damage 493
0765162_Ch07_Roberge 9/1/99 5:41 Page 493
By Corrosion types
By Materials
By Environments
By Industries
automotive
commercial aircraft
military aircraft and
aerospace
pipeline
highways
tunnels and bridges
marine piers and docks
electric power
nuclear power
steam generation
flue gas desulfurization
electronics
telecommunications
metals processing
chemical processing
pulp and paper
petroleum production and
refining
food and beverage
water treatment
medical and dental
pharmaceutical
Types of tests
uniform
pitting
crevice
galvanic
intergranular
exfoliation
erosion
cavitation
fretting
dealloying
SCC
corrosion fatigue
hydrogen damage
Laboratory Tests
electrochemical
cabinet
immersion
high-temperature
high pressure testing
Field tests
:
atmospheric
seawater
freshwater
soils
Service Tests
industrial applications
high-temperature
outdoor atmospheres
indoor atmospheres
seawater
freshwater
soils
concrete
industrial waters
industrial chemicals
petroleum
high temperature gases
organic liquids
molten salts
liquid metals
inhibitors
in-vivo and
microbiological effects
zinc
magnesium
aluminum (and alloys)
steels
copper (and alloys)
nickel (and alloys)
stainless steels
cobalt-base alloys
titanium
zirconium & hafnium
tantalum
metallic coatings
nonmetallic coatings
MMC
electrodeposits
powder metals
Figure 7.3 A graphical representation of the highly redundant index of the Corrosion Tests and Standards handbook.
494
0765162_Ch07_Roberge 9/1/99 5:41 Page 494
even an initially dilute spray will, after a sufficient number of cycles,
result in the solubility of ionic species being exceeded.
6
Generally, corrosion products developed in synthetic environments
such as those produced in the ASTM B 117 test are substantially dif-
ferent from those produced during natural weathering or even during
wet-dry mixed salt spray tests.
5
For example, corrosion of aluminum
or zinc specimens in B 117 primarily produces soluble species such as
AlCl
3
or ZnCl
2
, and so little corrosion product remains on surfaces.
Exposures in a wet-dry test, in contrast, cause the formation of corro-
sion products on those metals that are more representative of those
formed during natural exposure. On aluminum, for example, hydrated
aluminas containing chloride and amorphous material are produced in
both the high-sulfate and high-chloride cyclic salt spray tests.
5
The
reality can be even more complex, as illustrated in Table 7.1, where it
can be seen that the products found on specimens exposed to real envi-
ronments often consist of corrosion products mixed with various for-
eign materials.
7
A good example of an element that can be reproduced and accelerated
in a laboratory environment is the formation of occluded cells; this can
be achieved with multiple crevice assemblies, as described in ASTM G
78, Standard Guide for Crevice Corrosion Testing of Iron-Base and
Nickel-Base Stainless Alloys in Seawater and Other Chloride-
Containing Aqueous Environments. In this test, washers make a num-
ber of contact sites on either side of the specimens (Fig. 7.4). The
number of sites showing attack in a given time can be related to the
resistance of a material to initiation of localized corrosion, and the
average or maximum depth of attack can be related to the rate of prop-
agation. The large number of sites in duplicate or triplicate specimens
is amenable to probabilistic evaluation. The same test can be extended
to other alloy systems or situations as illustrated in Figs. 7.5 to 7.8,
which show the results of four-month exposure of four aircraft alu-
minum materials partly submerged in a circulating seawater tank.
8
In other cases, the effect of a test on one of the elements contributing
to the corrosion damage can be quantified and recorded for the evalua-
tion of the materials being tested. Amplification of the impact that cor-
rosion has on materials is particularly attractive when the results of a
test cannot be easily evaluated. Evaluating test results can be difficult
either because these results depend on a slow, solid state transformation
of the materials or because they are produced by tests that run for a pre-
specified time and end with a pass/fail assessment, thus generating cen-
sored data. A good example of monitoring specific signals provoked by a
particularly aggressive environment is the automated stress corrosion
testing method called the ASCOR (automated stress corrosion ring) test,
which was specifically developed to evaluate the performance of
Acceleration and Amplification of Corrosion Damage 495
0765162_Ch07_Roberge 9/1/99 5:41 Page 495
496 Chapter Seven
TABLE 7.1 Results of X-Ray Diffraction of Products Found on Specimens
Exposed to Real Environments
Sample description Chemical or mineral name* Chemical formula
Product formed on Nesquehonite MgCO
3
и3H
2
O
magnesium during Calcium fluosilicate CaSiF
6
3-month immersion Beta silicon carbide -SiC
in tap water Sodium sulfide Na
2
S
Sodium fluoride NaF
Magnesium carbonate
chloride hydroxide hydrate MgCl
2
иMgCO
3
иMg(OH)
2
и6H
2
O
Magnesium pyrophosphate Mg
2
P
2
O
7
Anorthoclase (Na,K)AlSi
3
O
8
Alpha cristobalite SiO
2
Sodium hydroxide NaOH
Calcium aluminum Ca
4
Al
6
O
12
SO
4
oxide sulfate
Substance found on Halite NaCl
heat exchanger
Substance found Alpha quartz SiO
2
beneath paint on
metal surface
Product formed on Lepidocrocite ␥-Fe
2
O
3
иH
2
O
automobile bumper Goethite Fe
2
O
3
и2H
2
O
support during
3-year service
Product from con- Zinc ferrite ZnOиFe
2
O
3
version unit in Cobalt ferrite CoOиFe
2
O
3
marine environment Halite NaCl
Chromic oxide Cr
2
O
3
Nickel, zinc ferrospinel (Ni,Zn)OиFe
2
O
3
Sodium fluothorate Na
3
Th
2
F
11
Embolite Ag(Cl,Br)
Magnesioferrite MgFe
2
O
4
Beryllium palladium BePd
Magnetite Fe
3
O
4
Nickel titanium NiTi
Product formed on Botallackite CuCl
2
и3Cu(OH)
2
и3H
2
O
copper during 3- Ilvaite Ca(Fe,Mn,Mg)
2
(Fe,Al)(SiO
4
)
2
OH
month immersion
in tap water
Product from Al-Cu Ammonium copper (NH
4
)
2
иCuF
4
и2H
2
O
alloy exposed to fluoride dihydrate
deep-sea Potassium cyanide KCN
environment Chi alumina Al
2
O
3
Calcium aluminate 3CaOиAl
2
O
3
Alpha cadmium iodide CdI
2
0765162_Ch07_Roberge 9/1/99 5:41 Page 496
aluminum alloys submitted to ASTM G 44, Standard Practice for
Evaluating Stress Corrosion Cracking Resistance of Metals and Alloys
by Alternate Immersion in 3.5% NaCl Solution. This method involves
testing cylindrical and sheet specimens in a loading ring instrumented
with strain gauges to measure the load.
9
Initiation of a stress corrosion
Acceleration and Amplification of Corrosion Damage 497
TABLE 7.1 Results of X-Ray Diffraction of Products Found on Specimens
Exposed to Real Environments (Continued)
Sample description Chemical or mineral name* Chemical formula
Product from Al-Zn- Chi alumina Al
2
O
3
Mg-Cu alloy exposed Alpha cadmium iodide CdI
2
to deep-sea
environment
Product from Al-Mn Ammonium copper (NH
4
)
2
CuF
4
и2H
2
O
alloy exposed to fluoride dihydrate
deep-sea Nobleite CaB
6
O
10
и4H
2
O
environment
*Substances shown in italics are not corrosion products of the primary metals or alloys
involved in the system.
(b)
(a)
Figure 7.4 A schematic repre-
sentation of (a) the washer and
(b) a washer assembly for con-
ducting an ASTM G 78 crevice
susceptibility test.
0765162_Ch07_Roberge 9/1/99 5:41 Page 497
498 Chapter Seven
Figure 7.5 Appearance of 8090-T851 aluminum panels with crevice washers after par-
tial immersion in seawater for 4 months. The air/water interface was near the top of the
central hole.
Figure 7.6 Appearance of 7075-T6 aluminum panels with crevice washers after partial
immersion in seawater for 4 months. The air/water interface was near the top of the cen-
tral hole.
0765162_Ch07_Roberge 9/1/99 5:41 Page 498