Handbook of Corrosion Engineering Episode 2 Part 1 ppt
Bạn đang xem bản rút gọn của tài liệu. Xem và tải ngay bản đầy đủ của tài liệu tại đây (811.94 KB, 35 trang )
Acceleration and Amplification of Corrosion Damage 551
Level 1
Start
Graphic
display
Level 1
Output
Data export
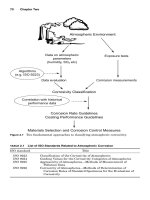
Figure 7.35 Flowchart describing the logic of the stochastic process detector (SPD)
technique.
0765162_Ch07_Roberge 9/1/99 5:41 Page 551
crevice initiation. The stochasticity technique was found to be particu-
larly sensitive to the onset of crevice attack. By using a combination of
noise analysis techniques, it was possible to identify three distinct cor-
rosion modes during these experiments: pitting, massive pitting, and
crevice attack.
42
Figures 7.36 to 7.39 contain the E
corr
measurements obtained dur-
ing four consecutive experiments made with these S30400 steel cylin-
drical specimens equipped with the crevice collar and the results
obtained by analyzing the voltage fluctuations by the SPD and R/S
techniques. At the end of these tests, the specimens were removed
from the electrolyte, the PTFE collar was removed, and the severity
of the corrosion attack was assessed. In all four cases, severe crevice
attack was observed beneath the collar around the majority of the cir-
cumference. Knowing that a Brownian motion behavior is equivalent
to a fractal dimension of 1.5, as can be verified by the R/S technique,
while the presence of persistence causes an increase in D, it is possi-
ble to divide the results presented in Figs. 7.36 to 7.39 into two zones:
those with D Ͻ 1.5, and those where D Ն 1.5. The transition between
these two zones is quite evident in all four experiments carried out
during this study. In the first experiment (Fig. 7.36), it occurred at
approximately 4.5 h in the test, whereas it occurred at 3.1 h for the
second experiment (Fig. 7.37), 3.2 h for the third (Fig. 7.38), and 4.1
h during the fourth (Fig. 7.39).
The switch from antipersistence, i.e., D Ͻ 1.5, to persistence, i.e.,
D Ͼ 1.5, was accompanied, in all four cases, by a permanent transi-
tion of E
corr
toward values that were more cathodic by approximately
80 to 100 mV. It was also accompanied by a sudden burst of electro-
chemical energy that could be picked up by a scanning platinum
probe with a commercial instrument, a Unican Instruments SRET.
The combination of a permanent cathodic shift of E
corr
and a pro-
longed period of persistence in the EN records have thus come to sig-
nify that a stable crevice situation had formed. The results obtained
with the SPD technique revealed another aspect of the EN that could
be useful for monitoring purposes: The results indicate that the tran-
sition from antipersistence to persistence was itself preceded by a
change in the level of stochasticity of the EN. In the cases of experi-
ments 2 and 3, the loss of stochasticity, i.e., when GF Ͻ 95 percent or
(1 Ϫ GF) Ͼ 5 percent, was quite focused, whereas it was much more
diffuse in experiments 1 and 4. This temporary loss of stochasticity
was interpreted as being indicative of the presence of chaotic fea-
tures caused by the presence of two relatively stable states, general
pitting and crevice corrosion. The chaotic nature of the voltage fluc-
tuations between these two states, as revealed by the SPD technique,
would give an early indication of the tendency to form a crevice.
552 Chapter Seven
0765162_Ch07_Roberge 9/1/99 5:41 Page 552
-0.1
-0.05
0
12345678
0.05
0.1
0.15
0.2
R/S analysis (0.1 x fractal dimension)
SPD analysis (1-GF/100)
Ecorr (V vs. SCE)
time (h)
0
Figure 7.36 First experiment with S30400 steel specimen with a crevice collar and in 0.01M FeCl
3
acidified to pH 2 and maintained at 60°C.
-0.15
-0.1
-0.05
0
12345678
0.05
0.1
0.15
0.2
Ecorr (V vs. SCE)
SPD analysis (1-GF/100)
R/S analysis (0.1 x fractal dimension)
time (h)
0
Figure 7.37 Second experiment with S30400 steel specimen with a crevice collar and in 0.01M
FeCl
3
acidified to pH 2 and maintained at 60°C.
553
0765162_Ch07_Roberge 9/1/99 5:41 Page 553
-0.2
-0.15
-0.1
-0.05
0
0.05
0.1
0.15
0.2
Ecorr (V vs. SCE)
time (h)
SPD analysis (1-GF/100)
R/S analysis (0.1 x fractal dimension)
012345678
-0.2
-0.15
-0.1
-0.05
0
0.05
0.1
0.15
0.2
Ecorr (V vs. SCE)
SPD analysis (1- GF/100)
R/S analysis (0.1 x fractal dimension)
time (h)
0
1
2
3
45678
Figure 7.38 Third experiment with S30400 steel specimen with a crevice collar and in 0.01M FeCl
3
acidified to pH 2 and maintained at 60°C.
Figure 7.39 Fourth experiment with S30400 steel specimen with a crevice collar and in 0.01M FeCl
3
acidified to pH 2 and maintained at 60°C.
554
0765162_Ch07_Roberge 9/1/99 5:41 Page 554
7.2.4 Field and service tests
In investigating an in-service failure, the analyst must consider a
broad spectrum of possibilities or reasons for its occurrence. Often a
large number of factors must be understood in order to determine the
cause of the original failure. The analyst is in the position of Sherlock
Holmes attempting to solve a baffling case. Like the great detective,
the analyst must carefully examine and evaluate all evidence avail-
able and prepare a hypothesis or a model of the chain of events that
could have caused the “crime.” If the failure can be duplicated under
controlled simulated service conditions in the laboratory, much can be
learned about how the failure actually occurred.
The salt spray test, for example, which was originally designed to test
coatings on metals, has been widely used to evaluate the resistance of
metals to corrosion in marine service or on exposed shore locations.
43,44
Extensive experience has shown that, although salt spray tests yield
results that are somewhat similar to those of exposure to marine envi-
ronments, they do not reproduce all the factors causing corrosion in
marine service. Salt spray tests should thus be considered to be arbi-
trary performance tests and their validity dependent on the extent to
which a correlation has been established between the results of the test
and the behavior under expected conditions of service. Despite the cur-
rent widespread use of continuous salt spray methods, their unrealistic
simulation of outdoor environments is a serious shortcoming.
The reviews made by F. L. LaQue on this subject indicate that the
salt spray test cannot realistically be used, for example, for parts with
complicated shapes. This deficiency is principally due to the fact that
the salt spray particles fall in vertical patterns, creating a strong ori-
entation dependency.
45,46
Another major inadequacy of the test is the
variable sensitivity of different metallic materials to the ions present
in various service environments. Since different metals also are affect-
ed differently by changes in the concentrations of salt solutions, the
salt spray test is not really appropriate for ranking different materials
in an order of relative resistance to salt water or salt air. The vari-
ability of the environments, even for seagoing equipment, is another
factor that is extremely difficult to reproduce in a laboratory. Before
attempting to simulate such natural environments, it is thus recom-
mended that the chemistry of the environment and all other parame-
ters controlling the corrosion mechanisms be monitored over time, in
a serious attempt to characterize the worst exposure conditions.
Further developments in accelerated testing should be based on
modern scientific principles and incorporate an appreciation of the
mechanisms of natural atmospheric degradation of the metal being
studied. The development of laboratory corrosion tests should be based
on a previous determination of the dominant corrosion factors. Even if
Acceleration and Amplification of Corrosion Damage 555
0765162_Ch07_Roberge 9/1/99 5:41 Page 555
the preferred practice is to design such tests to represent the most
severe conditions for the corrosion involved, it is still important to
investigate the kinetic component involved in environmental corrosion
in order to understand the causes and reasons for failure. With these
points in mind, it is useful to consider how the corrosion acceleration
may realistically be achieved. Increasing the concentration or corro-
siveness of the salt spray may not necessarily be appropriate during
cyclic testing, since even an initially dilute spray will, after a sufficient
number of cycles, result in the solubility of ionic species being exceed-
ed. Since the development of an accelerated testing program should
focus on the parameters which govern the lifetime behavior of the
materials being tested, it is important to establish a general frame-
work of the factors behind corrosion damage and, hence, behind con-
tinuous and cyclic cabinet testing.
The lack of correlation between corrosion rates measured during
conventional salt spray testing and during outdoor exposure to marine
environments and the drastic differences in the nature of the corrosion
products formed by these two types of tests have created a general
feeling that ASTM B 117 is not an appropriate test environment for
anything other than products intended for continuous immersion in
seawater environments. The mass loss results presented in Table 7.12
were obtained by Harper over 30 years ago on untreated and anodized
aluminum casting alloys exposed to a marine environment for 10 years
and in a salt spray test for 1500 h.
47
On some untreated specimens
(LM1M, LM4M, and LM5M), mass loss in the marine atmosphere was
approximately half of the mass loss measured with salt spray, while
for others (LM6M, LM14WP, and LM23P), very different results were
obtained. The results on anodized coatings did not correlate much bet-
ter, although the anodized specimens resisted the salt spray tests con-
sistently better than they did the marine environment.
556 Chapter Seven
TABLE 7.12 Mass Loss Comparison between Salt Spray Tests and Marine
Atmosphere Exposure Results
Untreated Anodized
Salt spray, Marine atmosphere, Salt spray, Marine atmosphere,
Alloy* g/1500 h g/10 years g/1500 h g/10 years
LM1M† 0.87 0.43 0.06 0.09
LM4M 0.34 0.18 0.02 0.09
LM5M 0.19 0.06 0 0.10
LM6M 0.05 0.12 0 0.04
LM14WP 0.14 0.25 0 0.06
LM23P 0.26 0.23 0.02 0.07
*British Standard aluminum casting alloy (BS 1490).
†M = as cast, W = solution, P = precipitation heat treatment.
0765162_Ch07_Roberge 9/1/99 5:41 Page 556
Selecting a test facility. There are many factors to consider when
selecting a weathering test station to conduct a test program. These
can be divided into two categories:
■
Location. An ideal test site should be located in a clean, pollution-
free area, if pollution is not deemed to be a parameter, within the
geoclimatic region to be used. This is important for the prevention of
unnatural effects on the specimens. Within the local area chosen,
there must be no isolated sources of pollution or deleterious atmo-
spheric contamination. This could result from construction, emis-
sions from a manufacturing plant, or chemical spraying in farming
areas. The layout of the test field itself is very important. The char-
acteristics of the test field will be determined by its location. For
example, if trees enclose the field, the test area will be affected by
mildew spores, will have lower sunlight levels, and possibly will
have lower temperatures. If the field is on low land and poorly
drained, it will flood in times of heavy rainfall, humidity will be
higher, and algae growth and dirt attachment will increase.
■
Maintenance. The exposure maintenance program followed by the
test site will also play a major role in determining the accuracy of
testing. It is important that the specimens on the test racks be cor-
rectly maintained. This involves ensuring that the mounting method
is correct and giving constant follow-up attention to maintain the
quality. The racks themselves are in contact with the specimens. The
racks must be cleaned regularly to remove any dirt, mildew, or algae
which would otherwise contaminate the specimens.
Types of exposure testing. As a general principle, the type of exposure
is selected to represent usage. Some of the possible types are as follows:
Direct weathering. For direct exposure, the specimen is mounted
on the exposure frame, open-backed or solid-backed, and subject to
all atmospheric effects. This type can be used at a number of expo-
sure angles. The standard angles used are 45°, 5°, and 90°, these
angles being referenced from a horizontal angle of 0°. The angle cho-
sen should be one that matches as closely as possible the position of
the end use of the material.
48
The racks should be cleaned on a reg-
ular basis to remove mildew and algae if these contaminant produc-
ers are present on the test site. Figure 7.40 is an aerial view of the
Kennedy Space Center beach corrosion test site, and Fig. 7.41 is a
ground view with a background view of the Shuttle.
58
Black box weathering. Black box exposure is used primarily to recre-
ate the exposure conditions of the horizontal surfaces of an automobile.
Acceleration and Amplification of Corrosion Damage 557
0765162_Ch07_Roberge 9/1/99 5:41 Page 557
558 Chapter Seven
The “box” creates an enclosed air space beneath the panels that form
the top surface of the box. The modified environment is similar to that
of a parked automobile. The black box can be used at a number of expo-
sure angles. However, for automotive testing, the black box is usually
placed at 5°. The box is typically made of aluminum painted black,
with the test panels forming the top surface. The black box also serves
to lower the panel temperature overnight to below that of the sur-
rounding air, creating a longer condensation period.
Under-glass weathering. This exposure technique places the speci-
men behind a glass-covered frame, protecting it from any direct
rainfall. The solar transmittance properties of the glass filter out a
significant amount of the harmful ultraviolet. This method is used
to test interior materials.
Tropical weathering. Tropical weathering involves a naturally
humid environment that accelerates fungal and algae growth at a sig-
nificantly faster rate than standard outdoor weathering. Since micro-
bial resistance is a very important characteristic of paints and paint
films, considerable attention has been given to developing a field test
that provides the optimal conditions for the accelerated growth of
Figure 7.40 Aerial view of the Kennedy Space Center beach corrosion test site.
0765162_Ch07_Roberge 9/1/99 5:41 Page 558
mildew and algae. In turn, companies that need to test their algicides
and fungicides in paint and paint films can do so in a much shorter
period of time. In these tests, specimens are exposed on a standard
aluminum frame with a vertical north orientation. Specimens should
ideally have a wood or Styrofoam substrate that will also allow for
water capillary action from the sample sitting on the test rack.
48
Optimizing test programs. The iterative process described as “experi-
mental design” consists of planning both the test variables and their
subsequent logical analysis. Applied to a corrosion problem, such a
process can combine modern scientific principles with an appreciation of
the mechanisms of degradation of the material being studied. The role
of experimental design in acquiring the knowledge of a process is illus-
trated in Fig. 7.42, where the loop emphasizes the iterative aspect of the
process, leading to increased knowledge of a system behavior. The main
idea behind experimental design is to minimize the number of steps
before an acceptable understanding becomes possible. One of the first
descriptions of an experimental design application to a corrosion situa-
tion estimated that such statistics could
49
Acceleration and Amplification of Corrosion Damage 559
Figure 7.41 Ground view of the Kennedy Space Center beach corrosion test site with a
background view of the Shuttle.
0765162_Ch07_Roberge 9/1/99 5:41 Page 559
■
Save time and money: Fewer experiments are required per firm
conclusion.
■
Simplify data handling: Data are digested in a readily reusable
form.
■
Establish better correlations: Variables and their effects are isolated.
■
Provide greater accuracy: The estimation of errors is the cornerstone
of statistical design.
As expressed in Fig. 7.42, the selection of an experimental strategy
should precede and influence data acquisition. It is indeed difficult, if
not impossible, to retrofit experiments to satisfy the statistical consid-
erations necessary for the construction of valid models. Any time spent
in preparing a test program is a good investment. The most important
consideration, at the initial planning stages, should be to integrate the
available information in order to limit future setbacks. For complex
situations, a good compromise is to employ what is called a screening
design technique. The purpose of running screening experiments is to
identify a small number of dominant factors, often with the intent of
conducting a more extensive and systematic investigation. An impor-
tant application of screening experiments is to perform ruggedness
tests that, once completed, will permit the control or limitation of envi-
ronmental factors or test conditions that can easily influence a test
program. There are, of course, many subtleties in designing experi-
ments that may intimidate a person who has limited familiarity with
statistics. But fortunately there are a growing number of software
560 Chapter Seven
Process
Data
Information
Knowledge
Statistical Design
Statistical Analysis
Insight, Experience
Figure 7.42 The experimental design loop for acquiring
knowledge of a process.
0765162_Ch07_Roberge 9/1/99 5:41 Page 560
packages that can guide and support a user in a friendly manner
through the process of designing experiments. The following examples
illustrate the application of such methodology to practical and complex
corrosion testing situations.
The selection of a cast superalloy. In this study, a series of cast Ni-base
␥/␥′ superalloys were systematically varied at selected levels of Co, Cr,
Mo, Ta, and Al, and the alloys’ weight change performance was moni-
tored.
50
A full factorial central experimental design was used, with five
sets of star points to completely map the response of these alloys. For
five elemental variables, 43 alloy compositions were required, and
regression analysis of the results permitted the production of a com-
plete second-degree equation describing the total variability of the
alloy performance.
Improved cosmetic corrosion test. As part of the efforts of the American
Iron and Steel Institute’s (AISI) Task Force on Automotive Corrosion,
a design of experiments (DOE) program was initiated. The aim of this
program was to study the effects of a number of carefully selected test
parameters on the performance of automotive steel sheet products
subjected to a cyclic corrosion test and to “on-vehicle” tests.
51
A review
of the literature guided the initial selection of seven test variables con-
sidered to be of major importance to the corrosion performance of auto-
motive steel. Triplicate 100-mm by 150-mm panels were exposed to
eight test runs designed according to a Plackett-Burman partial facto-
rial design. The results of these tests were to be used as a guide to
develop an improved test procedure.
Container material for nuclear waste disposal. In this project, a two-level
factorial design was adopted to map the effects of five factors (Cl
Ϫ
,
SO
4
2Ϫ
, NO
3
Ϫ
, F
Ϫ
, and temperature) on a candidate material for con-
tainers in the Yucca Mountain repository site.
52
The trial order was
randomized before testing, and a five-factor interaction was used to
block the experiments in terms of two different potentiostats used in
the study, in order to verify the instrumental variability. A complete
response surface of alloy 825 resistance to localized corrosion, esti-
mated by cyclic polarization, was produced as a function of environ-
mental variables.
Managing water chemistry. Experimental design was also used to study
mild steel under water conditions containing various scaling agents
and the addition of an organophosphorus inhibitor.
53
The corrosion
rates were measured in laboratory experiments using linear polariza-
tion, and mathematical models were generated relating the corrosion
behavior to solution flow rate and the concentrations of Ca
2ϩ
, Cl
Ϫ
,
HCO
3
Ϫ
, and the organic inhibitor. Two models were developed in this
Acceleration and Amplification of Corrosion Damage 561
0765162_Ch07_Roberge 9/1/99 5:41 Page 561
study; the first described the corrosion rates of mild steel, and the sec-
ond, the scaling tendencies of the water. These models were then vali-
dated with pilot cooling tower experiments.
Corrosivity in complex environments. Experimental design techniques
were also used to develop models for understanding the effects of com-
plex environments on materials considered for the operation of differ-
ent processes such as wood pyrolysis, gas desulfurization, and
continuous digestion.
54
In these studies, it was demonstrated that to
reduce the complexity of the environments (solution variables, con-
straints, etc.) to a manageable level, designed experiments are essen-
tial. When such studies are properly done, the results can be used to
predict the corrosion performance of alloys as a function of solution
composition. For the interested reader, reference 54 gives additional
details on the actual statistical procedures used for a few typical
designs for complex corrosion.
7.3 Surface Characterization
From an engineering materials viewpoint, the impact of corrosion on a
system is mostly a surface phenomenon, and the scientists and engi-
neers interested in fundamental corrosion processes have always been
among the first to explore the utility of surface analysis techniques.
Surface analysis is the use of microscopic chemical and physical probes
that give information about the surface region of a sample. The probed
region may be the extreme top layer of atoms, or it may extend up to
several microns beneath the sample surface, depending on the tech-
nique used. These techniques have been increasingly successful in
shedding light on many facets of corrosion mechanisms. Surface analy-
sis techniques are fundamentally destructive, since they generally
require that the sample be placed in an ultrahigh vacuum to prevent
contamination from residual gases in the analysis chamber. A rule of
thumb is that up to an atomic layer per second can be formed at pres-
sures of 10
Ϫ4
Pa if each collision of a gas molecule results in its sticking
to the surface.
55
Since surface analysis is an extremely specialized field,
it has its own nomenclature; the reader is referred to ASTM E 673,
Terminology Relating to Surface Analysis. Table 7.13 presents a repre-
sentative list of various techniques with their fundamental principles,
and Table 7.14 identifies the types of information and resolution that
they can produce.
56
The following list gives some of the common
acronyms used to describe some of the surface analysis techniques.
■
Auger electron spectroscopy (AES)
■
Electron spectroscopy for chemical analysis (ESCA)
562 Chapter Seven
0765162_Ch07_Roberge 9/1/99 5:41 Page 562
■
Field-emission auger electron spectroscopy (FE Auger)
■
Scanning auger microscopy (SAM)
■
Scanning probe microscopy (SPM)
■
Scanning tunnelling microscopy (STM)
■
Secondary electron microscopy (SEM)
■
Secondary ion mass spectrometry (SIMS)
■
Time-of-flight (TOF)
■
Ultraviolet photoelectron spectroscopy (UPS)
■
X-ray photoelectron spectroscopy (XPS)
Acceleration and Amplification of Corrosion Damage 563
TABLE 7.13 Surface Analytical Techniques with Typical Applications and Signal
Detected
Analytical technique Typical applications Signal detected
Auger Surface analysis, high-resolution Auger electrons from near-
depth profiling surface atoms
FE Auger Surface analysis, microanalysis, Auger electrons from near-
microarea depth profiling surface atoms
AFM/STM Surface imaging with near- Atomic-scale roughness
atomic resolution
Micro-FTIR Identification of polymers, Infrared absorption
organic films, liquids
XPS/ESCA Surface analysis of organic and Photoelectrons
inorganic molecules
HFS Hydrogen in thin films Forward-scattered
(quantitative) hydrogen atoms
RBS Quantitative thin-film Backscattered He atoms
composition and thickness
SEM/EDS Imaging and elemental Secondary and backscattered
microanalysis electrons and X-rays
FE SEM High-resolution imaging of Secondary and
polished precision cross sections backscattered electrons
FE SEM (in lens) Ultra-high-resolution imaging Secondary and
with unique contract mechanism backscattered electrons
SIMS Dopant and impurity depth Secondary ions
profiling, surface microanalysis
Quad SIMS Dopant and impurity depth Secondary ions
profiling, surface microanalysis,
insulators
TOF SIMS Surface microanalysis of Secondary ions, atoms,
polymers, organics molecules
0765162_Ch07_Roberge 9/1/99 5:41 Page 563
TABLE
7.14 Surface Analytical Techniques with Detection Characteristics
Analytical Elements Organic Detection Depth Imaging/ Lateral resolution
technique detected information limits resolution mapping (probe size)
Auger Li–U — 0.1–1 at% Ͻ2 nm Yes 100 nm
FE Auger Li–U — 0.01–1 at% 2–6 nm Yes Ͻ15 nm
AFM/STM — — — 0.01 nm Yes 1.5–5 nm
Micro-FTIR — Molecular groups 0.1–100 ppm — No 5 m
XPS/ESCA Li–U Chemical bonding 0.01–1 at% 1–10 nm Yes 10 m–2 mm
HFS H, D — 0.01 at% 50 nm No 2 mm ϫ 10 mm
RBS Li–U — 1–10 at% (Z Ͻ 20) 2 mm Yes
0.01–1 at% (20 Ͻ Z Ͻ 70)
0.001–0.01 at% (Z Ͼ 70)
SEM/EDS B–U — 0.1–1 at% 1–5 m (EDS) Yes 4.5 nm (SEM)
FE SEM — — — — Yes 1.5 nm
FE SEM (in lens) — — — — Yes 0.7 nm
SIMS H–U — ppb–ppm 5–30 nm Yes 1 m (imaging), 30
m (depth profiling)
Quad SIMS H–U — 10
14
–10
17
at/cm
3
Ͻ 5 nm Yes Ͻ5 mm (imaging), 30
m (depth profiling)
TOF SIMS H–U Molecular ions to Ͻ1 ppma, 10
8
at cm
Ϫ2
1 monolayer Yes 0.10 m
mass 10,000
564
0765162_Ch07_Roberge 9/1/99 5:41 Page 564
Some of these techniques require ultrahigh vacuum for the analy-
sis of interfaces and others do not. They all involve irradiating the
interface with a beam of photons, electrons, or ions and analyzing the
reflected beam to determine the chemical nature of the interface. For
any of these techniques, the conditions of the film must not change
drastically during the measurement. Many of the techniques used to
probe surfaces use a beam of ions to strike the surface and knock off
atoms of the sample material. These atoms are ionized and are iden-
tified and measured using a mass spectrometry technique. Other
techniques strike the surface with electrons (AES, EDS) or x-rays
(ESCA) and measure the resulting electron or photon emissions to
probe the sample. Measurements of the way high-energy helium
nuclei bounce off a sample can be used as a sensitive measure of
surface-layer composition and thickness (RBS). Surface structure on
a microscopic scale is observed by using electron microscopes (SEM),
optical microscopes, and atomic force or scanning probe microscopes
(AFM/SPM). One common way of characterizing surface analysis
techniques is by tabulating the incoming and outgoing particles.
These techniques can be classified according to whether they utilize
photons, electrons, or ions.
57
Surface analysis is mainly used in two separate modes. One is in
surface science, where the goal is to fundamentally understand the
causes of the problem and the mechanisms that are occurring in a sys-
tem. Usually a model system is picked to eliminate as many con-
founding variables as possible in order to get a system about which
firm conclusions can be drawn. Often, many different techniques will
be used on the same problem in order to illuminate as many facets as
possible of the problem. The other mode is failure analysis. The goal
here is to determine which of the failure modes is the most important
one for a particular failure. The samples are real and, hence, nonide-
al. This analysis mode is often used to identify the elements present,
their distribution pattern, and their oxidation state.
55
Auger electron spectroscopy and x-ray photoelectron spectroscopy
are probably the two surface analysis techniques that have found the
greatest use in corrosion-related work. One of the first applications of
surface analysis techniques to corrosion was an examination of the
composition of the passive film on stainless steel. This investigation
was undertaken to rationalize the substantial improvement in resis-
tance to pitting and acid solutions that is found when Mo and/or Si are
present in stainless steels. The AES results obtained in these early
studies challenged the generally accepted explanation of the mid-
1970s that the beneficial effects of Mo and Si were due to their enrich-
ment of the passive film. In fact, the AES results indicated that Mo
and Si were depleted in the film. There are basically two approaches
Acceleration and Amplification of Corrosion Damage 565
0765162_Ch07_Roberge 9/1/99 5:41 Page 565
in using surface-sensitive techniques to elucidate the mechanistic
details of the interfacial processes and determine the molecular nature
of the surface products, i.e., ex situ and in situ techniques. To investi-
gate the interfacial processes at the metal/liquid interface, one has to
resort to in situ techniques; however, one can use both in situ and ex
situ techniques for the characterization of the interphase.
7.3.1 General sensitivity problems
The problems of sensitivity and detection limits are common to all
forms of spectroscopy. In its simplest form, the question of sensitivity
boils down to whether it is possible to detect the desired signal above
the noise level. In virtually all surface studies, sensitivity is a major
problem. Consider the case of a sample with a surface of size 1 cm
2
with typically 10
15
atoms in the surface layer. In order to detect the
presence of impurity atoms present at the 1 percent level, a technique
must be sensitive to 10
13
atoms.
56
Contrast this with a spectroscopic
technique used to analyze a 1 cm
3
bulk liquid sample, typically con-
taining 10
22
molecules. The detection of 10
13
molecules in this sample
would require 1 part per billion (ppb) sensitivity, a level provided by
only a few techniques.
Assuming that a technique of sufficient sensitivity can be found,
another major problem that needs to be addressed in surface spec-
troscopy is distinguishing between signals from the surface and signals
from the bulk of the sample. To ensure that the surface signal is distin-
guishable (shifted) from the comparable bulk signal, either the detection
system must have sufficient dynamic range to detect very small signals
in the presence of neighboring large signals or the bulk signal must be
small compared to the surface signal, i.e., the vast majority of the detect-
ed signal must come from the surface region of the sample. It is the lat-
ter approach that is used by the majority of surface spectroscopic
techniques; such techniques can then be said to be surface-sensitive.
7.3.2 Auger electron spectroscopy
AES is the most commonly used surface technique on metal samples
because of the following advantages:
55
■
High surface sensitivity
■
Acceptable detectability for many corrosion problems
■
Simultaneous detection of all elements (except hydrogen and helium)
■
Very good small-area analysis (mapping)
■
Ability to probe deeper into the surface by sputter profiling
566 Chapter Seven
0765162_Ch07_Roberge 9/1/99 5:41 Page 566
■
Analysis time not excessively long
■
Readily available instrumentation
The Auger process gives electrons of characteristic energy for each
element, which are determined by the differences in energy of the
orbitals involved. In addition to the Auger electrons, there are also
much more plentiful secondary electrons with a broad energy distri-
bution that overlies the characteristic peaks. To highlight the charac-
teristic peaks, differentiation is performed on a plot of the number of
electrons emitted by the sample versus the energy of those electrons.
This results in a spectrum that ignores the more plentiful background
(secondary) electrons and emphasizes the characteristic electrons that
are used to identify the elements present. In some cases, the exact
peak shape and energy can be used to identify the oxidation state of
the elements present.
55
One of the attractions of Auger analysis is that it is quite surface-
sensitive, since an Auger spectrum typically represents information
about the composition of the top 0.5 to 2 nm of the surface, depending
upon the sample analyzed and the analysis conditions. Although
Auger electrons can be generated at depths of several micrometers
into the sample, the Auger electrons must be able to escape to the sur-
face without undergoing an inelastic collision in order to be detected.
Compilations of elemental spectra and charts of atomic number versus
electron energy are available to help assign peaks. Modern data pro-
cessing (background subtraction, peak fitting to standard spectra) has
made it possible to correctly resolve many peak-identification prob-
lems caused by peak overlap.
55
7.3.3 Photoelectron spectroscopy
Photoelectron spectroscopy utilizes photoionization and energy-dispersive
analysis of the emitted photoelectrons to study the composition and elec-
tronic state of the surface region of a sample. Traditionally, when the tech-
nique has been used for surface studies, it has been subdivided according
to the source of exciting radiation into
■
X-ray photoelectron spectroscopy, which uses soft (200 to 2000 eV)
x-ray excitation to examine core levels
■
Ultraviolet photoelectron spectroscopy, which uses vacuum UV (10
to 45 eV) radiation from discharge lamps to examine valence levels
Photoelectron spectroscopy is based upon a single photon-in/electron-
out process, and from many viewpoints this underlying process is much
simpler than the Auger process. In XPS the photon is absorbed by an
Acceleration and Amplification of Corrosion Damage 567
0765162_Ch07_Roberge 9/1/99 5:41 Page 567
atom in a molecule or solid, leading to ionization and the emission of
a core (inner-shell) electron. By contrast, in UPS the photon interacts
with valence levels of the molecule or solid, leading to ionization by
removal of one of these valence electrons. The kinetic energy distri-
bution of the emitted photoelectrons can be measured using any
appropriate electron energy analyzer, and a photoelectron spectrum
can thus be recorded. An alternative approach is to consider a one-
electron model along the following lines.
The realization that the energy of the ejected photon could be used to
determine the chemical state of an atom gave rise to the name ESCA
(electron spectroscopy for chemical analysis). Because x-ray photons
are necessary to generate the appropriate electrons, the technique is
also called x-ray photoelectron spectroscopy. XPS shares the Auger
characteristic of good surface sensitivity, since this is driven by the
same need for the electrons to be able to reach the detector unscathed.
It is possible to vary the depth of analysis in both techniques by vary-
ing the tilt angle with regard to the detector. This technique is used
more extensively in XPS, where it is often called angle-resolved depth
profiling. XPS also has the very important advantage that it can obtain
chemical state information on most atoms.
55
For each and every element, there will be a characteristic binding
energy associated with each core atomic orbital, i.e., each element will
give rise to a characteristic set of peaks in the photoelectron spectrum
at kinetic energies determined by the photon energy and the respec-
tive binding energies. The presence of peaks at particular energies
therefore indicates the presence of a specific element in the sample
under study, and the intensity of the peaks is related to the concen-
tration of the element within the sampled region.
56
7.3.4 Rutherford backscattering
Rutherford backscattering (RBS) is based on collisions between atomic
nuclei and derives its name from Lord Ernest Rutherford, who in 1911
was the first to present the concept of atoms having nuclei. It involves
measuring the number and energy of ions in a beam that scatters back
after colliding with atoms in the near-surface region of a sample at
which the beam has been targeted. With this information, it is possible
to determine atomic mass and elemental concentrations versus depth
below the surface. RBS is ideally suited for determining the concentra-
tion of trace elements that are heavier than the major constituents of
the substrate. Its sensitivity for light molecular masses and for the
makeup of samples well below the surface is poor.
56
When a sample is bombarded with a beam of high-energy particles,
the vast majority of the particles are implanted into the material and
568 Chapter Seven
0765162_Ch07_Roberge 9/1/99 5:41 Page 568
do not escape. This is because the diameter of an atomic nucleus is on
the order of 10
Ϫ6
nm while the spacing between nuclei is on the order
of 0.2 nm. A small fraction of the incident particles do undergo a direct
collision with a nucleus of one of the atoms in the upper few microme-
ters of the sample. This collision does not actually involve direct con-
tact between the projectile ion and the target atom. Energy exchange
occurs because of Coulomb forces between nuclei in close proximity to
each other. However, the interaction can be modeled accurately as an
elastic collision using classical physics.
56
The energy measured for a particle backscattering at a given angle
depends upon two processes. Particles lose energy as they pass
through the sample, both before and after a collision. The amount of
energy lost is dependent on the material’s stopping power. A particle
will also lose energy as the result of the collision itself. The collisional
loss depends on the masses of the projectile and the target atoms. The
ratio of the energy of the projectile before and after collision is called
the kinematic factor.
56
The number of backscattering events that occur
from a given element in a sample depend upon two factors: the con-
centration of the element and the effective size of its nucleus. The
probability that a material will cause a collision is called its scattering
cross section.
7.3.5 Scanning probe microscopy
(STM/AFM)
In the early 1980s, two IBM scientists, Binnig and Rohrer, developed
a new technique for studying surface structure, scanning tunneling
microscopy (STM). This invention was quickly followed by the devel-
opment of a whole family of related techniques which, together with
STM, may be classified in the general category of scanning probe
microscopy (SPM) techniques. Of these later techniques, the most
important is undoubtedly atomic force microscopy (AFM).
56
The
development of these techniques has without doubt been the most
important event in the surface science field in recent times, and has
opened up many new areas of science and engineering at the atomic
and molecular level. All of the SPM techniques are based upon scan-
ning a probe (typically called the tip in STM, since it literally is a
sharp metallic tip) just above a surface while monitoring some inter-
action between the probe and the surface. The interaction that is
monitored is:
In STM, the tunnelling current between the metallic tip and a con-
ducting substrate which are in very close proximity but not actually
in physical contact.
Acceleration and Amplification of Corrosion Damage 569
0765162_Ch07_Roberge 9/1/99 5:41 Page 569
In AFM, the van der Waals force between the tip and the surface;
this may be either the short-range repulsive force (in contact mode)
or the longer-range attractive force (in noncontact mode).
For the techniques to provide information on the surface structure at
the atomic level, the position of the tip with respect to the surface must
be very accurately controlled (to within about 0.1 Å) by moving either
the surface or the tip.
If the tip is biased with respect to the surface by the application of a
voltage between them, then electrons can tunnel between the two, pro-
vided that the separation of the tip and the surface is sufficiently
small; this gives rise to a tunneling current. The direction of current
flow is determined by the polarity of the bias. If the sample is biased
Ϫve with respect to the tip, then electrons will flow from the surface to
the tip, while if the sample is biased ϩve with respect to the tip, then
electrons will flow from the tip to the surface.
The name of the technique arises from the quantum mechanical tun-
neling-type mechanism by which the electrons can move between the tip
and the substrate. Quantum mechanical tunneling permits particles to
tunnel through a potential barrier which they could not surmount
according to the classical laws of physics; in this case, electrons are able
to traverse the classically forbidden region between the two solids. In
this model, the probability of tunneling is exponentially dependent upon
the distance of separation between the tip and the surface; the tunneling
current is therefore a very sensitive probe of this separation. Imaging of
the surface topology may then be carried out in one of two ways:
■
In constant-height mode, the tunneling current is monitored as the
tip is scanned parallel to the surface.
■
In constant-current mode, the tunneling current is maintained con-
stant as the tip is scanned across the surface.
If the tip is scanned at what is nominally a constant height above the
surface, there is actually a periodic variation in the separation distance
between the tip and the surface atoms. At one point the tip will be direct-
ly above a surface atom and the tunneling current will be large, where-
as at other points the tip will be above hollow sites on the surface and the
tunneling current will be much smaller. In practice, however, the normal
way of imaging the surface is to maintain the tunneling current constant
while the tip is scanned across the surface. This is achieved by adjusting
the tip’s height above the surface so that the tunneling current does not
vary with the lateral tip position. In this mode, the tip will move slight-
ly upward as it passes over a surface atom and, conversely, move slight-
ly in toward the surface as it passes over a hollow.
570 Chapter Seven
0765162_Ch07_Roberge 9/1/99 5:41 Page 570
7.3.6 Secondary electron microscopy and
scanning Auger microscopy
The two forms of electron microscopy which are commonly used to pro-
vide surface information are secondary electron microscopy (SEM),
which provides a direct image of the topographical nature of the surface
from all the emitted secondary electrons, and scanning Auger microscopy
(SAM), which provides compositional maps of a surface by forming an
image from the Auger electrons emitted by a particular element.
56
SEM. As the primary electron beam is scanned across the surface, elec-
trons with a wide range of energies will be emitted from the surface in
the region where the beam is incident. These electrons will include
backscattered primary electrons and Auger electrons, but the vast major-
ity will be secondary electrons formed in multiple inelastic scattering
processes (these are the electrons that contribute to the background and
are completely ignored in Auger spectroscopy). The secondary electron
current reaching the detector is recorded, and the microscope image con-
sists of a “plot” of this current I against probe position on the surface. The
contrast in the micrograph arises from several mechanisms, but first and
foremost from variations in the surface topography. Consequently, the
secondary electron micrograph is virtually a direct image of the real sur-
face structure.
55
The attainable resolution of the technique is limited by the mini-
mum spot size that can be obtained with the incident electron beam,
and ultimately by the scattering of this beam as it interacts with the
substrate. With modern instruments, a resolution of better than 5 nm
is achievable. This is more than adequate for imaging semiconductor
device structures, for example, but is insufficient to enable many sup-
ported metal catalysts to be studied in any detail.
Although not a true surface technique, SEM-EDS (energy dispersive
spectrometer) often provides useful information concerning surface cor-
rosion mechanisms. The ubiquitous nature, low cost, and ease of use of
this technique cause it to be used as a tool in many failure analyses
involving corrosion. Because its analysis depth is much larger (approx-
imately a micrometer) than that of the true surface techniques, it is not
necessary to analyze samples that are high-vacuum-compatible. As a
result, almost no sample preparation is needed for many different
kinds of samples.
The sample is scanned with a high-energy (typically 5 to 30 keV) elec-
tron beam in a raster pattern which causes the ejection of a number of
particles, including secondary electrons, backscattered electrons, and
x-rays. Secondary electrons (with energies less than 50 eV) are
detectable only if they are generated in the top surface of a sample; this
Acceleration and Amplification of Corrosion Damage 571
0765162_Ch07_Roberge 9/1/99 5:41 Page 571
causes the secondary electron output to be responsive to topographical
detail and therefore gives an image that is remarkably similar to that
seen with an optical microscope. Added advantages are greater magni-
fication and depth of field. The contrast in backscattered electron
images is mainly dependent on atomic number, so these images provide
rough elemental distribution information.
55
Element identification is provided by analysis of the characteristic
x-rays that are emitted with an energy dispersive spectrometer.
Quantification can be quite good if appropriate standards are used.
The x-ray detector can be set to detect and count only x-rays that have
energies within a narrow range. This output can then be used to gen-
erate elemental distribution maps, or line scans. Newer detectors with
ultrathin windows can easily detect all elements with an atomic num-
ber of 5 (boron) or greater.
SAM. With this technique, the incident primary electrons cause ion-
ization of atoms within the region illuminated by the focused beam.
Subsequent relaxation of the ionized atoms leads to the emission of
Auger electrons characteristic of the elements present in this part of
the sample surface. As with SEM, the attainable resolution is ulti-
mately limited by the incident beam characteristics. More significant-
ly, however, the resolution is also limited by the need to acquire
sufficient Auger signal to form a respectable image within a reason-
able time period, and for this reason the instrumental resolution
achievable rarely approaches 20 nm.
7.3.7 Secondary ion mass spectroscopy
Secondary ion mass spectroscopy is the third of the three most com-
mon surface analysis techniques. In SIMS, the sample is irradiated
with a primary ion beam (normally argon), the impact of which sput-
ters away the surface atoms, some as neutrals and others as ions.
Those atoms which become ionized are then detected in a mass spec-
trometer, where their masses are measured.
SIMS is the most sensitive of all the commonly employed surface
analytical techniques. This is because of the inherent sensitivity asso-
ciated with mass spectrometric–based techniques. There are a number
of different variants of the technique:
56
■
Static SIMS, used for submonolayer elemental analysis
■
Dynamic SIMS, used for obtaining compositional information as a
function of depth below the surface
■
Imaging SIMS, used for spatially resolved elemental analysis
572 Chapter Seven
0765162_Ch07_Roberge 9/1/99 5:41 Page 572
These variations are all based on the same basic physical process,
and it is this process which is discussed here, together with a brief
introduction to the field of static SIMS. In SIMS, the surface of the
sample is subjected to bombardment by high-energy ions; this leads to
the ejection (or sputtering) of both neutral and charged (ϩ/Ϫ) species
from the surface. The ejected species may include atoms, clusters of
atoms, and molecular fragments.
In traditional SIMS, it is only the positive ions that are mass ana-
lyzed. This is primarily for practical ease, but it does lead to problems
with quantifying the compositional data, since the positive ions are
but a small, nonrepresentative fraction of the total sputtered species.
It should be further noted that the displaced ions have to be energy fil-
tered before they are mass analyzed (i.e., only ions with kinetic ener-
gies within a limited range are mass analyzed). The most commonly
employed incident ions used for bombarding the sample are argon ions
(Ar
ϩ
), but other ions have been used in some applications.
56
The mass
analyzer is typically a quadrupole mass spectroscopy analyzer with
unit mass resolution, but high-specification time-of-flight (TOF) ana-
lyzers are also used and provide substantially higher sensitivity and a
much greater mass range (albeit at a higher cost).
In static SIMS (SSIMS), the aim is to obtain sufficient signal to pro-
vide compositional analysis of the surface layer without actually
removing a significant fraction of a monolayer, i.e., to be able to ana-
lyze less than 10
14
atoms or molecules, or approximately 10 percent of
a monolayer, for a 1-cm
2
sample. The technique is then capable of pro-
viding information about the topmost single atomic layer of the sur-
face. In dynamic SIMS, which is more common, a high-energy ion
beam removes layers of the surface. The beam is so energetic that lit-
tle chemical information is retained, since the vast majority of any
molecular species is fragmented. Although destroying the surface obvi-
ously prevents its reexamination, it is not a total disadvantage, since
it allows depth profiling to occur naturally.
Some of the advantages of SIMS are that it has a very low detection
limit and that it can detect all elements. These advantages make it
able to address many problems that neither AES nor XPS is suitable
for. Reasonably small (micrometer or smaller) spot sizes allow ele-
mental mapping. A major disadvantage of SIMS is that there is a very
great range of ionization rates for different elements. Furthermore,
the rates will vary depending upon the other species present (matrix
effects). A beam of either positive or negative ions can be used as the
exciting beam, with very different response factors. The biggest differ-
ences are found with the very electronegative halogens and the elec-
tropositive alkali metals.
55
Acceleration and Amplification of Corrosion Damage 573
0765162_Ch07_Roberge 9/1/99 5:41 Page 573
References
1. Ijseling, F. P., General Guidelines for Corrosion Testing of Materials for Marine
Applications, London, The Institute of Materials, 1989.
2. Lloyd, D. K., and Lipow, M., Reliability: Management, Methods and Mathematics,
Milwaukee, Wisc., The American Society for Quality Control, 1984.
3. Erlings, J. G., de Groot, H. W., and Nauta J., The Effect of Slow Plastic and Elastic
Straining on Sulphide Stress Cracking and Hydrogen Embrittlement of 3.5% Ni
Steel and API 5L X60 Pipeline Steel, Corrosion Science, 27:1153–1167 (1987).
4. Baboian, R., Corrosion Tests and Standards, Philadelphia, American Society for
Testing and Materials, 1995.
5. Lyon, S. B., Thompson, G. E., and Johnson, J. B., in Agarwala, V. S., and Ugiansky,
G. M. (eds.), New Methods for Corrosion Testing of Aluminum Alloys, Philadelphia,
American Society for Testing and Materials, 1992, pp. 20–31.
6. Treseder, R. S., Haynes, G. S., and Baboian, R. (eds.), Laboratory Corrosion Tests
and Standards, Philadelphia, American Society for Testing and Materials, 1985, pp.
5–23.
7. Mapes, R. S., and Berkey, W. W., X-Ray Diffraction Methods for the Analysis of
Corrosion Products, in Ailor, W. H. (ed.), Handbook on Corrosion Testing and
Evaluation, New York, John Wiley and Sons, 1971, pp. 697–730.
8. Lenard, D. R., Moores, J. G., Roberge, P. R., and Halliop, E., “The Use of
Electrochemical Impedance Spectroscopy to Predict the Corrosion of Aluminum-
Lithium Alloys in Marine Environments,” AGARD CP-565, in AGARD Conference
Proceedings: Corrosion Detection and Management of Advanced Airframe Materials,
Hull, Canada, Canada Publication Group, 1995, pp. 8-1–8-12.
9. Schra, L. and Groep, F. F., The ASCOR Test: A Simple Automated Method for Stress
Corrosion Testing of Aluminum Alloys, Report NLR-TP-91438-U, 22, Amsterdam,
Netherlands, National Aerospace Laboratory, 1991.
10. Freeman, R. A., and Silverman, D. C., Error Propagation in Coupon Immersion
Tests, Corrosion, 48:463–466 (1992).
11. Baker, S. V., Lyon, S. B., Thompson, G. E., et al., in Agarwala, V. S., and Ugiansky,
G. M. (eds.), New Methods for Corrosion Testing of Aluminum Alloys, Philadelphia,
American Society for Testing and Materials, 1992, pp. 32–49.
12. Roberge, P. R., Yousri, S., and Halliop, E., Potentiodynamic Polarization and
Impedance Spectroscopy for the Statistical Process Control of Aluminum Anodizing,
in Silverman, D. C., Kendig, M. W., and Scully, J., (eds.), Electrochemical Impedance:
Analysis and Interpretation, STP 1188, Philadelphia, American Society for Testing
and Materials, 1993, pp. 313–329.
13. Roberge, P. R., and Halliop, E., An Alternate Electrochemical Procedure for the
Testing of Anodized Aluminum, in Haynes, G. S., and Tellefsen, K. (eds.), Cyclic
Cabinet Corrosion Testing, STP 1238, Philadelphia, American Society for Testing
and Materials, 1995, pp. 49–58.
14. Roberge, P. R., and Ash, P., The Anodic Breakthrough Method for Testing Anodized
Aluminum, Metal Finishing, 93:22–25 (1995).
15. Yousri, S., and Tempel, P., Plating and Surface Finishing, 74:36–43 (1987).
16. Jirnov, A. D., and Karimova, S. N., “Some Peculiarities of Al-Li Alloys Corrosion
Behavior,” 2(Sixth), International Aluminium-Lithium Conference, Garmisch-
Partenkirchen, 1991, pp. 825–829.
17. Roberge, P. R., and Lenard, D. R., The Evaluation of Marine Corrosion Resistance of
Aluminum and Aluminum-Lithium Alloys, Corrosion Reviews, 15:631–645 (1997).
18. Kane, R. D., High-Temperature and High Pressure, in Baboian, R. (ed.), Corrosion
Tests and Standards, Philadelphia, American Society for Testing and Materials,
1995, pp. 106–115.
19. Andresen, P. L., “Effects of Testing Characteristics on Observed SCC Behavior in
BWRs,” in Corrosion 98, Houston, Tex., NACE International, 1998, Paper # 137.
20. Van Orden, A. C., “Applications and Problem Solving Using the Polarization
Technique,” in Corrosion 98, Houston, Tex., NACE International, 1998, Paper # 301.
574 Chapter Seven
0765162_Ch07_Roberge 9/1/99 5:41 Page 574
21. Grauer R., Moreland, P. J., and Pini, G., A Literature Review of Polarisation
Resistance Constant (B) Values for the Measurement of Corrosion Rate, Houston,
Tex., NACE International, 1982.
22. Silverman, D. C., “Tutorial on Cyclic Potentiodynamic Polarization Technique,” in
Corrosion 98, Houston, Tex., NACE International, Paper # 299.
23. Zeller, R. L., III, and Savinell, R. F., Corrosion Science, 26:591 (1986).
24. Epelboin, I., Keddam, M., and Takenouti, H., Journal of Applied Electrochemistry,
2:71 (1972)
25. Boukamp, B. A., Equivalent Circuit (Equivcrt.PAS) Users Manual, Report
CT89/214/128, The Netherlands, University of Twente, 1989.
26. Hladky, K., Callow, L. M., and Dawson, J. L., British Corrosion Journal, 15:20
(1980).
27. de Levie, R., Advances in Electrochemistry and Electrochemical Engineering, 1969.
28. Silverman, D. C., Corrosion, 47:87 (1991)
29. Mansfeld, F., and Shih, H., Journal of the Electrochemical Society, 135:1171 (1988).
30. Urquidi-MacDonald, M., and Egan, P. C., Validation and Extrapolation of
Electrochemical Impedance Spectroscopy Data Analysis, Corrosion Reviews, 15:
(1997).
31. Iverson, W. P., Journal of the Electrochemical Society, 115:617 (1968).
32. Kearns, J. R., Scully, J. R., Roberge, P. R., et al., Electrochemical Noise Measurement
for Corrosion Measurements, Philadelphia, American Society for Testing and
Materials, 1996.
33. Hladky, K., and Dawson, J. L., Corrosion Science, 21:317
(1981).
34. Searson, P. C., and Dawson, J. L., Journal of the Electrochemical Society,
135:1908–1915 (1988).
35. Peitzen, H. O., and Saupe, D., The Science of Fractal Images, New York, Springer-
Verlag, 1988.
36. Mandelbrot, B. B., and Van Ness, J. W., SIAM Review, 10:422 (1968).
37. Fan, L. T., Neogi, D., and Yashima, M., Elementary Introduction to Spatial and
Temporal Fractals, Berlin, Springer-Verlag, 1991.
38. Hurst, E. H., Methods of Using Long-term Storage in Reservoirs, Proceedings of the
Institute of Civil Engineering, 5 (Part I):519 (1956).
39. Mandelbrot, B. B., and Wallis, J. R., Water Resources Research, 5:321 (1969).
40. Feder, J., Fractals, New York, Plenum, 1988.
41. Roberge, P. R., The Analysis of Spontaneous Electrochemical Noise by the Stochastic
Process Detector Method, Corrosion, 50:502 (1994).
42. Roberge, P. R., Trethewey, K. R., Marsh, D. J., et al., Application of Fractals to the
Analysis of Electrochemical Noise in 304 Stainless Steel, in LeMay, I., Mayer, P.,
Roberge, P. R., et al. (eds.), Materials Performance, Maintenance and Plant Life
Assessment, Montréal, The Canadian Institute of Mining, Metallurgy and
Petroleum, 1994, pp. 47–56.
43. Capp, J. A., A Rational Test for Metallic Protective Coatings, Proceedings of the
American Society for Testing and Materials, 14:474–481 (1914).
44. Finn, A. N., Method of Making the Salt-Spray Corrosion Test, Proceedings of the
American Society for Testing and Materials, 18:237–238 (1918).
45. LaQue, F. L., Marine Corrosion: Causes and Prevention, New York, John Wiley and
Sons, 1975.
46. LaQue, F. L., Materials & Methods, 35:77–81 (1952).
47. Harper, R., Metal Industry, 99:454–458 (1961).
48. Sub-Tropical Testing Service, 1999.
49. Twitchell, S. B., and Lackmeyer, P. J., Experimental Design in Corrosion Control,
Materials Performance, 14:14 (1975).
50. Barrett, C. A., “The Effects of Cr, Co, Al, Mo and Ta on the Cyclic Oxidation Behavior
of a Prototype Cast Ni-Base Superalloy Based on a 25 Composite Statistically
Designed Experiment,” in Conference on High Temperature Corrosion Energy
Systems, Detroit, The Metallurgical Society/AIME, 1984, pp. 667–680.
51. Roudabush, L. A., Towsend, H. E., and McCune, D. C., “Update on the Development
of an Improved Cosmetic Corrosion Test by the Automotive and Steel Industries,”
Acceleration and Amplification of Corrosion Damage 575
0765162_Ch07_Roberge 9/1/99 5:41 Page 575