Encyclopedic Dictionary of International Finance and Banking Phần 9 ppsx
Bạn đang xem bản rút gọn của tài liệu. Xem và tải ngay bản đầy đủ của tài liệu tại đây (486.6 KB, 34 trang )
262
STRIKE PRICE
See EXERCISE PRICE.
STRIPPED BONDS
Bonds created by stripping the coupons from a bond and selling them separately from the
principal.
STRONG DOLLAR
See APPRECIATION OF THE DOLLAR.
SUBPART F INCOME
A type of foreign income, as defined in the U.S. tax code, which under certain conditions is
taxed by the IRS in the United States whether or not it is remitted back to the United States.
SUCRE
Ecuador’s currency.
SUSHI BONDS
Eurodollars-, or other non-yen-denominated bonds issued by a Japanese firm for sale to
Japanese investors.
SWAP CONTRACT
In the context of the forward market, a swap contract is a spot contract immediately combined
with a forward contract.
See also SWAP RATE.
SWAP FUNDS
Also known as
exchange funds
, swap funds are not the same as ordinary mutual funds. They
are highly specialized types of fixed investment pools, typically set up as a limited partnership
or as a limited-liability company. They appeal to very wealthy investors with large holdings
in a single stock who want diversification without having to pay capital taxes.
Suppose you own $5 million of stock in one company that you bought a long time ago
at prices far below today’s values. Instead of selling these shares outright and paying taxes,
you swap them for units of a swap fund, tax-free. Swap funds usually have stiff early-
redemption penalties and very high minimum investment requirements. In one fund, for
example, the minimum investment is $500,000 of stock.
SWAP RATE
A forward exchange rate quotation expressed in terms of the number of points by which the
forward rate differs from the spot rate (i.e., as a discount from, or a premium on, the
spot rate
).
The interbank market quotes the forward rate this way.
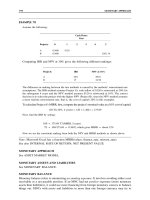
EXAMPLE 113
Suppose a French investor buys $100,000 at FFr 140/$. In order to reduce the currency risk, she
immediately sells forward $100,000 for 90 days, at FFr 145/$. The combined spot and forward
contract is a swap contract. The swap rate, FFr 5/$, is the difference between the rate at which
the investor buys and the rate at which she sells.
See also FORWARD RATE QUOTATIONS; OUTRIGHT RATE.
STRIKE PRICE
SL2910_frame_CS.fm Page 262 Thursday, May 17, 2001 9:13 AM
263
SWAPS
A swap is the exchange of assets or payments. It is a simultaneous purchase and sale of a
given amount of securities, with the purchase being effected at once and the sale back to the
same party to be carried out at a price agreed upon today but to be completed at a specified
future date. Swaps are basically of two types:
interest rate swaps
and
currency swaps
. Interest
rate swaps typically involve exchanging fixed interest payments for floating interest payments.
Currency swaps are the exchange of one currency into another at an agreed rate, combining
a spot and forward contract in one deal.
See also BANK SWAPS; CURRENCY SWAP; INTEREST RATE SWAPS; PLAIN-VANILLA
SWAPS.
SWAP TRANSACTION
A swap transaction is a combination of a spot deal with a reversal deal at some future date.
A common type of
swap
is “spot against forward.” For example, a bank in the interbank
market buys a currency in the spot market and simultaneously sells the same amount in the
forward market to the same bank. The difference between the spot and the forward rates,
called the
swap rate
, is known and fixed.
See also SWAP RATE.
SYNTHETIC CROSS RATES
Synthetic cross rates are cross bid and ask rates that result from a combination of two or
more other exchange transactions.
EXAMPLE 114
Given:
The synthetic bid and ask DM/£ rates can be determined as follows:
First, find the right dimension of the rate. The dimension of the rate we are looking for is DM/£.
Because the dimensions of the two quotes given to us are DM/$ and $/£. The way to obtain the
synthetic rate is to multiply the rates, as follows:
Synthetic DM/£
=
DM/$
×
$/£
Second, let us now think about bid and ask synthetic quotes. To synthetically buy £ against DM,
we first buy $ against DM, that is, at the higher rate (ask); then we buy £ against $, again at the
higher rate (ask).
Thus, we can synthetically buy £1 at DM 3.397405. By a similar argument, we can obtain the
rate at which we can synthetically sell £ against DM.
DM/$ 2.4520 2.4530–
$/£ 1.3840 1.3850–
Synthetic DM/£
ask
DM/$
ask
$/£
ask
×=
2.4530 1.3850×= 3.397405.=
Synthetic DM/£
bid
DM/$
bid
$/£
bid
×=
2.4520 1.3840×= 3.393568.=
SYNTHETIC CROSS RATES
SL2910_frame_CS.fm Page 263 Thursday, May 17, 2001 9:13 AM
264
Thus, the synthetic rates are DM/£ 3.393568—3.397405.
Note: This example is the first instance of the Law of the Worst Possible Combination or the Rip-
Off Rule. For any single transaction, the bank gives you the worst rate from your point of view
(this is how the bank makes money). It follows that if you make a sequence of transactions, you
will inevitably get the worst possible cumulative outcome. This law is the first fundamental law
of real-world capital markets.
EXAMPLE 115
Given:
This example differs from Example 114 because it involves a quotient rather than a product.
However, in this case, too, we end up with the worst possible outcome.
The synthetic bid and ask DM/£ rates can be determined as follows:
First, from the dimensions of the quote we are looking for and the dimensions of the two
quotes that are given to us, we need to divide DM/$ by £/$:
To identify where to use the bid and where to use the ask rate, we could explicitly go through the
two transactions. The simpler way is to ask the bank to convert the £/$ quote into $/£. This transforms
the problem into the problem we have already solved. The bank will gladly oblige and quote:
We can then simply feed these formulas into the solutions of Example 114, and obtain:
Thus, the synthetic rates are DM/£ 3.6790 − 3.6857.
Note: In this example, to get the correct DM/£ quote, we need to divide the DM/$ quote by the
£/$ quote. Thus, to obtain the largest possible outcome (the synthetic DM/£ ask rate), we divide
the larger number by the smaller; and to obtain the smallest possible outcome (the DM/£ bid
rate), we divide the smaller number by the larger. This illustrates the Law of the Worst Possible
Combination.
SYSTEMATIC RISK
Also called nondiversifiable, or noncontrollable risk, this risk that cannot be diversified away
results from forces outside a firm’s control. Purchasing power, interest rate, and market risks fall
in this category. This type of risk is assessed relative to the risk of a diversified portfolio of
securities or the market portfolio. It is measured by the beta coefficient used in the Capital Asset
Pricing Model (CAPM). The systematic risk is simply a measure of a security’s volatility relative
to that of an average security. For example, b = 0.5 means the security is only half as volatile,
or risky, as the average security; b = 1.0 means the security is of average risk; and b = 2.0 means
the security is twice as risky as the average risk. The higher the beta, the higher the return required.
DM/$ 2.3697 2.3725–
£$⁄ 0.64371 0.64412–
Synthetic DM/£
DM/$
$/£
=
Synthetic $/£
bid
1/£/$
ask
=
Synthetic $/£
ask
1/£/$
bid
=
Synthetic DM/£
ask
DM/$
ask
$/£
bid
2.3725
0.64371
3.6857===
Synthetic DM/£
bid
DM/$
bid
$/£
ask
2.3697
0.64412
3.6790===
SYSTEMATIC RISK
SL2910_frame_CS.fm Page 264 Thursday, May 17, 2001 9:13 AM
265
T
TARGET-ZONE ARRANGEMENT
Target-zone arrangement is an international monetary arrangement in which countries vow
to maintain their exchange rates within a specific band around agreed-upon, fixed, central
exchange rates.
TAX ARBITRAGE
Tax arbitrage is a form of arbitrage that involves the shifting of gains or losses from one tax
authority to another to profit from tax rate differences.
TAX EXPOSURE
Tax exposure is the extent to which an MNC’s tax liability is affected by fluctuations in
foreign exchange values. As a general rule, only realized gains or losses affect the income
tax liability of a company. Translation losses or gains are normally not realized and are not
taken into account in tax liability. Some steps taken to reduce exposure, such as entering into
forward exchange contracts, can create losses or gains that enter into tax liability. Other
measures that can be taken have no income tax implications.
TECHNICAL ANALYSIS
As the antithesis of
fundamental analysis
, technical analysis concentrates on past price and
volume movements—while totally disregarding economic fundamentals—to forecast a secu-
rity price or currency rates. The two primary tools of technical analysts are charting and key
indicators. Charting means plotting on a graph the stock’s price movement over time. For
example, the security may have moved up and down in price, but remained within a band
bounded by the lower limit (support level) and the higher limit (resistance level). Key
indicators of market and security performance include trading volume, market breadth, mutual
fund cash position, short selling, odd-lot theory, and the Index of Bearish Sentiment.
See also FUNDAMENTAL ANALYSIS; TECHNICAL FORECASTING.
TECHNICAL FORECASTING
Technical forecasting involves the use of historical exchange rates to predict future values.
For example, the fact that a given currency has increased in value over four consecutive days
may provide an indication of how the currency will move tomorrow. It is sometimes conducted
in a judgmental manner, without statistical analysis. Often, however, statistical analysis is
applied in technical forecasting to detect historical trends. For example, a computer program
can be developed to detect particular historical trends. There are also time series models that
examine moving averages. Some develop a rule, such as, “The currency tends to decline in
value after a rise in moving average over three consecutive periods.”
Technical forecasting of exchange rates is similar to technical forecasting of stock prices.
If the pattern of currency values over time appears random then technical forecasting is not
appropriate. Unless historical trends in exchange rate movements can be identified, exami-
nation of past movements will not be useful for indicating future movements. Technical
factors have sometimes been cited as the main reason for changing speculative positions that
cause an adjustment in the dollar’s value. For example, the
Wall Street Journal
frequently
summarizes the dollar movements on particular days as shown below.
SL2910_frame_CT.fm Page 265 Thursday, May 17, 2001 9:14 AM
266
These examples suggest that technical forecasting appears to be widely used by speculators
who frequently attempt to capitalize on day-to-day exchange rate movements. Technical
forecasting models have helped some speculators in the foreign exchange market at various
times. However, a model that has worked well in one particular period will not necessarily
work well in another. With the abundance of technical models existing today, some are bound
to generate speculative profits in any given period.
Most technical models rely on the past to predict the future. They try to identify a historical
pattern that seems to repeat and then try to forecast it. The models range from a simple moving
average to a complex auto regressive integrated moving average (ARIMA). Most models try
to break down the historical series. They try to identify and remove the random element. Then
they try to forecast the overall trend with cyclical and seasonal variations. A moving average
is useful to remove minor random fluctuations. A trend analysis is useful to forecast a long-
term linear or exponential trend. Winter’s seasonal smoothing and Census XII decomposition
are useful to forecast long-term cycles with additive seasonal variations. ARIMA is useful to
predict cycles with multiplicative seasonality. Many forecasting and statistical packages such
as
Forecast Pro, Sibyl/Runner, Minitab, SPSS
, and
SAS
can handle these computations.
See also FOREIGN EXCHANGE RATE FORECASTING; FUNDAMENTAL FORECASTING.
TED SPREAD
The yield spread between U.S. Treasury bills and Eurodollars.
TEMPORAL METHOD
The temporal method translates assets valued in a foreign currency into the home currency
using the exchange rate that exists when the assets are purchased. It is essentially the same
as the
monetary-nonmonetary method
except in the treatment of physical assets that have
been revalued. It applies the current exchange rate to all financial assets and liabilities, both
current and long term. Physical, or nonmonetary, assets valued at historical cost are translated
at historical rates. Because the various assets of a foreign subsidiary will in all probability
be acquired at different times and exchange rates seldom remain stable for long, different
exchange rates will probably have to be used to translate those foreign assets into the
multinational’s home currency. Consequently, the MNC’s balance sheet may not balance.
EXAMPLE 116
Consider the case of a U.S. firm that on January 1, 20X1, invests $100,000 in a new Japanese
subsidiary. The exchange rate at that time is $1
=
¥100. The initial investment is therefore ¥10
million, and the Japanese subsidiary’s balance sheet looks like this on January 1, 20X1.
Date
Status of
Dollar Explanation
Oct. 14, 1999 Weakened Technical factors overwhelmed economic news
Nov. 18, 1999 Weakened Technical factors triggered sales of dollars
Dec. 16, 1999 Weakened Technical factors triggered sales of dollars
Apr. 14, 2000 Strengthened Technical factors indicated that dollars had been recently
oversold, triggering purchase of dollars
Yen Exchange Rate U.S. Dollars
Cash 10,000,000 ($1
=
¥100) 100,000
Owners’ equity 10,000.000 ($1
=
¥100) 100,000
TED SPREAD
SL2910_frame_CT.fm Page 266 Thursday, May 17, 2001 9:14 AM
267
Assume that on January 31, when the exchange rate is $1
=
¥95, the Japanese subsidiary invests
¥5 million in a factory (i.e., fixed assets). Then on February 15, when the exchange rate in $1
=
¥90, the subsidiary purchases ¥5 million of inventory. The balance sheet of the subsidiary will
look like this on March 1, 20X1.
As can be seen, although the balance sheet balances in yen, it does not balance when the temporal
method is used to translate the yen-denominated balance sheet tables back into dollars. In
translation, the balance sheet debits exceed the credits by $8,187. How to cope with the gap
between debits and credits is an issue of some debate within the accounting profession. It is
probably safe to say that no satisfactory solution has yet been adopted.
A. Current U.S. Practice
U.S based MNCs must follow the requirements of
Statement 52
, “Foreign Currency Trans-
lation,” issued by the U.S. Financial Accounting Standards Board (FASB) in 1981. Under
Statement 52
, a foreign subsidiary is classified either as a self-sustaining, autonomous subsidiary
or as
integral
to the activities of the parent company. According to
Statement 52
, the local
currency of a self-sustaining foreign subsidiary is to be its functional currency. The balance
sheet for such subsidiaries is translated into the home currency using the exchange rate in effect
at the end of the firm’s financial year, whereas the income statement is translated using the
average exchange rate for the firm’s financial year. On the other hand, the functional currency
of an integral subsidiary is to be U.S. dollars. The financial statements of such subsidiaries
are translated at various historic rates using the temporal method (as we did in the example),
and the dangling debit or credit increases or decreases consolidated earnings for the period.
See also CURRENT RATE METHOD; FASB No. 52.
TENOR
Time period of
drafts
.
See also DRAFT.
TERM STRUCTURE OF INTEREST RATES
The term structure of interest rates, also known as a
yield curve
, shows the relationship
between length of time to maturity and yields of debt instruments. Other factors such as
default risk and tax treatment are held constant. An understanding of this relationship is
important to corporate financial officers who must decide whether to borrow by issuing long-
or short-term debt. An understanding of yield-to-maturity for each currency is especially
critical to an MNC’s CFO. It is also important to investors who must decide whether to buy
long- or short-term bonds. Fixed income security analysts should investigate the yield curve
carefully in order to make judgments about the direction of interest rates. A yield curve is
simply a graphical presentation of the term structure of interest rates. A yield curve may take
any number of shapes. Exhibit 105 shows alternative yield curves: a flat (vertical) yield curve
(Exhibit 105A), a positive (ascending) yield curve (Exhibit 105B), an inverted (descending)
yield curve (Exhibit 105C), and a humped (ascending and then descending) yield curve
(Exhibit 105D). For the yield curve whose shape changes over time, there are three major
Yen Exchange Rate U.S. Dollars
Fixed assets 5,000,000 ($1 = ¥95) 52,632
Inventory 5,000,000
($1 = ¥90) 55,556
Total 10,000,000 108,187
Owners’ equity 10,000,000 ($1 = ¥100) 100,000
TERM STRUCTURE OF INTEREST RATES
SL2910_frame_CT.fm Page 267 Thursday, May 17, 2001 9:14 AM
268 TERM STRUCTURE OF INTEREST RATES
explanations, or theories of yield curve patterns: (1) the expectation theory, (2) the liquidity
preference theory, and (3) the market segmentation, or “preferred habitat,” theory.
A. Expectation Theory
The expectation theory postulates that the shape of the yield curve reflects investors’ expec-
tations of future short-term rates. Given the estimated set of future short-term interest rates,
the long-term rate is then established as the geometric average of future interest rates.
EXAMPLE 117
At the beginning of the first quarter of the year, suppose a 91-day T-bill yields a 6% annualized
yield, and the expected yield for a 91-day T-bill at the beginning of the second quarter is 6.4%.
Under the expectation theory, a 182-day T-bill is equivalent to having successive 91-day T-bills
and thus should offer investors the same annualized yield. Therefore, a 182-day T-bill issued at
EXHIBIT 105
Alternative Term-Structure Patterns
Years to Maturity
Yield
Years to Maturity
Flat Ascending
Yield
CD
Descending Humped
SL2910_frame_CT.fm Page 268 Thursday, May 17, 2001 9:14 AM
269
the beginning of the first quarter of the year should yield 6.2%, which is an arithmetic mean
(average) of successive 91-day T-bills.
1/2 (6.00
+
6.40)
=
1/2 (12.40)
=
6.20%
Mathematically, a current long-term yield is a geometric average of current and successive short-
term yields, or
(1
+
t
R
n
)
n
=
(1
+
t
R
1
)(1
+
t
+
1
r
1
)
…
(1
+
t
+
n
−
1
r
1
)
where the subscripts to the left of the variable,
t
,
t
+
1,
…
, signify the period and the subscripts
to the right, 1, 2,
…
,
n
signify the maturity of the debt instrument.
R
is the current yield, and
r
is a future (expected) yield. A positive (ascending) yield curve implies that investors expect short-
term rates to rise, while a descending (inverted) yield curve implies that they expect short-term
rates to fall.
EXAMPLE 118
Suppose a current 2-year yield is 9%, or
t
R
2
=
.09, and a current 1-year yield is 7%, or
1
R
t
=
.07.
Then the expected 1-year future yield
t
+
1
r
1
is 0.11037, or 11.04%:
B. Liquidity Preference Theory
The liquidity preference theory contends that risk-averse investors prefer short-term bonds
to long-term bonds, because long-term bonds have a greater chance of price variation, i.e.,
carry greater interest rate risk. Accordingly, the theory states that rates on long-term bonds
will generally be above the level called for by the expectation theory. Current long-term
bonds should include a liquidity premium as additional compensation for assuming interest
rate risk. This theory is nothing but a modification of the expectation theory. Mathematically,
a current 2-year rate is a geometric average of a current and a future 1-year rate plus a
liquidity risk premium
L
:
(1
+
t
R
2
)
2
=
(1
+
t
R
1
)(1
+
t
+
1
r
1
)
+
L
Because of a liquidity premium, a yield curve would be upward-sloping rather than vertical
when future short-term rates are expected to be the same as the current short-term rate.
C. Market Segmentation (Preferred Habitat) Theory
The market segmentation theory does not recognize expectations and emphasizes the rigidity
in loan allocation patterns by lenders. Some lenders (such as banks) are required by law to
lend primarily on a short-term basis. Other lenders (such as life insurance companies and
pension funds) prefer to operate in the long-term market. Similarly, some borrowers need
short-term money (e.g., to build up inventories), while others need long-term money (e.g.,
to purchase homes). Thus, under this theory, interest rates are determined by supply and
1 R
t 2
+()
2
1 R
t 1
+()1 r
t+11
+()=
1.09()
2
1.07()1 r
t+11
+()=
1.1881 1.07()1 r
t+11
+()=
1 r
t+11
+()1.1881/1.07=
r
t+11
1.11037 1– 0.11037 11.04%===
TERM STRUCTURE OF INTEREST RATES
SL2910_frame_CT.fm Page 269 Thursday, May 17, 2001 9:14 AM
270
demand for loanable funds in each maturity market spectrum. The yield curve for U.S. dollar-
denominated debt issues is available at the Federal Reserve Bank of New York website
(
www.ny.frb.org
).
See also INTERNATIONAL YIELD CURVES.
THETA
See CURRENCY OPTION PRICING SENSITIVITY.
3-Ds
3-Ds stand for “dollar-denominated delivery.” Virtual currency options are also called
3-Ds
(dollar-denominated delivery).
See VIRTUAL CURRENCY OPTIONS.
THREE-WAY ARBITRAGE
See TRIANGULAR ARBITRAGE.
TIME VALUE
1. Time value of money; present values (discounting) of a future sum of money or an
annuity and future values (compounding) of a present sum of money or an annuity.
See also DISCOUNTING.
2. The amount by which the option value exceeds the intrinsic value. The theoretical value
of an option consists of an intrinsic value and a time value.
See CURRENCY OPTION; OPTION.
TOKYO STOCK EXCHANGE
Tokyo Stock Exchange (TSE) is the largest stock exchange in Japan, with more than 80%
of all transactions. Osaka is the second largest exchange, with about 15% of all transactions.
By tradition, the TSE is an auction, order-driven market without market makers. Order clerks
conclude trades by matching buyers and sellers without taking positions for their own
accounts.
TOTAL RETURN
Total return (TR) is the most complete measure of an investment’s profitability. Total return
on an investment equals: (1) periodic cash payments (current income) and (2) appreciation
(or depreciation) in value (capital gains or losses). Current income (C) may be bond interest,
cash dividends, rent, etc. Capital gains or losses are changes in market value. A capital gain
is the excess of selling price (P
1
) over purchase price (P
0
). A capital loss is the opposite.
Return is measured considering the relevant time period (holding period), called a
holding
period return
.
Holding Period Return HPR()
Current income Capital gain or loss()+
Purchase price
=
CP
1
P
0
–()+
P
0
=
THETA
SL2910_frame_CT.fm Page 270 Thursday, May 17, 2001 9:14 AM
TOTAL RETURN FROM FOREIGN INVESTMENTS 271
EXAMPLE 119
Consider the investment in stocks A and B over a one period of ownership:
The current incomes from the investment in stocks A and B over the one-year period are $13
and $18, respectively. For stock A, a capital gain of $7 ($107 sales price − $100 purchase price)
is realized over the period. In the case of stock B, a $3 capital loss ($97 sales price − $100
purchase price) results.
Combining the capital gain return (or loss) with the current income, the total return on each
investment is summarized below:
Thus, the return on investments A and B are:
See also ARITHMETIC AVERAGE RETURN VS. COMPOUND (GEOMETRIC) AVER-
AGE RETURN; RETURN RELATIVE.
TOTAL RETURN FROM FOREIGN INVESTMENTS
In general, the total dollar return on an investment can be broken down into three separate
elements: dividend/interest income, capital gains (losses), and currency gains (losses).
A. Bonds
The one-period total dollar return on a foreign bond investment R can be calculated as follows:
Stock
AB
Purchase price (beginning of year) $100 $100
Cash dividend received (during the year) $13 $18
Sales price (end of year) $107 $97
Stock
Return A B
Cash dividend $13 $18
Capital gain (loss)
7 (3)
Total return $20 $15
HPR stock A()
$13 $107 $100–()+
$100
$13 $7+
$100
$20
$100
20%====
HPR stock B()
$18 $97 $100–()+
$100
$18 $3–
$100
$15
$100
15%====
Total dollar return Foreign currency bond return Currency gain loss()×=
1 R+1
B
1
B
0
I––
B
0
+1%C+()=
SL2910_frame_CT.fm Page 271 Thursday, May 17, 2001 9:14 AM
272
where
B
1
= foreign currency bond price at year-end
B
0
= foreign currency bond price at the beginning of the period
I = foreign currency bond coupon income
%C = percent change in dollar value of the foreign currency
EXAMPLE 120
Suppose the initial British bond price is £102, the coupon income is £9, the end-of-period bond
price is £106, and the local currency appreciates by 8.64% against the dollar during the period.
According to the formula, the total dollar return is 22.49%:
Note: The currency gain applies to both the local currency principal and to the local currency
return.
B. Stocks
Using the same terminology the one-period total dollar return on a foreign stock investment
can be calculated as follows:
where
P
1
= foreign currency stock price at year-end
P
0
= foreign currency stock price at the beginning of the period
D = foreign currency dividend income
%C = percent change in dollar value of the foreign currency
EXAMPLE 121
Suppose that, during the year, Honda Motor Company moved from ¥11,000 to ¥9,000, while
paying a dividend of ¥60. At the same time, the exchange rate moved from ¥105 to ¥110. The
total dollar return from this stock investment is a loss, which is computed as follows:
Note: The percent change in the yen rate is 0.00455 = (¥105 − ¥110)/ ¥110. In this example, the
investor suffered both a capital loss on the foreign currency principal and a currency loss on the
dollar value of the investment.
See also INTERNATIONAL RETURNS; TOTAL RETURN.
1 R+ 1 £106 £102 £9+–()/£102+[]1 0.0864+()×=
R 0.2249 22.49%==
Total dollar return Foreign currency stock return Currency gain loss()×=
1R+
1
P
1
P
0
D––
P
0
+
1%C+()=
1 R+1¥9,000 ¥11,000 ¥60+–()/¥11,000+[]1 0.0455–()×=
R 0.2123– 21.23%–==
TOTAL RETURN FROM FOREIGN INVESTMENTS
SL2910_frame_CT.fm Page 272 Thursday, May 17, 2001 9:14 AM
273
TRACKING STOCK
Issuing tracking stock is an increasingly popular corporate-financing technique. Tracking
stock is a stock created by a company to follow, or track, the performance of one of its
divisions—typically one that is in a line of business that is fast-growing and commands a
higher industry price-to-earnings ratio than the parent’s main business. Some companies
distribute tracking stock to their existing shareholders. Others sell tracking stock to the public,
raising additional cash for themselves. Some companies do both. Tracking stock, however,
does not typically provide voting rights.
TRADE ACCEPTANCE
Trade acceptance is a time or date draft which has been accepted by the drawee (or the buyer)
for payment at maturity. Trade acceptances differ from bankers’ acceptances in that they are
drawn on the buyer, carry only the buyer’s obligation to pay, and cannot become bankers’
acceptances or be guaranteed by a bank.
TRADE BALANCE
See BALANCE OF TRADE.
TRADE CREDIT INSTRUMENTS
Arrangements made to finance international trade credit are very much like the intracountry
arrangements, but they also involve the extra complications of the international environment.
The major trade credit instruments are:
• Letter of credit—a written statement made by a bank that it will pay a specified
amount of money when certain trade conditions have been satisfied
• Draft—an order to pay someone (similar to a check)
• Banker’s acceptance—a draft that has been accepted by a bank
An example will help illustrate these ideas.
EXAMPLE 122
Consider a New York firm that wants to import $200,000 worth of Japanese CD player compo-
nents. The firm first gets the Japanese company to grant it 60 days’ credit from the shipment
date. Then the New York firm arranges a letter of credit through its New York bank, which is
sent to the Japanese company. The Japanese company ships the equipment and presents a 60-
day draft on the New York bank to its Japanese bank. Then the Japanese bank pays the Japanese
company. The draft is then forwarded to the New York bank and, if all paperwork is in order,
becomes a banker’s acceptance, which is a $200,000 debt that the New York bank owes the
Japanese bank. At the end of 60 days the New York importer pays the New York bank, which
in turn pays the acceptance. In the interim, the Japanese bank could sell the acceptance on the
open market. The final owner of the banker’s acceptance would then present it to the New York
bank for payment.
Note: There are at least four parties involved: an importer, an exporter, and their respective banks.
Often there are other banks involved, too. The whole process has several detailed features and
options associated with it. Finance companies and factors are also involved in financing trade credit.
See also BANKER’S ACCEPTANCE; DRAFT; LETTERS OF CREDIT.
TRADING AT A DISCOUNT
See FORWARD PREMIUM OR DISCOUNT.
TRADING AT A DISCOUNT
SL2910_frame_CT.fm Page 273 Thursday, May 17, 2001 9:14 AM
274
TRADING AT A PREMIUM
See FORWARD DIFFERENTIAL.
TRANSACTION EXPOSURE
Transaction exposure is the extent to which the income from transactions is affected by
fluctuations in foreign exchange values. This exposure arises whenever an MNC is committed
to a foreign-currency-denominated transaction. Such exposure represents the potential gains
or losses on the future settlement of outstanding obligations for the purchase or sale of goods
and services at previously agreed prices and the borrowing or lending of funds in foreign
currencies. An example would be a U.S. dollar loss, after the franc devalues, on payments
received for an export invoiced in francs before that devaluation. Transaction exposure can
be managed by contractual and operating hedges. The major contractual hedges use the
forward, money, futures, and option markets, while operating strategies include the use of
currency swaps, back-to-back (parallel) loans, and leads and lags in payment terms. Three
contractual hedges are briefly explained below.
• Forward-market hedge. A forward hedge involves a forward contract and a source
of funds to carry out that contract. The forward contract is entered into at the time
the transaction exposure is created. Transaction exposure associated with a foreign
currency can also be covered in the currency futures market.
• Money-market hedge. Like a forward-market hedge, a money-market hedge also
employs a contract and a source of funds to fulfill that contract. In this case,
however, the contract is a loan agreement. The MNC involved in the hedge borrows
in one currency and exchanges the proceeds for another currency.
• Option-market hedge. An option-market hedge involves the purchase of a call (the
right to buy) or put (the right to sell) option. This will allow the MNC to speculate
the upside potential for depreciation or appreciation of the currency while limiting
downside risk to a known (certain) amount.
EXAMPLE 123
Asiana Airlines has just signed a contract with Boeing to buy two new jet aircrafts for a total of
$120,000,000, with payment in two equal installments. The first installment has just been paid.
The next $60,000,000 is due three months from today. Asiana currently has excess cash of
50,000,000 won in a Seoul bank, from which it plans to make its next payment. It wishes to
determine the method by which it could make its dollar payment and be assured of the largest
remaining bank balance. The relevant data are given below.
Value Units
Beginning Seoul bank cash balance 90,000,000,000 won
Account payable in 90 days $60,000,000 U.S. $
Spot rate 1100 won/$
Three-month forward rate 1095 won/$
Spot rate in 3 months (forecast) 1092 won/$
Korean 3-month interest rate 5.00% per annum
U.S. 3-month interest rate 8.00% per annum
OTC bank call option (90 days)
Strike price 1090 won/$
Option premium (cost) 0.50% per annum
TRADING AT A PREMIUM
SL2910_frame_CT.fm Page 274 Thursday, May 17, 2001 9:14 AM
275
Exhibits 106 and 107 provide evaluation of four alternatives at various spot rates.
Exhibit 108 graphs expected bank balances of alternative strategies.
EXHIBIT 106
Transaction Hedge/Payment Evaluation (Korean won)
Alternative Expected Cost
Remaining
Bank Balance
Unhedged 65,520,000,000 25,605,000,000
Forward hedge 65,700,000,000 25,425,000,000
Money-market hedge 65,514,705,882 25,610,294,118
OTC bank option Premium 334,125,000
Exercise 65,400,000,000 25,390,875,000
Note: All costs are stated at end of 90-day period.
EXHIBIT 107
Graphic Generation of Hedging Alternatives (ending bank balance in won)
Spot rate 1084 1086 1088 1090 1092
Unhedged 26,085,000,000 25,965,000,000 25,845,000,000 25,725,000,000 25,605,000,000
Forward 25,425,000,000 25,425,000,000 25,425,000,000 25,425,000,000 25,425,000,000
Money market 25,610,294,118 25,610,294,118 25,610,294,118 25,610,294,118 25,610,294,118
Option 25,750,875,000 25,630,875,000 25,510,875,000 25,390,875,000 25,390,875,000
EXHIBIT 108
Hedge Valuation for Asiana Airlines (at various ending spot exchange rates)
Bank Balance (in won)
24,000,000,000
24,500,000,000
25,000,000,000
25,500,000,000
26,000,000,000
26,500,000,000
1084 1086 1088 1090 1092 1094 1096 1098 1100 1102 1104 1106
Ending Spot Exchange Rate (won/$)
Unhedged Forward Money Mkt Option
TRANSACTION EXPOSURE
SL2910_frame_CT.fm Page 275 Thursday, May 17, 2001 9:14 AM
276
See also MONEY-MARKET HEDGE.
TRANSACTION RISK
Transaction risk is the risk resulting from transaction exposure and losses from changing
foreign currency rates. It involves a receivable or a payable denoted in a foreign currency.
See also TRANSACTION EXPOSURE.
TRANSFERABLE LETTER OF CREDIT
A letter of credit (L/C) under which the beneficiary (exporter) has the right to instruct the
paying bank to make the credit available to one or more secondary beneficiaries. No L/C is
transferable unless specifically authorized in the letter of credit. Further, it can be transferred
only once. The stipulated documents are transferred alone with the L/C.
TRANSLATION EXPOSURE
Also called accounting exposure, the impact of an exchange rate change on the reported
consolidated financial statements of an MNC. An example would be the impact of a French
franc devaluation on a U.S. firm’s reported income statement and balance sheet. The resulting
translation (accounting) gain or losses are said to be unrealized—they are “paper” gains and
losses. Exhibit 109 contrasts translation, transaction, and economic exposure. Exhibit 110
summarizes basic strategy for managing (hedging) translation exposure.
The strategy involves increasing hard-currency assets and decreasing soft-currency assets,
while simultaneously decreasing hard-currency liabilities and increasing soft-currency liabil-
ities. For example, if a devaluation appears likely, the basic strategy would be to reduce the
EXHIBIT 109
Comparison of Translation, Transaction, and Economic Exposure
Moments in Time When Exchange Rate Changes
Translation Exposure
Accounting-based changes in
statements (balance sheet
and income statement items)
caused by a change in exchange
rates.
Economic Exposure
Changes in expected cash flows financial
arising due to an unexpected change
in exchange rates.
Impacts are on revenues and costs
associated with future sales.
᭜᭜
Transaction Exposure
Impact of settling outstanding foreign currency-denominated contracts already entered into before change
in exchange rates but to be settled at a later date.
᭜
EXHIBIT 110
Basic Strategy For Managing (Hedging) Translation Exposure
Assets Liabilities
Hard currencies (Likely to appreciate) Increase Decrease
Soft currencies (Likely to depreciate) Decrease Increase
TRANSACTION RISK
SL2910_frame_CT.fm Page 276 Thursday, May 17, 2001 9:14 AM
277
level of cash, tighten credit terms (to reduce accounts receivable), increase local currency
borrowing, delay accounts payable, and sell the weak currency forward.
See also ECONOMIC EXPOSURE; TRANSACTION EXPOSURE.
TRANSLATION GAIN OR LOSS
An accounting gain or loss resulting from changes caused by fluctuations in foreign currency-
based receivables, payables, or other assets or liabilities.
TRANSLATION METHODS
See CURRENCY TRANSLATION METHODS.
TRANSLATION RISK
See TRANSLATION EXPOSURE.
TREYNOR’S PERFORMANCE MEASURE
Treynor’s performance measure can be used to measure portfolio performance. It is concerned
with systematic (beta) risk.
EXAMPLE 124
An investor wants to rank two stock mutual funds he owns. The risk-free interest rate is 6%.
Information for each fund follows:
Fund A is ranked first because it has a higher return relative to Fund B.
The index can be computed based on information obtained from financial newspapers
such as Barron’s and the Wall Street Journal.
See also SHARPE’S RISK-ADJUSTED RETURN.
TRIANGULAR ARBITRAGE
Also called a three-way arbitrage, triangular arbitrage eliminates exchange rate differentials
across the markets for all currencies. This type of arbitrage involves more than two currencies.
If the cross rate is not set properly, arbitrage may be used to capitalize on the discrepancy.
When we consider that the bulk of foreign exchange trading involves the U.S. dollar, we note
the role of comparing dollar exchange rates for different currencies to determine if the implied
Growth Fund Return Fund’s Beta
A 14% 1.10
B 12 1.30
T
p
Risk premium
Portfolio’s beta coefficient
=
T
A
14% 6%–
1.10
7.27 First()==
T
B
12% 6%–
1.30
4.62 Second()==
TRIANGULAR ARBITRAGE
SL2910_frame_CT.fm Page 277 Thursday, May 17, 2001 9:14 AM
278 TRIANGULAR ARBITRAGE
third exchange rates are in line. Since banks quote foreign exchange rates with respect to the
dollar (the dollar is said to be the “numeraire” of the system), such comparisons are readily
made. For instance, if we know the dollar price of pounds ($/£) and the dollar price of marks
($/DM), we can infer the corresponding pound price of marks (£/DM). Triangular arbitrage is
a form of arbitrage seeking a profit as a result of price differences in foreign exchange among
three currencies. This form of arbitrage occurs when the arbitrageur does not desire to operate
directly in a two-way transaction, due to restrictions on the market or for any other reason. In
this case, the arbitrageur moves through three currencies, starting and ending with the same
one. Note: Like simple, two-way arbitrage, triangular arbitrage does not tie up funds. Also,
the strategy is risk-free, because there is no uncertainty about the rates at which one buys
and sells the currencies.
EXAMPLE 125
To simplify the analysis of arbitrage involving three currencies, let us temporarily ignore the
bid–ask spread and assume that we can either buy or sell at one price. Suppose that in London
$/£ = $2.00, while in New York $/DM = $0.40. The corresponding cross rate is the £/DM rate. Simple
algebra shows that if $/£ = $2.00 and $/DM = 0.40, then £/DM = ($/DM)/($/£) = 0.40/2.00 = 0.2.
If we observe a market where one of the three exchange rates—$/£, $/DM, £/DM—is out of line
with the other two, there is an arbitrage opportunity.
Suppose that in Frankfurt the exchange rate is £/DM = 0.2, while in New York $/DM = 0.40,
but in London $/£ = $1.90. Astute traders in the foreign exchange market would observe the
discrepancy, and quick action would be rewarded. The trader could start with dollars and
1. Buy £1 million in London for $1.9 million as $/£ = $1.90.
2. The pounds could be used to buy marks at £/DM = 0.2, so that £1,000,000 = DM5,000,000.
3. The DM5 million could then be used in New York to buy dollars at $/DM = $0.40, so that
DM5,000,000 = $2,000,000.
4. Thus, the initial $1.9 million could be turned into $2 million with the triangular arbitrage
action earning the trader $100,000 (costs associated with the transaction should be deducted
to arrive at the true arbitrage profit).
As in the case of the two-currency arbitrage covered earlier, a valuable product of this arbitrage
activity is the return of the exchange rates to internationally consistent levels. If the initial
discrepancy was that the dollar price of pounds was too low in London, the selling of dollars
for pounds in London by the arbitrageurs will make pounds more expensive, raising the price
from $/£ = $1.90 back to $2.00. (Actually, the rate would not return to $2.00, because the activity
in the other markets would tend to raise the pound price of marks and lower the dollar price of
marks, so that a dollar price of pounds somewhere between $1.90 and $2.00 would be the new
equilibrium among the three currencies.)
EXAMPLE 126
Suppose the pound sterling is bid at $1.9809 in New York and the Deutsche mark at $0.6251 in
Frankfurt. At the same time, London banks are offering pounds sterling at DM 3.1650. An astute
trader would sell dollars for Deutsche marks in Frankfurt, use the Deutsche marks to acquire
pounds sterling in London, and sell the pounds in New York. Specifically, the trader would
1. Acquire DM1,599,744.04 ($1,000,000/$0.6251) for $1,000,000 in Frankfurt,
2. Sell these Deutsche marks for £505,448.35 (1,599,744.04/DM3.1650) in London, and
3. Resell the pounds in New York for $1,001,242.64 (£505,448.35 × $1.9809).
SL2910_frame_CT.fm Page 278 Thursday, May 17, 2001 9:14 AM
279
Thus, a few minutes’ work would yield a profit of $1,242.64 ($1,001,242.64 − $1,000,000). In
effect, the trader would, by arbitraging through the DM, be able to acquire sterling at $1.9784
in London ($0.6251 × 3.1650) and sell it at $1.9809 in New York. Again, as can be seen in this
example, the arbitrage transactions would tend to cause the Deutsche mark to appreciate vis-à-vis
the dollar in Frankfurt and to depreciate against the pound sterling in London; at the same time,
sterling would tend to fall in New York.
Opportunities for such profitable currency arbitrage have been greatly reduced in recent
years, given the extensive network of people—aided by high-speed, computerized information
systems—who are continually collecting, comparing, and acting on currency quotes in all
financial markets. The practice of quoting rates against the dollar makes currency arbitrage
even simpler. The result of this activity is that rates for a specific currency tend to be the
same everywhere, with only minimal deviations due to transaction costs.
See also ARBITRAGE; COVERED INTEREST ARBITRAGE; FOREIGN EXCHANGE
ARBITRAGE; SIMPLE ARBITRAGE.
TRIANGULATION
Triangulation is the method of conversion used under the new euro system. The conversion
has to be made through the euro—for example, Dutch guilders to euros to francs, using the
fixed conversion rates.
See also BILATERAL EXCHANGES; EURO.
TRUST RECEIPT
A trust receipt is an instrument that acknowledges that the borrower holds specified property
in trust for the lender. The lender retains title. The goods are subject to repossession by the
bank. The trust receipts are always used when merchandise is financed via acceptances under
letters of credit. When the lender receives the sale proceeds, title is given up.
TWO-TIER FOREIGN EXCHANGE MARKET
An arrangement of two exchange markets—a formal market (at the official rate) for certain
transactions and a free market for remaining transactions.
TWO-WAY ARBITRAGE
See SIMPLE ARBITRAGE.
TYPES OF OVERSEAS BANKING SERVICES
There are a number of organizational forms that banks may use to deliver international
banking services to their customers. The primary forms are (1) correspondent banks, (2) rep-
resentative offices, (3) branch banks, (4) foreign subsidiaries and affiliates, (5) Edge Act
corporations, and (6) international banking facilities (IBFs). Exhibit 111 shows a possible
organizational structure for the foreign operations of U.S. banks. Though possible, all these
forms need not exist for any individual bank. Exhibit 112 summarizes advantages and
disadvantages of each type of form.
TYPES OF OVERSEAS BANKING SERVICES
SL2910_frame_CT.fm Page 279 Thursday, May 17, 2001 9:14 AM
280 TYPES OF OVERSEAS BANKING SERVICES
EXHIBIT 111
Organizational Structure for a U.S. Bank’s International Operations
EXHIBIT 112
Advantages and Disadvantages of Types of Overseas Banking Services
Types Advantages Disadvantages
Correspondent banks Minimal cost form of market entry
No investment in staff or facilities
Having multiple sources of business
given and received
Referrals to local banking opportunities
Ability to cash in on local knowledge and
contacts
Low priority given to the needs of U.S.
customers
Difficulty of obtaining due to capital
restrictions
Difficult to arrange certain types of
credits
Credit not provided regularly and
extensively by the correspondent
U.S. bank
holding
company
U.S. bank
Subsidiaries of
U.S. bank
Representative
offices
U.S. bank’s
international
division
Foreign
branches
Correspondent
offices
Subsidiary
holding
interest in
banks,
financial
firms, and
other
business
Edge Act
corporations
Equity interest
in foreign
bank
Subsidiaries of
the holding company
Subsidiary
providing
international
services for
U.S. firms
Subsidiaries
overseas
that
engage in
banking
activities
in which
domestic
banks
cannot
engage
Subsidiaries
overseas
that engage
in banking
activities
in which
domestic
banks can
engage
SL2910_frame_CT.fm Page 280 Thursday, May 17, 2001 9:14 AM
TYPES OF OVERSEAS BANKING SERVICES 281
See also CONSORTIUM BANK; CORRESPONDENT BANK; EDGE ACT AND AGREE-
MENT CORPORATION; FOREIGN BRANCHES; FOREIGN SUBSIDIARIES AND
AFFILIATES; INTERNATIONAL BANKING FACILITY; REPRESENTATIVE OFFICES.
Representative offices Low-cost entry to foreign markets
Efficient delivery of services
Attracting additional business
Preventing losses of current business
Inability to penetrate the foreign market
more effectively
Expensive because capital is not
generated
Difficult to attract qualified personnel
Inability to conduct general banking
activities
Foreign branches Better control over foreign operations
Enhanced ability to offer direct and
integrated services to customers
Improved ability to manage customer
relationships
Ability to conduct a full range of services
High-cost form of entry into a foreign
market
Difficult and expensive to train branch
managers
Foreign subsidiaries and
affiliates
Immediate access to local deposit
markets
Ability to use an established network of
local contacts and clients
Expensive
Highly risky
Difficult to make work effectively
SL2910_frame_CT.fm Page 281 Thursday, May 17, 2001 9:14 AM
282
U
UMBRELLA POLICY
See EXPORT-IMPORT BANK.
UNBUNDLING
1. A strategy that adopts more than one financial tool to transfer funds across countries.
2. Separating cash flows from a subsidiary to a parent company into their many separate
components, such as royalties, lease payments, dividend, so as to increase the likelihood
that some fund flows will be allowed during economically hard times.
3. A strategy of governments to try to force MNCs into sharing more of their benefits with
the local country; for example, through shared ownership, required technology transfer,
or local content requirements.
UNCONFIRMED LETTER OF CREDIT
A
letter of credit
(
L/C
) issued by one bank and not confirmed by another. Hence, an unconfirmed
L/C is the obligation of only the issuing bank.
UNDERVALUED CURRENCY
1. A currency whose value a country seeks to keep below market to make its exports less
expensive and more competitive.
2. A currency that has been oversold because of emotional or panic selling.
UNSYSTEMATIC RISK
Also called
diversifiable risk, company-specific risk
, or
controllable risk
, unsystematic risk
in a portfolio is the amount of risk that can be removed by diversification.
See also BETA; SYSTEMATIC RISK.
SL2910_frame_CU.fm Page 282 Thursday, May 17, 2001 9:15 AM
283
V
VALUATION
1. The process of determining the intrinsic value of an asset, such as a security, business,
or a piece of real estate. The process of determining security valuation involves finding
the present value of an asset’s expected future cash flows using the investor’s required
rate of return. Thus, the basic security valuation model can be defined mathematically
as follows:
where
V
=
intrinsic value (or present value) of an asset
CF
t
=
expected future cash flows in period
t
=
1,
…
,
n
r
=
investor’s required rate of return
2. Assessing the value of imported goods by customs to assess the appropriate duty charge.
VALUE DATE
Also called the
settlement date
.
1. The value date for spot exchange transactions is the date when value is given (i.e., funds
are deposited) for those transactions between banks. It is set as the second working day
after the transaction is concluded.
2. The point in time when a bank remittance actually becomes available to the payee for use.
VARIATION MARGIN
The amount to be paid to satisfy
maintenance margin
.
VEHICLE CURRENCY
A currency used in international trade to make quotes and payments, vehicle currency plays
a central role in the foreign exchange market (e.g., the U.S. dollar and Japanese yen).
VIRTUAL CURRENCY OPTIONS
Virtual currency options, also
called 3-Ds
(dollar-denominated delivery), are options that do
not require the payment or delivery of the underlying currency. Currently, 3-D options are
available on the Deutsche mark and the Japanese yen. They are European-style options that
mature anytime from one week to nine months, and they settle weekly.
See also CURRENCY OPTION.
VISIBLE TRADE
Also called the
balance of trade
, foreign trade in merchandise.
V
CF
t
1 r+()
t
t=1
n
∑
=
SL2910_frame_CV.fm Page 283 Thursday, May 17, 2001 9:16 AM
284
W
WAC C
Weighted-Average Cost of Capital.
See COST OF CAPITAL.
WEAK CURRENCY
See SOFT CURRENCY.
WEAK DOLLAR
See DEPRECIATION OF THE DOLLAR.
WEIGHTED-AVERAGE COST OF CAPITAL (WACC)
See COST OF CAPITAL.
WEIGHTED-AVERAGE EXCHANGE RATE
The mean or average exchange rate used in translating income and expense accounts at the
end of an accounting period, this rate takes into account the relative change of exchange rates
during the period and adjusts the consolidated statement with this weighted-average rate.
See also TRANSLATION METHODS.
WHOLESALE BANKING
Banking services provided between merchant banks and other financial institutions.
WON
South Korea’s currency.
WORKING CAPITAL GUARANTEE PROGRAM
See EXPORT-IMPORT BANK.
WORLD BANK
The World Bank (
www.worldbank.org
) is an integrated group of international institutions
which provides financial and technical assistance to developing countries. The World Bank
includes the
International Bank for Reconstruction and Development
and the International
Development Association. World Bank affiliates, legally and financially separate, include the
International Center for Settlement of Investment Disputes, the International Finance Corpo-
ration, and the Multilateral Investment Guarantee Agency. World Bank headquarters are in
Washington, D.C.
WRITER
Also called a
grantor
, an individual who sells an option.
SL2910_frame_W.fm Page 284 Thursday, May 17, 2001 9:18 AM
285
X
XENOCURRENCY
A currency that trades outside of its own borders.
SL2910_frame_X.fm Page 285 Thursday, May 17, 2001 9:19 AM
286
Y
YANKEE BONDS
Dollar-denominated bonds issued within the United States by foreign banks and companies.
See also FOREIGN BOND.
YANKEE CD
A certificate of deposit (CD) issued in the U.S. market by a branch of a foreign bank.
YANKEE STOCK OFFERINGS
Offerings of stock by non-U.S. MNCs in the U.S. markets.
YEN
Japanese currency. Its symbol is ¥.
YIELD
Also called
real return
or
real rate of return
.
1. Effective rate of return, or real return.
See INTERNAL RATE OF RETURN.
2. The income earned on an investment, usually expressed as a percentage of the market
price.
3. The percentage return earned on a common stock or preferred stock in dividends. It is
figured by dividing the total of dividends paid in the preceding 12 months by the current
market price. For example, a stock with a current market value of $40 a share which has
paid $2 in dividends in the preceding 12 months is said to return 5% ($2/$40). If an
investor paid $20 for the stock five years earlier, the stock would be returning him/her
10% on his/her original investment.
4. In the case of bonds, the
current yield
or
yield to maturity
(
YTM
).
5. The money earned on a loan, which is determined by multiplying the
annual percentage
rate
(
APR
) by the amount of the loan over a stated time period.
YIELD CURVE
See TERM STRUCTURE OF INTEREST RATES.
YIELD TO CALL
The yield of a bond, if it is held until the call date. This yield is valid only if the security is
called prior to maturity. The calculation of yield to call is based on the coupon rate, length
of time to the call date, and the market price. In general, bonds are callable over several years
and normally are called at a small premium.
YIELD TO MATURITY
Also called
effective yield
, yield to maturity (YTM) is the real return to be received from
interest income plus capital gain (or loss) assuming the bond is held to maturity. The YTM
incorporates the stated rate of interest on the bond as well as any discount or premium that
may have been generated when bought.
SL2910_frame_Y.fm Page 286 Thursday, May 17, 2001 9:20 AM