RealLife Math Phần 3 ppt
Bạn đang xem bản rút gọn của tài liệu. Xem và tải ngay bản đầy đủ của tài liệu tại đây (938.41 KB, 66 trang )
Charts
112 REAL-LIFE MATH
pie, and the whole pie would represent the total points
scored. Alternatively, to look at points scored by just three
players, a pie chart is not useful, because other points
could have been scored by different players, and the play-
ers do not represent the whole, they are only a fraction of
the whole.
USING THE COMPUTER
TO CREATE CHARTS
There are many computer programs that quickly do
most chart plotting. The most common is Microsoft Excel,
which has many different predetermined chart templates,
based on the three basic charts, and formats data into
a chart.
Excel and other charting programs have created pre-
formatted charts to represent data in as many ways as
possible, but at the root of all these charts are the three
basic chart formats. One area where they have made sig-
nificant changes in appearance is in area charts, or other
three-dimensional chart types. While the basic charting
procedure is basically the same, these charting programs
have tried to add a third dimension, depth, to the basic
two-dimensional chart. While this is helpful with very
specific types of data, the two-dimensional charts are still
the most commonly used.
CHOOSING THE RIGHT TYPE
OF CHART FOR THE DATA
Organization of data is an important part of telling a
story, and conveying that story to others. Charts are a
quick way of showing the relational aspects of different
categorized data sets; charts take the quantitative aspects
of information and create a picture to make it easier for
the viewer to quickly see relationships. Therefore, choos-
ing the correct chart to represent data sets is a key ele-
ment of conveying the story, and communicating how the
data looks.
For example, at the beginning of the semester the
math teacher makes the following announcement: the
school administrators want to analyze the demographics
of this high school relative to three other high schools in
neighboring states. Furthermore, the administration has
made the analysis a contest, and everyone in any math
class is welcome to participate. All entries will be voted on
fairly and independently. The teacher also states: if the
winner is in a particular class, that participating student
will receive an A for the course.
After collecting the data, the student ends up with
the following information for all four schools: total stu-
dents, broken out by grade; number of male and female
students; total square feet of each school; number of
teachers; number of classes offered; and the number of
students who took the SAT tests, per state, over a 25-year
period.
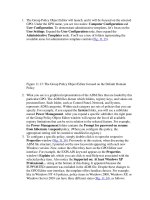
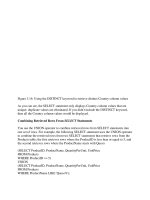
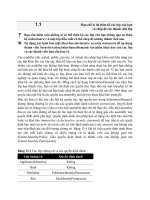
Using line, column, and pie charts, the data is organ-
ized in the following way: First, a basic column chart is
created showing the total students for each school, as in
Figure 12. Secondly, in Figure 13, a stacked bar chart is cre-
ated, each with four columns, so each segment is repre-
senting one grade and each column is representing each
school. Figure 14 represents this same concept used to
show the distribution of males and females for each school.
500
700
900
0
School 1 School 2 School 3 School 4
650
200
400
100
350
850
Female
Male
Figure 14.
9th Grade
10th Grade
11th Grade
12th Grade
500
700
900
0
School 1 School 2 School 3 School 4
650
200
400
100
350
850
Figure 13.
540
600
400
780
500
700
900
0
School 1 School 2
Students
School 3 School 4
650
200
400
100
350
850
Figure 12.
Charts
REAL-LIFE MATH
113
Using a pie chart to plot the square feet per school,
the pie chart has four segments, one for each school, and
each segment of pie represents the percentage of square
feet as a portion of the whole, as shown in Figure 15. Fig-
ure 16 represents a pie chart to plot the number of teach-
ers for each school, and Figure 17 is the third pie chart
that has the number of classes per school.
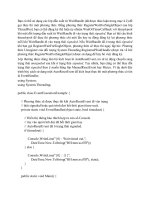
Lastly, Figure 18 is a line chart used to plot the aver-
age SAT scores over the 25-year period. With 25 cate-
gories on the x axis, and the scores on the y axis, the data
points are plotted, the dots connected, and a line chart is
created that spans the 25-year period.
Where to Learn More
Books
Excel Charts. Somerset, NJ: John Wiley & Sons, 2005.
1996
1998
2000
2002
1988
1990
1992
1994
1980
1982
1984
1886
2004
3,000
4,000
1,000
2,000
5,000
6,000
7,000
8,000
0
School 1
School 2
School 3
School 4
Figure 18.
School 1
Classes
School 2
School 3
School 4
Figure 17.
School 1
Teachers
School 2
School 3
School 4
Figure 16.
School 1
Square Feet
School 2
School 3
School 4
Figure 15.
Key Terms
Dependant variable: What is being modeled; the
output.
Independent variable: Data used to develop a model,
the input.
114 REAL-LIFE MATH
Computers and
Mathematics
Overview
Mathematics is integral to computers. Most com-
puter processes and functions rely on mathematical prin-
ciples. The word “computers” is derived from computing,
meaning the process of solving a problem mathemati-
cally. Large complex calculations (or computing) in engi-
neering and scientific research often require basic
calculators and computers.
Computers have evolved greatly over the years. These
days, computers are used for practically anything under
the Sun, education, communication, business, shopping,
or entertainment. Mathematics forms the basis of all
these applications.
Applications of mathematical concepts are seen
in the way computers process data (or information)
in the form of bits, bytes, and codes, store large quantities
of data by compression, and send data from one
computer to another by transmission. With the advent of
the Internet, communication has become extremely
easy. Every computer is assigned a unique identity,
using mathematical principles, making communication
possible. In addition, mathematics has also found
other applications in computers, such as security and
encryption.
Fundamental Mathematical Concepts
and Terms
BINARY SYSTEM
All computers or computing devices think and
process in binary code, a binary number system. In a
binary number system, everything is described using two
values—on or off, true or false, yes or no, one or zero, and
so on. The simplest example of a binary system is a light
switch, which is always either on or off. A computer con-
tains millions of similar switches. The status of each
switch in the computer represents a bit or binary digit. In
other words, each switch is either on or off. The computer
describes one as “on” and zero as “off.”
Any number can be represented in the binary system
as a combination of zeros and ones. In the binary num-
ber system, each number holds the value of increasing
powers of two, e.g., 2
0
,2
1
, and so on. This makes counting
in binary easy. The binary representation for the numbers
one to ten can be shown as follows:
•0 ϭ 0
•1 ϭ 1
•2 ϭ 10
•3 ϭ 11
Computers and Mathematics
REAL-LIFE MATH
115
•4 ϭ 100
•5 ϭ 101
•6 ϭ 110
•7 ϭ 111
•8 ϭ 1000
•9 ϭ 1001
• 10 ϭ 1010.
ALGORITHMS
The key principle in all computing devices is a sys-
tematic process for completing a task. In mathematics,
this systematic process is called an algorithm. Algorithms
are common in daily life as well. For example, when
building a house, the first step involves building the floor
base (or foundation), followed by the walls, and then the
ceiling or roof. This systematic procedure to solve the
problem of building a house is an example of an algorithm.
In a nutshell, algorithms are a list of step-by-step
instructions. In mathematical terms, these are also some-
times known as theorems. A computer program, or appli-
cation, is made up of a number of such algorithms.
Besides, every process in a computer also depends on a
specific algorithm. For example, when switching on the
computer, the computer does what is known as “booting.”
Booting helps in properly loading the operating system
(Windows, Mac, Dos, UNIX, and so on). During booting,
the computer follows a set of instructions (defined by an
algorithm). Similarly, while opening any program (say,
MS Word), the computer is again instructed to follow a
set of tasks so that the program opens properly.
Like complex mathematical problems, even the most
complex software programs are based on numerous
algorithms.
A Brief History of Discovery
and Development
Although the modern computer was built only in the
twentieth century, many primitive forms of the computer
were used in ancient times. The early calculators can also be
considered as extremely basic computers based on similar
mathematical concepts. The word calculator, is derived
from the Latin word calculus (or a small stone). Early
A calculating device created by Scottish mathematician John Napier in 1617 which consists of cylinders inscribed with
multiplication tables. It’s also known as “Napier’s Bones.”
BETTMANN/CORBIS.
Computers and Mathematics
116 REAL-LIFE MATH
human civilizations used small stones for counting. Count-
ing boards made up of stones were used for basic arithmetic
tasks such as addition, subtraction, and multiplication.
This led to development of devices that enabled cal-
culation of more complex numbers, and in quick time.
With the progress of civilization, man saw the development
of the abacus, the adding machine, the Babbage, and the
prototype mainframe computers.
Modern computers, however, were invented in the
twentieth century. In 1948, the mathematician Claude
Shannon (1916–2001), working at Bell Laboratories in
the United States, developed computing concepts that
would form the basis of modern information theory.
Shannon is often known as the father of information sci-
ence. Computers were earlier only used by government
institutions. Home or personal computers (known as
PCs) came much later in the late 1970s and 1980s.
Today, personal computers and servers with a micro-
processor chip (a small piece of computer hardware) are
embedded in almost all lifestyle electronic products, from
the washing machine and television to calculators and
automobiles. Many of these chips are capable of comput-
ing in the same capacity as some basic computers. The
advancement of mathematical concepts and theories has
made it possible to develop sophisticated computers in
smaller and smaller sizes, such as those found in hand-
held computers like the PDA (personal data assistant)
and PMP (personal media player).
Ciphers, codes, and secret writing based on mathe-
matical concepts have been around since ancient times.
In ancient Rome, they were used to communicate secrets
over long distances. Such codes are now used extensively
in the field of computer science.
Real-life Applications
BITS
The bit is the smallest unit of information in a com-
puter. As discussed earlier, a bit is a basic unit in a binary
number system. A bit or binary digit stands for true or
false, one or zero, on or off. The computer is made up of
numerous switches. Each switch has two states (on and
off). The value of each state represents a bit.
Bits are the basic unit of storage in computers. In
other words, all data is stored in the form of bits. The rea-
son for using a binary number system rather than deci-
mal system for storage (and other purposes) is that with
prevailing technology, it is much easier to implement the
binary system in computers. Implementing the binary
system is significantly cheaper, as well.
The speed of the computer (processor speed) in
terms of processing applications is related to many fac-
tors, including memory space (also known as random
access memory, or RAM). Most home computers are
either 32-bit or 64-bit; 32-bit and 64-bit are the sizes of
the memory space.
BYTES
In computers, bits are bundled together into man-
ageable collections called bytes. A byte consists of eight
bits. Bits and bytes are always clubbed together like atoms
and molecules. Computers are designed to store data and
process instructions in bytes. To handle large quantities
of information (or bits), other units such as kilobytes,
megabytes, and gigabytes are used. One kilobyte (KB) ϭ
1,024 bytes ϭ 2
10
bytes (and not 1,000 bytes as commonly
thought). Similarly, 1 megabyte (MB) ϭ 1,048,576 bytes ϭ
2
20
bytes, and 1 gigabyte (GB) ϭ 1,073,741,824 bytes ϭ 2
30
bytes.
The first computers were 1-byte machines. In other
words, they used octets or 8-bit bytes to store informa-
tion, and they represented 256 values (2
8
values, integers
zero to 255).
The latest computing machines are 64-bit (or eight
bytes). This type of representation makes computing eas-
ier in terms of both storage and speed. Bits and bytes
form the basis of many other computer processes and
functions. These include CD storage, screen resolution,
text coding, data comparison, data transmission, and
much more.
TEXT CODE
All information in the computer is stored in the form
of binary numbers. This includes text, as well. In other
words, text is not stored as text, but as binary numbers.
The rule that governs this representation is known as
ASCII (American Standard Code for Information Inter-
change). The ASCII system assigns a code to every letter
of the alphabet (and other characters). This code is stored
as a seven digit binary number in computers. Moreover,
the ASCII code for a capital letter is different than the
code for the small letter. For example, the ASCII code for
“A” is 10, whereas that for “a” is 97. Consequently, the
value of “A” is stored as 0001010 (its binary representa-
tion), whereas “a” is 1100001.
Every character is stored as eight bits (a leading bit in
addition to the seven bits for the ASCII code), or one
byte. Thus, the word “happy” would require five bytes. An
entire page with 20 lines and 60 characters per line would
require 1,200 bytes.
Computers and Mathematics
REAL-LIFE MATH
117
The main benefit of storing text code as binary num-
bers is that it makes it easier for the computer to store and
process the data. Besides, mathematical operations can be
performed on binary representations of text.
PIXELS, SCREEN SIZE,
AND RESOLUTION
A pixel is derived from the words picture and ele-
ment. The smallest and the most basic unit of images in
computers is the pixel. A pixel is a tiny square block.
Images are made up of numerous pixels. The total num-
ber of pixels in a computer image is known as the resolu-
tion of the image. For example, a standard computer
monitor displays images with the resolution 800 ϫ 600.
This simply means that the image (or the entire computer
screen) is 800 pixels wide and 600 pixels high.
Each pixel is also stored as eight bits (or one byte).
Again, its representation is in the form of binary num-
bers. Storing the value of the color of a pixel is far easier
in binary format, as compared with other formats. The
maximum number of combinations of zeros and ones in
an 8-bit number is 256 (2
8
). Each combination represents
a color. Simply put, every pixel can have one of 256 dif-
ferent colors.
This kind of computer display is called an “8-bit” or
“256-color” display, and was very common in computers
built in the 1990s. In contrast, newer computer monitors
built after the year 2000 have a significantly higher num-
ber of colors (in millions). These are the 16-bit and 24-bit
monitors.
The color of every pixel in a computer image is a
combination of three different colors—red, green, and
blue (RGB). RGB is common terminology used in com-
puter graphics and images, and simply means that every
color is a combination of some portion of red, green, and
blue colors. The value of each of these colors is stored in
one byte. For example, the color of a pixel could be 100 of
red, 155 of green, and 200 of blue. Each of these values is
stored in binary format in a byte. Note that the color val-
ues can range from zero to 255. Thus, every color pixel
has three bytes. Subsequently, a computer monitor with
the resolution 800 ϫ 600 would need 3 ϫ 800 ϫ 600, or
1,440,000 bytes.
IP ADDRESS
Every computer on a network has a specific address.
A number, known as the Internet protocol address, or IP
address, indicates this. The reason for having an IP
address is simple. To send a packet or a letter through reg-
ular mail, the address of the recipient is required. Simi-
larly, for communicating with a computer (from another
computer), the address of that computer is required.
Every computer has a unique IP address that clearly dis-
tinguishes it from other computers. The concept of the IP
address is based on mathematical principles, and there
are rules that govern the value of the IP address. For
example, an IP address is always a set of four numbers
separated by dots (e.g., 204.65.130.40).
Remember, the computer only understands binary
numbers. Consequently, the IP address is also represented
as a binary number. The binary representation is octet
(equivalent to the representation of a byte). Technically,
every IP address is a 32-bit number divided into four
bytes, or octets (eight bites). Each octet represents a spe-
cific number. For example, in the above case, 204 would
be stored in one octet, 65 in another octet, and so on. The
binary representation (as stored in the computer) for
the above-mentioned IP address would be: 11001100
.01000001.10000010.0101000.
Communication between computers becomes far
easier with binary representation. The IP address consists
of two components, the network address and the host
address. The network address (the first two numbers)
represents the address of the entire network. For example,
if a computer is part of a network of computers con-
nected into an entire company, the first two numbers
would represent the IP address of the company. In other
words, for all computers connected to the company net-
work, the first two numbers would remain the same.
Internet mathematics translates binary code into web
addresses and other information.
ROYALTY-FREE/CORBIS.
Computers and Mathematics
118 REAL-LIFE MATH
The host address (the last two numbers) represents
the address of a computer specifically. For example, the
third number might represent a particular department
within a company, whereas the last number would
represent a particular computer in that department.
Consequently, two computers within the same depart-
ment (and part of the same company) would have
the same first three numbers. Only the last number would
be different. Similarly, two computers that are part of dif-
ferent departments would have the same first two
numbers.
As each number in the IP address is allowed a maxi-
mum of one octet (or eight bites), the maximum value
the number can have is 255. In other words, the values of
every number in the IP address ranges from zero to 255.
An IP address that contains a number higher than this
range would be incorrect. For example, 204.256.12.0 is
incorrect, as 256 is not valid.
SUBNET MASK
With the advent of the Internet, the number of com-
puters that are connected worldwide is quickly rising. The
Internet is a huge network of computers. Subsequently,
each computer has an IP address that helps it communi-
cate with the rest. For example, to send an email, the
email address must be entered. This email address is
translated to a specific IP address, that of the recipient. As
of 2005, there are millions of computers connected to the
Internet. As mentioned earlier, IP addresses have a limita-
tion. Each number can only have a value within a specific
range (zero to 255).
The IP address given to any computer on the Inter-
net is temporary. In other words, as soon as a computer
connects to the Internet, it receives a unique IP address.
As soon as the Internet is disconnected, this IP address is
free and can be used by another computer. When the
same computer connects again, it would get another IP
address. With the high number of computers connected
to the Internet simultaneously, it is difficult to accommo-
date every computer within this range. This is where the
concept of Subnet mask comes in.
Subnets, as the name suggests, are sub-networks. The
host address (from the IP address) is divided into further
subnets to accommodate more computers. This is done in
such a way that a part of the host address identifies the
subnet. The subnet is also shown as a binary number.
Communication becomes easier because of the binary
representation.
Take, for example, the IP address 204.65.130.40.
Its binary equivalent is 11001100.01000001.10000010
.00101000.
The subnets would have the same network address
(first two numbers). The first four bits of the host address
(third number) would be the same as well, to identify the
host of the subnet. In this case, 1000 would be
unchanged. The remaining four bits of the host address
would be unique to each subnet. Every subnet, in turn,
can have numerous computers. Every computer on the
subnet would have a unique fourth number in the IP
address. Consider the following scenario:
The main IP address is 11001100.01000001
.10000010.00101000. This could have many subnets such
as 11001100.01000001.10000111.00111010, 11001100
.01000001.10000101.0100010, and so on. Note that the
first four digits of the third number (host address) are same
but the remaining are different, indicating different sub-
nets on the same host. The fourth number indicates a
specific computer on the subnet. For computers on the
same subnet, the first three numbers would remain
the same.
Simply put, the subnet mask ensures that more com-
puters can be accommodated within a network. Every
subnet mask number identifies the network address, the
host, the subnet, as well as the computer.
COMPRESSION
Computers store (and process) data that include
numbers, arithmetic calculations, and words. In addition,
the data may also be in the form of pictures, graphics, and
videos. In computers, data is stored in files. File sizes,
depending on the type of data, can be huge. Many times
the size of a file becomes unmanageable. In such cases, bet-
ter ways of storing and process data, must be used. Given
below are some comparisons to provide a better under-
standing of sizes of different files on a computer.
One alphabetic character is represented by one byte,
one word is equivalent to eight to ten bytes or so, a page
averages about two kilobytes, an entire book averages one
megabyte or more, twenty seconds of good quality video
occupy anywhere from two to ten megabytes, and so on.
Similarly, a compact disc (CD) has 600–800 megabytes
of data.
Storing such huge amounts of information in a com-
puter can often be difficult. Besides, it is almost impossi-
ble to send large data from one computer to another
through e-mail or other similar means. Moreover, down-
loading a significant amount of data from the Internet
(such as movie files, databases, application programs) can
be extremely time consuming, especially if using a slow
dial up connection. This is where compression of the data
into a manageable size becomes important.
Computers and Mathematics
REAL-LIFE MATH
119
Certain applications based on mathematical algo-
rithms compress the data. This allows the basic data that
a computer sees in binary format, to be stored in a com-
pressed format requiring much lower storage space.
Compressed data can be uncompressed using the same
application and algorithm.
Compression is extremely beneficial, especially when
a large file has to be sent from one computer to another.
In case of e-mail, sending a one-megabyte (MB) file
through a dial up connection, would take considerable
time, anywhere from fifteen to thirty minutes. Bigger files
would take even longer. Besides, e-mails might not have
the capacity of sending (or receiving) bigger files. In such
cases, sending zipped files that are much smaller is useful.
Similarly, downloading compressed files from the Inter-
net rather than the large original ones is a better option.
There are also other types and methods for compress-
ing. Run length compression is another type that is used
widely. In run length compression, large chunks, or runs, of
consecutive identical data values are taken, and each of
these is replaced by a common code. In addition to the
code, the data value and the total length are also recorded.
Run length compression can be quite effective. However, it
is not used for certain types of data such as text, and exe-
cutable programs. For these types of files, run length com-
pression does not work. Without going into the technical
specifics of run length compression, this method works
quite well on certain types of data (especially images and
graphics), and is subsequently applied to many data com-
pression algorithms. Most compressed files can be un-
compressed to obtain the original. However, in almost all
cases, some data is lost in the process. For visual and audio
data, some loss of quality is allowed without losing the
main data. By taking advantage of limitations of the
human sensory system, a great deal of space is saved while
creating a copy that is very similar to the original. In other
words, although compression results in some data loss, this
loss can be insignificant and the naked eye usually cannot
usually discern the difference between the original and the
un-compressed file. The defining characteristics of these
compression methods are their compression speed,
the compressed size, and the loss of data during
compression.
Apart from computers, compression of images and
video is also used in digital cameras and camcorders. The
main purpose is to reduce the size of the image (or video)
without compromising on the quality. Similarly, DVDs
also use compression techniques based on mathematical
algorithms to store video.
In audio compression, compression methods remove
non-audible (or less audible) components of the signal
while compressing. Compression of human speech is
sometimes done using algorithms and tools that are far
more complex. Audio compression has applications in
Internet telephony (voice chat through the internet),
audio CDs, MP3 CDs, and more.
DATA TRANSMISSION
In computing, data transmission means sending a
stream of data (in bits or bytes) from one location to another,
using different technologies. Two of these technologies are
coding theory and hamming codes. These are both based on
algorithms and other mathematical concepts.
Coding theory ensures data integrity during trans-
mission. In other words, it ascertains that the original
data is safely received, without any loss. Messages are usu-
ally not transmitted in their original form. They are
transmitted in coded or encrypted form (described later).
Coding theory is about making transmitted messages
easy to read. Coding theory is based on algorithms. In
1948, the mathematician Claude Shannon presented cod-
ing theory by showing that it was possible to encode in an
effective manner. In its simplest form, a coded message is
in the form of binary digits or bits, strings of zero or one.
The bits are transmitted along a channel (such as a tele-
phone line). While transmitting, a few errors may occur.
To compensate for the errors, more bits of information
than required are generally transmitted.
The simplest method (part of the coding theory
developed by Shannon) for detecting errors in binary
data is the parity code. Concisely, this method transmits
an extra bit, known as the parity bit, after every seven bits
from the source message. However, the parity code
method can merely detect errors, not correct them. The
only method for correcting them is to ask for the data to
be transmitted again.
Shannon developed another algorithm, known as the
repetition algorithm, to ensure detection as well as correc-
tion of errors. This is accomplished by repeating each bit
a specific number of times. The recipient sees which value
(zero or one) occurred more often and assumed that was
the actual value. This process can detect and correct any
number of errors, depending on how many repeats of each
bit are sent. The disadvantage of the repetition algorithm
is that it transmits a high number of bits, resulting in a
considerable amount of repetitive bits. Besides, the
assumption that a bit that is received more often, is the
actual bit, may not hold true in all cases.
Another mathematician, Richard Hamming (1915–
1998), built more complex algorithms for error correction.
Known as Hamming codes, these were more efficient, even
Computers and Mathematics
120 REAL-LIFE MATH
with very low repetition. Initially, Hamming produced a
code (based on an algorithm) in which four data bits were
followed by three check bits that allowed the detection and
the correction of a single error. Although, the number of
additional bits is still high, it is without a doubt lower than
the total number of bits transmitted by the repetition algo-
rithm. Subsequently, these additional bits (check bits) were
reduced even further by improving the underlying algo-
rithms. Hamming codes are commonly used for transmit-
ting not just basic data (in the form of simple email
messages), but also more complex information.
One such example is astronomy. The National Aero-
nautics and Space Administration (NASA) uses these
techniques while transmitting data from their spacecrafts
back to Earth (and vice versa). Take, for example, the
NASA Mariner spacecraft sent to Mars in the 1960s. In
this case, coding and error correction in data transmis-
sion was vital, as the data was sent from a weak transmit-
ter over very long distances. Here the data was read
perfectly using the Hamming code algorithm. In the late
1960s and early 1970s, the NASA Mariner sent data using
more advanced versions of the Hamming and coding the-
ories, capable of correcting seven errors out of thirty-two
bits transmitted. Using this algorithm, over 16,000 bits
per second of data was successfully relayed back to Earth.
Similar data transmission algorithms are used exten-
sively for communication through the Internet since the
late 1990s. The Hamming codes are also used in prepar-
ing compact discs (CDs). To guard against scratches,
cracks, and similar damage, two overlapped Hamming
codes are used. These have a high rate of error correction.
ENCRYPTION
Considerable confidential data is stored and trans-
mitted from computers. Security of such data is essential.
This can be achieved through specialized techniques
known as encryption. Encryption converts the original
message into coded form that cannot be interpreted
unless it is de-coded back to the original (decryption).
Encryption, a concept of cryptography, is the most effec-
tive way to achieve data security. It is based on complex
mathematical algorithms.
Consider the message abcdef1234ghij56789. There
are several ways of coding (or encrypting) this informa-
tion. One of the simplest ways is to replace each alphabet
by a corresponding number, and vice versa. For example,
“a” would become “1”, “b” would be “2”, and so on. The
above original message can, thus be encrypted as
123456abcd78910 efghi. The message is decrypted using
the same process and converted back in the original form.
Complex mathematical algorithms are designed to cre-
ate far more complex encryption methods. The informa-
tion regarding the encryption method is known as the key.
Cryptography provides three types of security for data:
• Confidentiality through encryption—This is the
process mentioned above. All confidential data is
encrypted using certain mathematical algorithms. A
key is required to decrypt the data back into its origi-
nal form. Only the right people have access to the key.
• Authentication—A user trying to access coded or
protected data must authenticate himself/herself.
This is done through his/her personal information.
Password protection is a type of authentication that
is widely used in computers and on the Internet.
• Integrity—This type of security does not limit access
to confidential information, as in the above cases.
However, it detects when such confidential is modi-
fied. Cryptographic techniques, in this case, do not
show how the information has been modified, just
that it has been modified.
There are two main types of encryption used in
computers (and the Internet)—asymmetric encryption
(or public-key encryption), and symmetric encryption
(or secret key encryption). Each of these is based on dif-
ferent mathematical algorithms that vary in function and
complexity.
In brief, public key encryption uses a pair of keys, the
public key, and the private key. These keys are compli-
mentary, in the sense that a message encrypted using a
particular public key can only be decrypted using a cor-
responding private key. The public key is available to all
(it is public). However, the private key is accessible only
by the receiver of a data transmission. The sender
encrypts the message using the public key (corresponding
to the private key of the receiver). Once the receiver gets
the data, it is decrypted using the private key. The private
key is not shared with anyone other than the receiver, or
the security of the data is compromised.
Alternatively, symmetric secret key encryption relies
on the same key for both encryption and decryption. The
main concern in this case is the security of the key. Sub-
sequently, the key has to be such that even if someone gets
hold of it, the decryption method does not become too
obvious. For this purpose, encryption and decryption
algorithms for secret key encryption are quite complex.
The key, as expected, is shared only by the receiver
and the sender (unlike public key encryption, where
everyone knows the public key). The key can be anything
ranging from a number, a word, or a string of jumbled up
letters and other characters. In simple terms, the original
Computers and Mathematics
REAL-LIFE MATH
121
data is encoded using a simple or complex technique
defined by a mathematical algorithm. The key also holds
the information on how the algorithm works. The same
algorithm can then be used to decode the message back
into its original form.
Encryption is used frequently in computers. Most
data is protected using one of the above mentioned
encryption techniques. The Internet also widely applies
encryption. Most websites protect their content using
these methods. In addition, payment processing on
websites also follows complex encryption algorithms (or
standards) to protect transactions.
Where to Learn More
Books
Cook, Nigel P. Introductory Computer Mathematics.Upper
Saddle River, NJ: Prentice Hall, 2002.
Graham, Ronald H., et al. Concrete Mathematics: A Foundation
for Computer Science. Boston, MA: Addison-Wesley, 1994.
Key Terms
Bit: The smallest unit of storage in computers. A bit
stores a binary value.
Byte: A byte is a group of eight bits.
Encryption: Using a mathematical algorithm to
code a message or make it unintelligible.
Pixel: Short for “picture,” a pixel is the smallest
unit of a computer graphic or image. It is also
represented as a binary number.
122 REAL-LIFE MATH
Conversions
Overview
Conversion is the process of changing units of meas-
urement from one system to another. The ability to con-
vert units such as distance, weight, and currency is an
increasingly important skill in an emerging global econ-
omy. In area of research and technological applications
such as science and engineering, the ability to convert
data is crucial.
No better example of how critical a role conversion
math can play can be found in the destruction of NASA’s
Mars Climate Orbiter in 1999. The Mars Climate Orbiter
was one of a series of NASA missions in a long-term pro-
gram of Mars exploration known as the Mars Surveyor
Program. The orbiter mission was designed to have the
orbiter fire its main engine to enter into orbit around
Mars at an altitude of about 90 miles (about 140 km).
However, a series of errors caused the probe to come too
close to Mars and, as a result, the probe was only about
35 miles (57 km) from the Martian surface when it
attempted to enter orbit—an altitude far below the min-
imum safe altitude for orbit. As a result the Mars Climate
Orbiter is presumed to have been destroyed as it reentered
the Martian atmosphere.
Engineering teams contracted by NASA used differ-
ent measurement systems (English and metric) and never
converted the two measurements. As a result, the probe’s
attitude adjustment thrusters failed to fire properly and
the probe drifted off course toward its fatal demise.
Fundamental Mathematical Concepts
and Terms
In addition to traditional English measurements,
International System of Units (SI) and MKS (meter-
kilogram-second) units are part of the metric system, a
system based on powers of ten. The metric system is used
throughout the world—and in most cases provides the
standard for measurements used by scientists. On an
everyday basis, nearly everyone is required to convert val-
ues from one unit to another (e.g., the conversion from
kilometers per hour to miles per hour).
This need for conversation applies widely across
society, from fundamental measurement of the gap in
spark plugs to debate and analysis over sports records.
When values are multiplied or divided, they can each
have different units. When adding or subtracting values,
however, the values must added or subtracted must have
the same units. A notation such as “ms
Ϫ1
” is simply a dif-
ferent way of indicating m/s (meters per second).
Conversions
REAL-LIFE MATH
123
Units must properly cancel to yield a proper conver-
sion. If an Olympic sprinter runs 200-meter race in 19.32
seconds, he runs at an average speed of average speed of
10.35 meters per second [200 m / 19.32 s ϭ 10.35 m/s]. If
a student wishes to convert this to miles per hour the
conversion should be carried out as follows: (10.35 m/s)
(1 mile / 1,609 m) (3,600 s / 1 hr) ϭ 23.2 miles/hr. The units
cancel as follows: (10.35
m
/
s
) (1 mile / 1,609
m
) (3,600
s
/
1 hr) ϭ 23.2 miles/hr.
Students should remember to be cautious when
dealing with units that are squared, cubed, or that carry
another exponent. For example, a cube that is 10 cm on
each side has a volume that is expressed as a cube value
(e.g., m
3
that is determined from multiplying the cube’s
length times the width times the height: V ϭ (10 cm)
(10 cm)(10 cm) ϭ 1,000 cm
3
.
Many conversions are autoprogrammed into
calculators—or are easily made with the use of tables
and charts.
THE METRIC UNITS
The SI starts by defining seven basic units: one each
for length, mass, time, electric current, temperature,
amount of substance, and luminous intensity. (“Amount
of substance” refers to the number of elementary particles
in a sample of matter. Luminous intensity has to do with
the brightness of a light source.) However, only four of
these seven basic quantities are in everyday use by non-
scientists: length, mass, time, and temperature.
The defined SI units for these everyday units are the
meter for length, the kilogram for mass, the second for
time, and the degree Celsius for temperature. (The other
three basic units are the ampere for electric current, the
mole for amount of substance, and the candela for lumi-
nous intensity.) Almost all other units can be derived
from the basic seven. For example, area is a product of
two lengths: meters squared, or square meters. Velocity or
speed is a combination of a length and a time: kilometers
per hour.
Because the meter (1.0936 yd) is much too big for
measuring an atom and much too small for measuring
the distance between two cities, we need a variety of
smaller and larger units of length. But instead of invent-
ing different-sized units with completely different names,
as the English-American system does, metric adaptations
are accomplished by attaching a prefix to the name of the
unit. For example, since kilo- is a Greek form meaning a
thousand, a kilometer is a thousand meters. Similarly, a
kilogram is a thousand grams; a gigagram is a billion
grams or 10
9
grams; and a nanosecond is one billionth of
a second or 10
Ϫ9
second.
THE ENGLISH SYSTEM
In contrast to the metric system’s simplicity stands
the English system of measurement (a name retained to
honor the origin of the system) that is based on a variety
of standards (most completely arbitrary).
There many English units, including buckets, butts,
chains, cords, drams, ells, fathoms, firkins, gills, grains,
hands, knots, leagues, three different kinds of miles, four
kinds of ounces, and five kinds of tons. There are literally
hundreds more. For measuring volume or bulk alone, the
English system uses ounces, pints, quarts, gallons, barrels
and bushels, among many others.
THE INTERNATIONAL SYSTEM
OF UNITS (SI)
The metric system is actually part of a more compre-
hensive International System of Units, a comprehensive
set of measuring units. In 1938, the 9th General [Interna-
tional] Conference on Weights and Measures, adopted
the International System of Units. In 1960, the 11th Gen-
eral Conference on Weights and Measures modified the
system and adopted the French name Système Interna-
tional d’Unités, abbreviated as SI.
Nine fundamental units make up the SI system.
These are the meter (abbreviated m) for length, the kilo-
gram (kg) for mass, the second (s) for time, the ampere
(A) for electric current, the Kelvin (K) for temperature,
the candela (cd) for light intensity, the mole (mol) for
quantity of a substance, the radian (rad) for plane angles,
and the steradian (sr) for solid angles.
Odometers sit in a shop that legally converts odometers
from kilometers to miles in used cars imported from
Canada.
AP/WIDE WORLD PHOTOS. REPRODUCED BY PERMISSION.
Conversions
124 REAL-LIFE MATH
DERIVED UNITS
Many physical phenomena are measured in units
that are derived from SI units. As an example, frequency
is measured in a unit known as the hertz (Hz). The hertz
is the number of vibrations made by a wave in a second.
It can be expressed in terms of the basic SI unit as s
Ϫ1
.
Hertz units are used to describe, measure, and calibrate
radio wavelengths and computer processing speeds.
Pressure is another derived unit. Pressure is defined
as the force per unit area. In the metric system, the unit of
pressure is the Pascal (Pa) and can be expressed as kilo-
grams per meter per second squared, or kg/m s
2
.Mea-
surements of pressure are important in determining
whether gaskets and seals are properly placed on
automobile motors or properly functioning in air-
conditioning units.
Even units that appear to have little or no relation-
ship to the nine fundamental units can, nonetheless, be
expressed in terms of those units. The absorbed dose, for
example, indicates that amount of radiation received by a
person or object. In the metric system, the unit for this
measurement is the “gray.” One gray can be defined in
terms of the fundamental units as meters squared per sec-
ond squared, or m
2
/ s
2
.
Many other commonly used units can also be
expressed in terms of the nine fundamental units. Some
of the most familiar are the units for area (square meter:
m
2
), volume (cubic meter: m
3
), velocity (meters per
second: m/s), concentration (moles per cubic meter:
mol/m
3
), and density (kilograms per cubic meter: kg/m
3
).
As previously mentioned, a set of prefixes is available
that makes it possible to use the fundamental SI units to
express larger or smaller amounts of the same quantity.
Among the most commonly used prefixes are milli- (m)
for one-thousandth, centi- (c) for one-hundredth, micro-
() for one-millionth, kilo- (k) for one thousand times,
and mega- (M) for one million times. Thus, any volume
can be expressed by using some combination of the fun-
damental unit (liter) and the appropriate prefix. One mil-
lion liters, using this system, would be a megaliter (ML)
and one millionth of a liter, a microliter (L).
UNITS BASED ON PHYSICAL
OR “NATURAL” PHENOMENA
In the field of electricity the charge carried by a sin-
gle electron is known as the elementary charge (e) and
has the value of 1.6021892 ϫ 10
Ϫ19
coulomb. This is
termed a “natural” unit.
Other real-world or “natural” units of measurement
include the speed of light (c: 2.99792458 ϫ 10
8
m/s), the
Planck constant (6.626176 ϫ 10
Ϫ34
joule per hertz), the
mass of an electron (m
e
: 0.9109534 ϫ 10
Ϫ30
kg), and the
mass of a proton (m
p
: 1.6726485 ϫ 10
Ϫ27
kg).
Each of the above units can be expressed in terms of
SI units, but they are often also used as basic units in spe-
cialized fields of science.
A Brief History of Discovery
and Development
Because the United States is the world’s leading pro-
ducer in many items, regardless of the near universal
acceptance of the SI, the most frequent conversions
between units are between the English system of weights
and measures to those of the metric system. The metric
system of measurement, first advanced and adopted by
the France in the late eighteenth and early nineteenth
century, has grown to become the internationally agreed-
upon set of units for commerce, science, and engineering.
The United States is the only major economic power
to yet fully embrace the metric system. The history of the
metric system in the United States is bumpy, with
progress toward inevitable metrification coming slowly
over two centuries.
As early as 1800, U.S. government agencies adopted
metric meter and kilogram measurements and standards.
In 1866, the U.S. Congress first authorized the use of the
metric system. Although internal progress is halting at
best, the United States is one of the 17 original signers of
the treaty establishing the International Bureau of
Weights and Measures that was intended to provide
worldwide metric standards. Most Americans do not
know, for example, that since 1893, the units of distance
(foot, yard), weight (pound), and volume (quart), have
been officially defined in terms of their relation to the
metric meter and kilogram.
After the modernization and international expan-
sion of the metric system in the 1960s and 1970s follow-
ing adoption of the SI, the United States soon stood alone
among modern industrialized nations in failing to make
full conversion. The English system was abandoned by
the English as early as 1965 as part of Great Britain’s inte-
gration into the European Common Market (a forerun-
ner of the modern European Union) and countries such
as Canada completed massive metrification efforts
throughout the 1970s.
Following Congressional resolutions and studies that
recommended U.S. conversion to the metric system
by 1980, an effort toward voluntary conversion began
with the 1975 Metric Conversion Act that established
a subsequently short-lived U.S. Metric Board. The
Conversions
REAL-LIFE MATH
125
American public simply refused to embrace and use met-
ric standards.
It was not until 1988 the Congress once again tried to
spur metric conversion with the Omnibus Trade and
Competitiveness Act of 1988. The Act specified that met-
ric measurements are to be considered the “preferred
system of weights and measures for U.S. trade and com-
merce.” The Act also specified that federal agencies use the
metric measurements in the course of their business.
Regardless of the efforts of leaders in science and
industry, early into the twenty-first century, U.S. progress
remains spotty and slow. However, the demands of global
commerce and the economic disadvantages of the use of
non-metric measurements provide an increasingly pow-
erful incentive for U.S. metrification.
Although the SI is the internationally accepted sys-
tem, elements of the English system of measurement con-
tinue in use for specialized purposes throughout the
world. All flight navigation, for example, is expressed in
terms of feet, not meters. As a consequence, it is still nec-
essary for a mathematically literate person to be able to
perform conversion from one system of measurement to
the other.
Real-life Applications
There are more than 50 officially recognized SI units
for various scientific quantities. Given all possible combi-
nations there are millions of possible conversions possible.
All of these require various conversion factors. However,
in addition to metric conversions, a wide range of conver-
sions are used in everyday situations—from conversion
of kitchen measurements in recipes to the ability to con-
vert mathematical data into representative data found in
charts, graphs, and various descriptive systems.
Historical Conversions
Historians and archaeologists are often called upon
to interpret text and artifacts depicting ancient systems of
measurement. To make a realistic assessment of evidence
from the past they must be able to convert the ancient
measurements into modern equivalents.
For example, the Renaissance Italian artist, Leonardo
da Vinci used a unit of measure he termed a braccio (Eng-
lish: arm) in composing many of his works. In Florence
(Italian: Firenze) braccio equaled two palmi (English:
palms). However, historians have noted that the use of such
terms and units was distinctly regional and that various
conversion factors must be used to compare drawings
and manuscripts. In Florence, a braccio equaled about
23 in. (58 cm), but in other regions (or among different
professional classes) the braccio was several inches
shorter. In Rome, the piede (English: foot) measured near
it modern equivalent of 12 in. (30 cm) but measured up
to 17 in. (34 cm) in Northern Italy.
Conversion of Temperature Units
Temperature can be expressed as units of Celsius,
Fahrenheit, Kelvin, Rankin, and Réaumur.
The metric unit of temperature is the degree Celsius
(ЊC), which replaces the English system’s degree Fahren-
heit (ЊF). In the scientists’ SI, the fundamental unit of
temperature is actually the kelvin (K). But the kelvin and
the degree Celsius are exactly the same size: 1.8 times as
large as the degree Fahrenheit. One cannot convert
between Celsius and Fahrenheit simply by multiplying or
dividing by 1.8, however, because the scales start at differ-
ent places. That is, their zero-degree marks have been set
at different temperatures.
The measurement of thermal energy involves indi-
rect measurement of the molecular kinetic energies of a
substance. Rather than providing an absolute measure of
molecular kinetic energy, thermal measurements are
designed to determine differences that result from work
done on, or by, a substance (e.g., heat added to, or
removed from, a substance). Temperature differences
correspond to changes in thermal energy states, and there
are several analytic methods used to measure differences
in thermal energy via measurement of temperature.
When dealing with the terminology associated with the
measurement of thermal energy, one must be mindful
that there is no actual substance termed “energy” and no
actual substance termed “heat.” Accordingly, when speak-
ing of energy “transfer” or heat “flow” one is actually
referring to changes in functions of state that can only be
raised or lowered within a body or system. Neither energy
or heat can really be “transferred” or “flow.”
In thermodynamics, temperature is directly related
to the average kinetic energy of a system due to the agita-
tion of its constituent particles. In practical terms, tem-
perature measures heat and heat measures the thermal
energy of a system.
In meteorological systems, for example, temperature
(as an indirect measure of heat energy) reflects the level
of sensible thermal energy of the atmosphere. Such meas-
urements use thermometers and are expressed on a given
temperature scale, usually Fahrenheit or Celsius.
Conversions
126 REAL-LIFE MATH
The common glass thermometer containing either
mercury or alcohol uses the property of thermal expan-
sion of the respective fluid as an indirect measure of the
increase or decrease in the thermal energy of a body or
system. Other types of thermometers utilize properties
such as electrical resistance, magnetic susceptibility, or
light emission to measure temperature.
Electrical thermometers (e.g., thermoprobes, ther-
mistor, thermocouples, etc.) relate changes in electrical
properties (e.g., resistivity) to changes in temperature
are extensively used in scientific research and industrial
engineering.
Because energy is commonly defined as the ability to
do work, the thermal energy of a system is directly related
to a system’s ability to translate heat energy into work.
Correspondingly, the measurement of the thermal energy
of a system must be interpreted as the measurement of
the changes in the ability of a system or body to do work.
Absolute zero Kelvin—notice that Kelvin is not expressed
as “degrees Kelvin”—(Ϫ459.69ЊF, Ϫ273.16ЊC, 0ЊR on the
Rakine scale)—is the lowest temperature theoretically
possible. At absolute zero there is a minimum of vibra-
tory motion (not an absence of motion) and, by defini-
tion, no work can be done by a system on its surrounding
environment. In this regard, such a system (although not
motionless) would be said to have zero thermal energy.
In 1714, the German physicist Daniel Gabriel
Fahrenheit (1686–1736) created a thermometer using liq-
uid mercury. Mercury has a uniform volume change with
temperature, a lower freezing point and higher boiling
point than water, and does not wet glass. Mercury ther-
mometers made possible the development of repro-
ducible temperature scales and quantitative temperature
measurement. Fahrenheit first chose the name “degree”
(German: grad) for his unit of temperature. Then, to fix
the size of a degree (Њ), he decided that it should be of
such size that there are exactly 180Њ between the temper-
ature at which water freezes and the temperature at which
water boils. (180 is a “good” number because it is divisi-
ble by one and by 16 other whole numbers. That is why
360, or 2 ϫ 180, which is even better, was originally cho-
sen as the number of “degrees” into which to divide a
circle.) Fahrenheit now had a size for his degree of tem-
perature, but no standard reference values. Where should
the freezing and boiling points of water fall on the scale?
He eventually decided to fix zero at the coldest tempera-
ture that he could make in his laboratory by mixing ice
with various salts that make it colder. (Salts, when mixed
with cold ice, lower the melting point of ice, so that when
it is melting it is at a lower temperature than usual.)
When he set his zero at that point, the normal freezing
point of water turned out to be 32Њ higher. Adding 180 to
32 gave 212Њ, which he used for the normal boiling point
of water. Thus, freezing water falls at 32Њ and boiling
water falls at 212Њ on the Fahrenheit scale. The normal
temperature of a human being is about 99Њ.
In 1742, the noted Swedish astronomer Anders Cel-
sius (1701–1744), professor of astronomy at the Univer-
sity of Uppsala (Sweden), proposed the temperature scale
which now bears his name, although for many years it
was called the centigrade scale. As with the Fahrenheit
scale, the reference points were the normal freezing and
normal boiling points of water, but he set them to be 100Њ
apart instead of 180. Because the boiling point and, to a
lesser extent, freezing point of a liquid depend on the
atmospheric pressure, the pressure must be specified:
“normal” means the freezing and boiling points when the
atmospheric pressure is exactly one atmosphere. These
points are convenient because they are easily attained and
highly reproducible. Interestingly, Celsius at first set boil-
ing as zero and freezing as 100, but this was reversed in
1750 by the physicist Martin Strömer, Celsius’s successor
at Uppsala.
Defined in this way, a Celsius degree (ЊC) is 1/100 of
the temperature difference between the normal boiling
and freezing points of water. Because the difference
between these two points on the Fahrenheit scale is 180ЊF,
a Celsius degree is 1.8 times (or 9/5) larger than a Fahren-
heit degree. You cannot convert between Fahrenheit and
Celsius temperatures simply by multiplying by 1.8, how-
ever, because their zeroes are at different places. That
would be like trying to measure a table in both yards and
meters, when the left-hand ends (the zero marks) of the
yardstick and meter stick are not starting at the same place.
One method to convert temperature from Fahren-
heit to Celsius or vice versa, is to first account for the dif-
ferences in their zero points. This can be done very simply
by (step 1) adding 40 to the temperature you want to con-
vert. That is because -40Њ (40 below zero) happens to come
out at the same temperature on both scales, so adding 40
gets them both up to a comparable point: zero. Then (step
2) you can multiply by 1.8 (9/5) convert Celsius to Fahren-
heit or divide by 1.8 (9/5) to convert Fahrenheit to Celsius
to account for the difference in degree size, and finally
(step 3) subtract the 40Њ originally added.
WEATHER FORECASTING
An understanding of the daily weather forecast, espe-
cially in areas outside the United States requires the ability
to convert temperatures between Celsius and Fahrenheit
temperature scales. The standard conversion from
Fahrenheit to Celsius is expressed as ЊC ϭ (ЊF Ϫ32) / 1.8.
Conversions
REAL-LIFE MATH
127
Accordingly a 72ЊF expected high temperature equates to
approximately 22.2ЊC.
COOKING OR BAKING TEMPERATURES
To convert a temperature used for cooking (the
expected oven temperature) for an French recipe for bak-
ing bread one might be called on to convert ЊC to ЊF and
that conversion is obtained via ЊF ϭ (ЊC ϫ 1.8) + 32. So
if an oven should be set at 275 ЊC in France to produce a
crispy baguette (the traditional French long an thin loaf
of bread) then an oven calibrated in ЊF should be set to
approximately 525ЊF (275ЊC ϫ 1.8) + 32 ϭ 527ЊF.
Canceling Units
Notice that we are performing simple conversions,
without the formality of labeling the units that must can-
cel to make the transformation. In the above example
regarding oven temperature, the conversion factor 1.8
really represents 1.8ЊF / 1ЊC, read as 1.8 degrees Celsius to
1 degree Fahrenheit. This allows the units to cancel
(275ЊC ϫ 1.8 ЊF / 1 ЊC) + 32ЊF ϭ 527ЊF.
In the prior example related to weather, the factor
reciprocal of the factor 1.8 is used in the conversion formula
ЊC ϭ (ЊF Ϫ 32) / 1.8 equals 1ЊC per 1.8 ЊF or 1ЊC / 1.8ЊF and
so the ЊF cancels as 22.2ЊC ϭ (72 Ϫ 32) ЊF / 1.8 ЊC / ЊF.
ABSOLUTE SYSTEMS
About 1787 the French physicist Jacques Charles
(1746–1823) noted that a sample of gas at constant pres-
sure regularly contracted by about 1/273 of its volume at
0ЊC for each Celsius degree drop in temperature. This
suggests an interesting question: If a gas were cooled to
273Њ below zero, would its volume drop to zero? Would it
just disappear? The answer is no, because most gases will
condense to liquids long before such a low temperature is
reached, and liquids behave quite differently from gases.
In 1848 William Thomson (1824–1907), later Lord
Kelvin, suggested that it was not the volume, but the
molecular translational energy, that would become zero
at about –273ЊC, and that this temperature was therefore
the lowest possible temperature. Thomson suggested a
new and more sensible temperature scale that would have
the lowest possible temperature—absolute zero—set as
zero on this scale. He set the temperature units as identi-
cal in size to the Celsius degrees. Temperature units on
Kelvin’s scale are now known as Kelvins (abbreviation, K);
the term, degree, and its symbol, Њ, are not used. Lord
Kelvin’s scale is called either the Kelvin scale or the
absolute temperature scale. The normal freezing and
boiling points of water on the Kelvin scale, then, are 273K
and 373K, respectively, or, more accurately, 273.16K and
373.16K. To convert a Celsius temperature to Kelvin, just
add 273.16.
The Kelvin scale is not the only absolute temperature
scale. The Rankine scale, named for the Scottish engineer
William Rankine (1820–1872), also has the lowest possi-
ble temperature set at zero. The size of the Rankine
degree, however, is the same as that of the Fahrenheit
degree. The Rankin temperature scale is rarely used today.
Absolute temperature scales have the advantage that
the temperature on such a scale is directly proportional to
the actual average molecular translational energy, the
property that is measured by temperature. For example, if
one object has twice the Kelvin temperature of another
object, the molecules, or atoms, of the first object actually
have twice the average molecular translational energy of
the second. This is not true for the Celsius or Fahrenheit
scales, because their zeroes do not represent zero energy.
For this reason, the Kelvin scale is the only one that is
used in scientific calculations.
Conversion of measurements in recipes if often necessary.
ALEN MACWEENEY/CORBIS.
Conversions
128 REAL-LIFE MATH
ARBITRARY SYSTEMS
On the Réaumur scale, almost forgotten except in parts
of France, freezing is at 0 degrees, and the boiling point is at
80 as opposed to 100Њ Celsius, or 212Њ Fahrenheit. The gra-
dation of temperature scales is, however, arbitrary.
Conversion of Distance Units
Distance conversions are common to hundreds of
everyday tasks, from driving to measuring. Conversion
factors for distance are uncomplicated and easily
obtained from calculators and conversion tables (e.g., 1
inch ϭ 2.54 centimeters, 1 yard ϭ 0.9144 meter, and 1
mile ϭ 1.6093 km).
The meter was originally defined in terms of Earth’s
size; it was supposed to be one ten-millionth of the dis-
tance from the equator to the North Pole, going straight
through Paris. However, because Earth is subject to geo-
logical movements, this distance cannot be depended
upon to remain the same forever. The modern meter,
therefore, is defined in terms of how far light will travel in
a given amount of time when traveling at—naturally—
the speed of light. The speed of light in a vacuum is con-
sidered to be a fundamental constant of nature that will
never change, no matter how the continents drift. The
standard meter turns out to be 39.3701 inches.
10K and 5K walks and races (measuring 10 and 5
kilometers, properly abbreviated km, or 10,000 and 5,000
meters) are popular events, often used for local charitable
fund raising and well as sports competition. A 10K race is
about 6.21 miles and a 5K race is, of course, half that dis-
tance (about 3.11 miles, with rounding). One kilometer ϭ
.6214 mile and so 10,000 km ϫ .6214 miles/km ϭ 6.21 km.
Other units of measurement related to distance
encountered include: Admiralty miles, angstroms, astro-
nomical units, chains, fathoms, furlongs (still used in
horse racing), hands, leagues, light years, links, mils
(often used to measure paper thickness), nautical miles
(with different U.K. and U.S. standards), parsecs, rods,
Roman miles (milia passuum), Thous, and Unciae
(Roman inches).
A traffic sign near the U.S. border in Quebec.
OWEN FRANKEN/CORBIS.
Conversions
REAL-LIFE MATH
129
Conversion of Mass Units
The kilogram is the metric unit of mass, not weight.
Mass is the fundamental measure of the amount of mat-
ter in an object. For example, the mass of an object will
not change if you take it to the Moon, but it will weigh
less—have less weight—when it lands on the Moon
because the Moon’s smaller gravitational force is pulling
it down less strongly.
Regardless, in everyday terms on Earth, we often speak
loosely about mass and weight as if they were the same
thing. So you can feel free to “weigh” yourself (not “mass”
yourself) in kilograms. Unfortunately, no absolutely
unchangeable standard of mass has yet been found to stan-
dardize the kilogram on Earth. The kilogram is therefore
defined as the mass of a certain bar of platinum-iridium
alloy that has been maintained since 1889 at the Interna-
tional Bureau of Weights and Measures in Sèvres, France.
The kilogram turns out to be approximately 2.2046 pounds.
To convert from the pound to the kilogram, for
example, it is necessary to multiply the given quantity (in
pounds) by the factor 0.45359237. A conversion in the
reverse direction, from kilograms to pounds, involves
multiplying the given quantity (in kilograms) by the fac-
tor 2.2046226.
For large masses, the metric ton is often used instead
of the kilogram. A metric ton (often spelled tonne in other
countries) is 1,000 kilograms. Because a kilogram is about
2.2 pounds, a metric ton is about 2,200 pounds—ten per-
cent heavier than an American ton of 2,000 pounds.
Some remnants of English weights and measures still
exist in popular culture. It is not uncommon to have weights
of athletes in football (American soccer) and rugby matches
quoted by commentators in terms of “stones.” A stone is
the equivalent of 14 pounds, so a 15-stone goalkeeper or
rugby forward would weigh a formidable 210 pounds.
Other units of mass encountered include carats
(used for measuring precious stones such as diamonds),
drams, grains, hundredweights, livre, ounces (Troy), pen-
nyweights, pfund, quarters, scruples, slus, and Zentners.
Conversion of Volume Units
For volume, the most common metric unit is not the
cubic meter, which is generally too big to be useful in
commerce, but the liter, which is one thousandth of a
cubic meter. For even smaller volumes, the milliliter, one
thousandth of a liter, is commonly used.
Other units of volume include acre-feet, acre-inches,
barrels (used in the petroleum industry and equivalent to
42 U.S. gallons), bushels (both United States and
United Kingdom), centiliters, cups (both U.S. and
metric), dessertspoons (U.S., U.K., and metric, and in
the U.S. about double the teaspoon in volume)
fluid drams, pecks, pints, quarts, tablespoons, and
teaspoons.
Units such as tablespoons and teaspoons are among
the most common of hundreds of units related to cook-
ing where units can be descriptive (e.g., a “pinch” of salt).
Most cookbooks carry conversions factors for units
described in the book.
In the United States, gasoline is sold and priced by
the English gallon, but in Europe gasoline is sold and
priced by the liter. The unsuspecting tourist may not take
immediate notice at the great difference in price because
roadside signs advertising the two can sometime be very
similar. Aside from differences in currency value
explained below, a price of $2.10 per gallon is far less than
1.30 € (Euros) per liter. There are more than 3.78 liters
per gallon and so the price of 1.30 €/liter must be multi-
plied by 3.78 to arrive at a gallon equivalent cost of
approximately 4.91 Euros per gallon.
Currency Conversion
The price difference in the above fuel purchase
example is exacerbated (increased not for the better) by
the need to convert the value of the two currencies
involved. As of mid-2005, 1 Euro equaled $1.25 (in other
words, it took $1.25 to purchase 1 Euro). And so the
actual price of the fuel in the above example was 1.30
Euro/liter ϫ 1.25 $/Euro ϭ 1.625 $/liter and thus a gallon
equivalent price of $6.14 per gallon (1.625 $/liter ϫ 3.78
liter/gallon).
Although currency values (and thus conversion fac-
tors) can change rapidly—over the years between 2001
and 2005 the Euro went from being worth only about 75
U.S. cents to more than $1.30—such price differences for
fuel are normal, because fuel in Europe is much more
expensive than in the United States.
Non-standard Units of Conversion
Another often-used, non-standard metric unit is the
hectare for land area. A hectare is 10,000 square meters
and is equivalent to 0.4047 acre.
Other measurements of area include Ares, Dunams,
Perches, Tatami, and Tsubo.
Conversions
130 REAL-LIFE MATH
Conversion of Units of Time,
an Exception to the Rule
The metric unit of time, the second, no longer
depends on the wobbly rotation of Earth (1/86,400th of a
day), because Earth is slowing down; with days keep get-
ting a little longer as time passes. Thus, the second is now
defined in terms of the vibrations of the cesium-133
atom. One second is defined as the amount of time it
takes for a cesium-133 atom to vibrate 9,192,631,770
times. This may sound like a strange definition, but it is a
superbly accurate way of fixing the standard size of the
second, because the vibrations of atoms depend only on
the nature of the atoms themselves, and cesium atoms
will presumably continue to behave exactly like cesium
atoms forever. The exact number of cesium vibrations
was chosen to come out as close as possible to what was
previously the most accurate value of the second.
Minutes are permitted to remain in the metric sys-
tem for convenience or for historical reasons, even
though they do not conform strictly to the rules. The
minute, hour, and day, for example, are so customary that
they are still defined in the metric system as 60 seconds,
60 minutes, and 24 hours—not as multiples of ten.
Where to Learn More
Books
Alder, Ken. The Measure of All Things: The Seven Year Odyssey
and Hidden Error that Transformed the World. New York:
Free Press, 2002.
Hebra, Alexius J. Measure for Measure: The Story of Imperial,
Metric, and Other Units. Baltimore: Johns Hopkins Univer-
sity Press, 2003.
Periodicals
“The International System of Units (SI).” United States Depart-
ment of Commerce, National Institute of Standards and
Technology, Special Publication 330 (1991).
Web sites
Bartlett, David. A Concise Reference Guide to the Metric System.
Ͻ />.htmlϾ (2002).
Key Terms
English system: A collection of measuring units that
has developed haphazardly over many centuries and
is now used almost exclusively in the United States
and for certain specialized types of measurements.
Derived units: Units of measurements that can be
obtained by multiplying or dividing various combina-
tions of the nine basic SI units.
Kelvin: The International System (SI) unit of tempera-
ture. It is the same size as the degree Celsius.
Mass: A measure of the amount of matter in a sample
of any substance. Mass does not depend on the
strength of a planet’s gravitational force, as does
weight.
Matter: Any substance. Matter has mass and occupies
space.
Metric system: A system of measurement developed in
France in the 1790s.
Natural units: Units of measurement that are based on
some obvious natural standard, such as the mass
of an electron.
SI system: An abbreviation for Le Système International
d’Unités, a system of weights and measures adopted
in 1960 by the General Conference on Weights and
Measures.
Temperature: A measure of the average kinetic energy of
all the elementary particles in a sample of matter.
REAL-LIFE MATH 131
Coordinate
Systems
Overview
Coordinate systems are grids used to label unique
points using a set of two or more numbers with respect to
a system of axes. An axis is a one-dimensional figure, such
as a line, with points that correspond to numbers and
form the basis for measuring a space. This allows an exact
position to be identified, and the numbers that are used
to identify the position are called coordinates. One exam-
ple of the use of coordinates is labeling locations on a
map. Street maps of a town, or maps in train and bus sta-
tions allow an overview of areas that may be too difficult
to navigate if all features of the area were to be shown.
Without a coordinate system, these maps would represent
no sense of scale or distance.
The most common use of coordinate systems is in
navigation. This allows people who cannot see each other
to track their positions via the exchange of coordinates.
In a complex transport system, this allows all the compo-
nents to work together by exchanging coordinates that
reference a common coordinate system. An example is an
aviation network, where air traffic control must con-
stantly monitor and communicate the positions of air-
craft with radar and over radio links. Without a
coordinate system, it would be impossible to monitor dis-
tances between aircraft, predict flight times, and commu-
nicate direction or change of direction to aircraft pilots
over the radio.
Fundamental Mathematical Concepts
and Terms
DIMENSIONS OF A COORDINATE
SYSTEM
Coordinate systems preserve information about dis-
tances between locations. This allows a path in space to be
analyzed or areas and volumes to be calculated. For
example, if a position coordinate at one point in time is
known and the speed and direction are constant, it is pos-
sible to calculate what the position coordinate will be at
some future time.
The number of unique axes needed for a coordinate
system to work is equal to the number of unique dimen-
sions of the space, and is written as a set of numbers
(x,y,z). In ordinary day-to-day life, there are three unique
directions, side-to-side, up and down, and backwards and
forwards. It was the German-born American physicist
Albert Einstein (1879–1955) who suggested that there
is a fourth dimension of time. This suggestion led to
Coordinate Systems
132 REAL-LIFE MATH
Einstein’s famous theory of relativity. However, these
effects are normally not visible unless the velocities are
very close to the speed of light or there is a strong gravi-
tational field. Therefore, the dimension of time is not
usually used in geometric coordinate systems.
Sometimes it is sensible to reduce the number of
dimensions used when constructing a coordinate system.
An example is seen on a street map, which only uses two
axes, (x,y). This is because changes in height are not
important, and locations can be fixed in two of the three
dimensions in which humans can move. In this case, a
coordinate system based on a two-dimensional flat sur-
face (a map) is the best system to use.
CHANGING BETWEEN COORDINATE
SYSTEMS
Coordinate systems denote the exact location of
positions in space. If two or more sets of coordinates are
given, it is possible to calculate the distances and direc-
tions between them. To see this, consider two points on a
street map that uses a two-dimensional Cartesian coordi-
nate system. A line can be drawn between the two points
that extend from a reference point, say a building where a
friend is staying, located at (a,b) on the map, to the point
where you are standing (x,y). This line has a length, called
a magnitude, and a direction, which in this case is the
angle made between the line and the x axis. In Cartesian
coordinates, the magnitude is given by Pythagoras’
theorem:
The angle that this line makes with the x axis moving
anticlockwise is given by:
If you were to walk toward your friend along the line,
the magnitude would change, but the angle would not. If
you were to walk in a circle around your friend, the angle
would change, but the magnitude would not.
You may have noticed that the magnitude (radius of
the circle around your friend) and the angle taken
together form a coordinate in the polar coordinate sys-
tem, (radius, angle). These equations are an example of
how it is possible to convert between coordinate systems.
The Cartesian coordinates of your position can be
redefined as a polar coordinates. The reverse is also
possible.
Angle =
tan
–1
y
– b
x
– a
⎛
⎝
⎜
⎞
⎠
⎟
Magnitude = – a)
2
+(
x
– b)
2
(
y
VECTORS
This example also leads to the concept of vectors.
Vectors are used to record quantities that have a magni-
tude and a direction, such as wind speed and direction or
the flow of liquids. Vectors record these quantities in a
manner that simplifies analysis of the data, and vectors
are visually useful as well. For example, consider wind
speed and direction measured at many different coordi-
nates. A map can be made with an arrow at each coordi-
nate, where each arrow has a length and direction
proportional to the measured speed and direction of the
wind at that coordinate. With enough points, it should be
possible just by looking at this map to see patterns these
arrows create and hence, patterns in the wind data.
CHOOSING THE BEST
COORDINATE SYSTEM
Coordinate systems can often be simplified further if
the surface being mapped has some sort of symmetry,
such as the rotational symmetry of a radar beam sweep-
ing out a circular region around a ship. In this case, the
coordinate system with axes that reflect this circular sym-
metry will often be simpler to use. Coordinates can be
converted from one system to another, and this allows
changing to the simplest coordinate system that best suits
each particular situation.
CARTESIAN COORDINATE PLANE
A common use of the Cartesian coordinate system
can be seen on street maps. These will quite often have a
square grid shape over them. Along the sides of the square
grid, numbers or letters run along the horizontal, bottom
edge of the map and the other along the vertical, left hand
side of the map. In this example, assume that both sides
are labeled with numbers. These two sides are called the
axes and for Cartesian coordinate systems, they are always
at 90 degrees to each other.
By reading the values from these two axes, the loca-
tion of any point on the map can be recorded. The values
are taken from the horizontal x axis, and the vertical y
axis. The value of the x axis increases with motion to the
right along the horizontal axis, and the value of the y axis
increases with motion up along the vertical axis.
By selecting a point somewhere on the map, two lines
are drawn from the point that crosses both the x axis and
y axis at 90 degrees. The values along the two axes can then
be read to give coordinates. The exact opposite technique
will define a point on the map from a pair of coordinates.
Two lines drawn at 90 degrees to the x axis and y axis will
locate a point on the map where the two lines cross.
Coordinate Systems
REAL-LIFE MATH
133
The coordinates for a point on the map are often
written as (x,y). The order of expressing the coordinates
is important; if they are mixed up the wrong point will be
defined on the map.
Figure 1 shows an example of a two-dimensional
Cartesian coordinate system. In three dimensions, a Carte-
sian system is defined by three axes that are each at 90-
degree angles to each other. There is some freedom in the
way three axes in space can be represented, and an error
could invalidate the coordinate system. The usual rule to
avoid this is to use the right-handed coordinate system. If
you hold out your right hand and stick your thumb in the
air, this is the direction along the z axis. Next, point your
index finger straight out, so that it is in line with your palm;
this is the direction along the x axis. Finally, point your mid-
dle finger inwards, at 90 degrees to your index finger; this is
the y axis. The fingers now point along the directions of
increasing values of these axes. A point is now located in a
similar way to two-dimensional coordinates. From a set of
coordinates, written as (x,y,z), a point is located where three
planes, drawn at 90-degree angles to these axes, all cross.
POLAR COORDINATES
The polar coordinate system (see Figure 2) is another
type of two-dimensional coordinate system that is based
on rotational symmetry. The reason this system is useful
is that many systems in nature exhibit rotational symme-
try, and when expressed in these coordinates, they will
often be simpler and more enlightening than using two-
dimensional Cartesian coordinates.
The two coordinates used to define a point in this sys-
tem are the radius and the polar angle. To understand this,
imagine standing at the center of a round room that has the
hours of a clock painted around the walls. Elsewhere in the
room is a dot painted on the floor. The distance between
you and the dot is the radius. The angle is a bit more
involved. Standing facing 3 o’clock, the polar angle is given
by the number of degrees you turn your head counter-
clockwise to face the dot. For example, if the dot is at the 12
o’clock mark, it has a polar angle of 90 degrees with respect
to you; if it is at 9 o’clock, it has an angle of 180 degrees; and
if it is at 6 o’clock, it has an angle of 270 degrees. The line at
0 degrees, the 3 o’clock mark, is defined to coincide with the
horizontal, or the x axis in the Cartesian system.
A Brief History of Discovery
and Development
Humans have been mapping their location and trav-
els since the dawn of human history. Examples are seen
throughout history, such as the mapping of land in the
valley of the Nile in ancient Egypt, and recording jour-
neys of global exploration such as those of the Spanish
explorer Christopher Columbus (1451–1506) and others.
Today, the management of the world’s natural and
economic resources requires the availability of accurate
and consistent geographic information. The methods for
storing this data may have changed, with computer-based
storage replacing paper maps, yet the underlying princi-
pals for ensuring compatibility has remained the same.
654320
6
5
4
3
10
9
8
7
2
1
0
1
X axis
Y axis
7 10
(8, 6)
98
Figure 1: Rectangular coordinates.
180°
5040302010
0°
30°
60°
150°
120°
90°
270°
240°
210°
300°
(30, 300)
330°
Figure 2: Polar coordinates.
Coordinate Systems
134 REAL-LIFE MATH
With coordinate systems, locations can be placed on
maps and navigation can be achieved. Such systems allow
a location to be unambiguously identified through a set
of coordinates. In navigation, the usual coordinates in use
are latitude and longitude, first introduced by the ancient
Greek astronomer Hipparchus around 150 B.C.
Like so many mathematical ideas in history, coordi-
nates may have existed in many forms before they were
studied in their own right. French philosopher and math-
ematician René Descartes (1596–1650) introduced the
use of coordinates for describing plane curves in a treatise
published in 1637. Only the positive values of the x and
y coordinates were considered, and the axes were not
drawn. Instead, he was using what is now called the
Cartesian coordinate system, named after him. The polar
coordinate system was introduced later by the English
mathematician and physicist Isaac Newton (1642–1727)
around 1670. Nowadays, the use of coordinate systems is
integral to the development and construction of modern
technology and is the foundation for expressing modern
mathematical ideas about the nature of the universe.
Real-life Applications
COORDINATE SYSTEMS USED
FOR COMPUTER ANIMATION
Films makers and photographers use computers to
manipulate images in a computer. Some common appli-
cations include photo manipulation, where images can be
altered in an artistic manner, video morphing, where a
computers morph an image into another image, and
other special effects. Blue screen imaging is an effect
where an actor acts standing in front of a screen, which is
later replaced with an image. This would allow an actor
dressed as Superman in front of a blue screen to later be
seen flying over a town in the film, for example.
Leaps in computing power and storage have allowed
animators to use computers to design and render breath-
taking artistic works. Rendering is a process used to make
computer animation look more lifelike. Some of these
animations are works in their own right, and others can
be combined with real life film to create lifelike computer
generated effects.
All of these techniques require coordinate systems, as a
computer’s memory can only store an image as a sequence
of numbers. Each set of coordinates will be associated with
the position, velocity, color, texture, and other information
of a particular point in the image. As an example, consider
animating the figure of a dog in a cartoon. If the dog was
featured in many scenes, it would be inefficient to redraw
each movement of the dog. To simplify the animation, each
part of the picture is split up into objects that can be ani-
mated individually. In this case, a coordinate system can be
set up for each moving part of the dog.
For the finished animated picture, all the objects will
be drawn together on some background image all at once,
maybe with some objects rotated, shifted, or enlarged to
refine the final effect. Vectors can be used to make this
process more efficient and flexible. In two-dimensional
animation and computer graphics design, this is often
called vector graphics. In three-dimensional graphics, it is
usually referred to as wire frame modeling.
COORDINATE SYSTEMS USED
IN BOARD GAMES
Some games use boards that are divided up into
squares. An example of this is chess, an ancient and
sophisticated game that is played and studied widely. By
defining a coordinate system on the board, the positions
of the individual pieces can be located. Examples of this
are found in books on the game and even in some news-
papers, where rows of letters and numbers define the
position and movements of the pieces. In this way, many
famous games of chess have been recorded and a student
of the game can replay them to learn tactics and strategies
from masters of the game.
In computer chess simulators, the locations of the
pieces have to be stored as coordinates as numbers in the
computers memory. Once in the computer’s memory,
various algorithms calculate the movements of the pieces,
which are then displayed on the computer screen.
Even without computers, if two chess players are sep-
arated by vast distances, the coordinate system allows the
game to be played by the transmission of the coordinates
of each move. There are many games of chess that have
been played over amateur radio or by mail in this man-
ner. In this case, the players can be separated by many
thousands of miles and still play a game of chess.
PAPER MAPS OF THE WORLD
Assuming that the terrain one wishes to cross is flat,
a coordinate system based on two dimensions and a
Cartesian grid can be used for a paper map. This is suit-
able in shipping for maps of coastlines and maps of areas
up to the size of large islands. However, the world is not
flat, but curved, and for maps with areas larger than about
4 mi
2
(10 km
2
), a Cartesian map of the surface will not be
accurate.
One way to make an accurate map that covers most
of the world on paper is to use a Mercator projection
Coordinate Systems
REAL-LIFE MATH
135
(a two-dimensional map of the Earth’s surface named for
Gerhardus Mercator, the Flemish cartographer who first
created it in 1569). This projection misses the North and
South Poles, as well as the international date line. At the
equator, the map is a good approximation of the Carte-
sian system, but because of Earth’s curved shape, no two
axes can perfectly represent its surface. Toward the poles,
the image of the Earth’s surface becomes more and more
distorted. It is impossible to accurately project a spherical
surface onto a flat sheet, as there is no way to cut the
sphere up so that its sections can be rolled out flat. No
matter what projection is used, flat paper maps of Earth’s
surface will always have some distortion due to the
curved nature of Earth.
COMMERCIAL AVIATION
Coordinate systems allow a location to be transmit-
ted over a radio link if two people have a map with a com-
mon coordinate system. Shipping is one example of this,
but another important commercial use of coordinate sys-
tems is in aviation. In the skies, positions can be commu-
nicated as a series of coordinates verbally or electronically
over radio links that allow many planes to be flown into
or out of airports. In commercial aviation, there will
often be many planes in the sky at one time coming in
from all different directions toward an airport. At busy
airports, sometimes there will not be enough runways to
deal with all the traffic, and airplanes will often be put
into a holding pattern while awaiting clearance to land.
Positions of the aircraft are continually monitored by air
traffic controllers with coordinates given both verbally by
pilots and mechanically by radar.
As air traffic increases each year, it becomes more
critical that coordinates and other information are relayed
quickly and clearly. Air traffic controllers must make sure
that coordinates are correct and understood clearly. Apart
from all of the sophisticated technological safeguards, a
simple misunderstanding of a spoken coordinate could
be enough to cause a disaster. To avoid this, all commer-
cial pilots must communicant in English, and flight ter-
minology is common and standard across countries.
LONGITUDE AND JOHN HARRISON
In navigation, some point of reference is needed
before a coordinate can be found. On a street map, a per-
son could look for a street name or some other landmark
to pinpoint their position. However, on the open seas and
without fixed landmarks, it was not always simple for a
ship to find a point of reference. To fix a position on
Earth’s surface requires two readings, called latitude and
longitude. If the Earth is pictured as a circle, with the
North Pole at the top and the South Pole at the bottom,
and the ship is on the edge of the circle, the latitude is the
angle between the ship, the center of the Earth, and the
equator. Longitude can then be pictured as the circle
when looking down from on top of the Earth, with the
North Pole at the center of the circle. The angle between
the ship and Greenwich, England is the longitude. Find-
ing latitude is quite simple at sea using the angle between
the horizon and the North Star or noon Sun. A device
called a sextant was commonly used for this, but finding
an accurate reading for longitude was more problematic.
Calculating longitude was a great problem in the
naval age of the seventeenth and eighteenth century, and
occupied some of the best scientific minds of the time.
The British announced a prize of £20,000 for anyone who
could solve the problem. It was finally solved by the
invention of a non-pendulum clock that could kept accu-
rate time at sea. It was invented by the visionary English
clock maker John Harrison (1693–1776), who spent a
great part of his life trying to construct a clock that was
thought by many to be impossible with the technology of
the time. It contained several technological developments
that allowed it to work and keep time in the rough condi-
tions at sea. During this time, John Harrison was con-
stantly battling with the Royal Society, England’s
preeminent scientific organization. Ironically, while the
members of the Royal Society were still debating if his
clock really did work, it was already being used at sea for
navigation by the navy. Eventually, after a long battle,
John Harrison received the money and recognition he
deserved. With the invention of this clock, calculating
longitude at sea became simple. The clock is set to a stan-
dard time, taken as the time of Greenwich and called
Greenwich Mean Time (GMT). If a person looks at the
clock at noon, when the sun is directly overhead, and it
reads 2 P.M., then two hours ago it was noon in Green-
wich, as the sun rotates 360 degrees around the Earth
every 24 hours. The equation is:
MODERN NAVIGATION AND GPS
In the twenty-first century, most navigation is based
on the global positioning system (GPS). This is a network
of 24 American satellites that orbit the Earth, allowing a
position coordinate to be read off the screen of a special
radio receiver anywhere on Earth, and is accurate to within
16.4 yd (15 m). Interestingly, this system requires use of a
special coordinate system based on Einstein’s theory of
2 hours
difference
=
30° Longitude
from Greenwich
360°
24 hours