Converging Technologies for Improving Human Performance Episode 1 Part 7 pot
Bạn đang xem bản rút gọn của tài liệu. Xem và tải ngay bản đầy đủ của tài liệu tại đây (302.53 KB, 20 trang )
Converging Technologies for Improving Human Performance (pre-publication on-line version)
107
•!
Understanding the effects of scale
•!
Competently mentally transforming perceptions and representations among different geometric
dimensions (e.g., mentally expanding 1-dimensional traverses or profiles to 2-D or 3-D
configurations similar to that involved in geological mapping, or reducing 3-D or 4-D static or
dynamic observations to 2-D formats for purposes of simplification or generalization (as when
creating graphs, maps, or images)
•!
Comprehending different frames of reference for location, distance estimation, determining
density gradients, calculating direction and orientation, and other referencing purposes (e.g.,
defining coordinates, vectors, rasters, grids, and topologies)
•!
Being capable of distinguishing spatial associations among point, line, area, and surface
distributions or configurations
•!
Exercising the ability to perform spatial classification (e.g., regionalization)
•!
Discerning patterns in processes of change or spread (e.g., recognizing patterns in observations of
the spatial spread of AIDS or city growth over time)
•!
Revealing the presence of spatial and nonspatial hierarchies
Each of the above involves sensing of phenomena and cognitive processing to unpack embedded
detail. It should also be obvious that these perceptual and cognitive processes have their equivalents
in information technology (IT), particularly with respect to creating, managing and analyzing datasets.
While we are creating multiple terabytes of data each day from satellites, from LIght Detection And
Ranging (LIDAR), from cameras, and from visualizations, our technology for dealing with this data
— particularly for dynamic updating and realtime analysis — lags somewhat, even in the most
advanced systems currently invented. Even in the case of the most efficient data collector and
analyzer ever developed, the human mind, there is still a need to simplify, summarize, generalize, and
represent information to make it legible. The activities required to undertake this knowledge
acquisition process are called education, and the knowledge accumulation resulting from this exposure
is called learning. Thus, if NBIC can empower spatial thinking and reasoning, it will promote learning
and knowledge accumulation among individuals and societies, and the results will have impact the
entire spatial domain. (Note, there is a National Research Council committee on spatial thinking
whose report is due at the end of 2002.)
To summarize, spatial thinking is an important part of the process of acquiring knowledge. In
particular, spatial knowledge, defined as the product of spatial thinking and reasoning (i.e., defined as
cognitive processes) can be characterized as follows:
•!
Spatial thinking and reasoning do not require perfect information because of the closure power of
cognitive processes such as imaging, imagining, interpolating, generalizing, perceptual closure,
gestalt integration, and learning
•!
Spatial metaphors are being used — particularly in IT related database development and operation
— but it is uncertain whether they may or may not be in congruence with equivalent cognitive
functioning.
•!
Spatial thinking has become an important component of IT. IT has focused on visualization as a
dominant theme in information representation but has paid less attention to other sensory
modalities for its input and output architectures; more emphasis needs to be given to sound, touch,
B. Expanding Human Cognition and Communication
108
smell, gaze, gesture, emotion, etc. (i.e., changing emphasis from visualizations to
perceptualizations).
New Learning Domains
One specific way that NBIC developments may promote learning is by enhancement of virtual
systems. In geography and other spatial sciences, learning about places other than one‘s immediate
environment is achieved by accessing secondary information, as in books, maps, images, and tables.
In the future, one may conceive of the possibility that all place knowledge could be learned by primary
experience in immersive virtual environments. In fact, within 20 years, much geospatial knowledge
could be taught in immersive virtual environments (VE) labs. This will require
•!
solution of the space sickness or motion sickness problems sometimes associated with immersion
in VE
•!
quick and immediate access to huge volumes of data — as in terabytes of data on a chip — so that
suitably real environments can be created
•!
adoption of the educational practice of “learning by doing“
•!
major new development of hardware and virtual reality language (VRL) software
•!
conviction of teachers that use of VE labs would be a natural consequence of the educational
premise that humans learn to think and reason best in the spatial domain by directly experiencing
environments.
•!
Investigation of which types of learning experiences are best facilitated by use of VE.
Using More Nonvisual Methods
Because of the absence of geography in many school curricula in the United States, many people have
severely restricted access to (and understanding of) representations of the environment (for example,
maps and images) and more abstract concepts (including spatial concepts of hierarchy and association
or adjacency displayed by maps or data represented only in tables and graphs) that are fundamental in
education and daily life. Representations of the geographic world (maps, charts, models, graphs,
images, tables, and pictures) have the potential to provide a rich array of information about the modern
world. Learning from spatialized representations provides insights into layout, association, adjacency,
and other characteristics that are not provided by other learning modes. But, electronic spatial
representations (maps and images) are not accessible to many groups who lack sight, training, or
experience with computerized visualizations, thus contributing to an ever-widening digital divide.
With new technological developments, such as the evolution from textual interfaces to graphically
based Windows environments, and the increasing tendencies for website information to be restricted to
those who can access visualizations and images, many people are being frustrated in their attempts to
access necessary information — even that relevant to daily life, such as weather forecasts.
When viewing representations of the geographic world, such as a map on a computer screen, sight
provides a gestalt-like view of information, allowing the perception of the synoptic whole and almost
simultaneously recognizing and integrating its constituent parts. However, interacting with a natural
environment is in fact a multi-modal experience. Humans engage nearly all of their sensory modalities
when traversing space. Jacobson, Rice, Golledge and Hegarty (2002) summarize recent literature
relating to non-visual interfaces. They suggest that, in order to attend to some of this multisensory
experience and to provide access to information for individuals with restricted senses, several research
threads can be identified for exploring the presentation of information multimodally. For example,
Converging Technologies for Improving Human Performance (pre-publication on-line version)
109
information in science and mathematics (such as formulae, equations, and graphs) has been presented
through auditory display (e.g., hearing a sine wave) and through audio-guided keyboard input
(Gardner et al. 1998; Stevens et al. 1997). Mynatt (1977) has developed a tonal interface that allows
users without vision to access Windows-style graphical user interfaces. Multimodal interfaces are
usually developed for specialist situations where external vision is not necessarily available, such as
for piloting and operating military aircraft (Cohen and Wenzel 1995; Cohen and Oviatt 1995; Rhyne
and Wolf 1993).
Jacobson et al. also point out that abstract sound variables have been used successfully for the
presentation of complex multivariate data. Parkes and Dear (1990) incorporated “sound painting“ into
their tactual-auditory information system (NOMAD) to identify gradients in slope, temperature, and
rainfall. Yeung (1980) showed that seven chemistry variables could be presented through abstract
sound, and reported a 90% correct classification rate prior to training and a 98% correct response rate
after training. Lunney and Morrison (1981) have shown that sound graphs can convey scientific data
to visually impaired students. Sound graphs have also been compared to equivalent tactual graphs; for
example, Mansur et al. (1985) found comparable information communication capabilities between the
two media, with the auditory displays having the added benefit of being easier to create and quicker to
read. Recent research has represented graphs by combining sound and brailled images with the
mathematical formula for each graph being verbally presented while a user reads the brailled shape.
Researchers have investigated navigating the Internet World Wide Web through audio (Albers 1996;
Metois and Back 1996) and as a tool to access the structure of a document (Portigal and Carey 1994).
Data sonification has been used to investigate the structure of multivariate and geometric data (Axen
and Choi 1994; Axen and Choi 1996; Flowers et al. 1996), and auditory interfaces have been used in
aircraft cockpits and to aid satellite ground control stations (Albers 1994; Ballas and Kieras 1996;
Begault and Wenzel 1996). But while hardware and software developments have shown “proof of
concept,” there appear to be few successful implementations of the results for general use (except for
some gaming contexts) and no conclusive behavioral experiments to evaluate the ability of the general
public or specialty groups (e.g., the vision-impaired) to use these innovations to interpret on screen
maps, graphics, and images.
Thus, while Jacobson et al. (2002) have illustrated that multimodal interfaces have been explored
within computer science and related disciplines (e.g., Delclos and Hartman 1993; Haga and Nishino
1995; Ladewski 1996; Mayer and Anderson 1992; Merlet, Nadalin, Soutou, Lapujade, and Ravat
1993; Morozov 1996; Phillips 1994; Stemler 1997; Hui et al. 1995; and others), and a number of
researchers have looked at innovative interface mediums such as gesture, speech, sketching, and eye
tracking (e.g., Ballas and Kieras 1996; Briffault and Denis 1996; Dufresne et al. 1995; Schomaker et
al. 1995; Taylor et al. 1991), they also claim that only recently are such findings beginning to have an
impact upon technology for general education, a view shared by Hardwick et al. (1996; 1997).
In summary, extrapolating from this example, one can assume that developments in NBIC will impact
the learning activities of many disciplines by providing new environments for experience, by
providing dynamic realtime data to explore with innovative teaching methods, and (if biotechnology
continues to unpack the secrets of the brain and how it stores information as in place cell theory), the
possibility of direct human-computer interaction for learning purposes may all be possible. Such
developments could
•!
enhance the process of spatial learning by earlier development of the ability to reason abstractly or
to more readily comprehend metric and nonmetric relations in simple and complex environments
•!
assist learning by discovering the biotechnological signatures of phenomena and discovering the
place cells where different kinds of information are stored, and in this way enhance the encoding
and storage of sensed information
B. Expanding Human Cognition and Communication
110
•!
where functional loss in the brain occurs (e.g., if loss of sight leaves parts of the brain relatively
inactive), to find ways to use the cells allocated to sight to be reallocated to other sensory organs,
thus improving their functioning capabilities.
•!
Representations of the geographic world (maps, charts, models, graphs, images, tables, and
pictures) have the potential to provide a rich array of information about the modern world.
•!
Learning from spatialized representations provides insights into layout, association, adjacency,
and other spatial characteristics that are not provided by other learning modes.
•!
However, interacting with a natural environment is in fact a multimodal experience. Humans
engage nearly all of their sensory modalities when traversing or experiencing space.
Given the dominance of computer platforms for representing information and the overwhelming use of
flat screens to display such information, there is reason to believe that multimodal representations may
not be possible until alternatives to 2-D screen surfaces have been developed for everyday use. The
reasons for moving beyond visualization on flat screens are compelling and are elaborated on later in
this chapter.
Enhancing Sensory and Cognitive Capabilities in the Spatial Domain
How can we exploit developments in NBIC to enhance perceptual and cognitive capabilities across the
life span, and what will be the types of developments needed to achieve this goal?
To enhance sensory and cognitive capabilities, a functional change in the way we encode information,
store it, decode it, represent it, and use it may be needed. Much of the effort in Information
Technology has been directed towards developing bigger and bigger databases that can be used on
smaller and smaller computers. From satellites above we get terabytes of data (digitized records of the
occurrence of phenomena), and we have perhaps outgrown our ability to examine this data. As
nanotechnology and IT come into congruence, the terabytes of data being stored in boxes will be
stored on chips and made accessible in real time via wearable and mobile computers, and even may be
fed into smart fabrics woven into the clothes we wear. But just how well can we absorb, access, or use
this data? How much do we need to access? And how best can we access it and use it? The question
arises as to how we can exploit human perception and cognition to best help in this process, and the
answer is to find out more about these processes so that they can be enhanced. Examples of questions
to be pursued include the following:
•!
How can we enhance the sensory and cognitive aspects of human wayfinding for use in navigating
in cyberspace?
•!
What particular sensory and cognitive capabilities are used in the field, and how do we enhance
them for more effective fieldwork with wearable and mobile computers (e.g., for disaster
responses)?
•!
How do we solve problems of filtering information for purposes of representation and analysis
(e.g., enhance visualizations)?
•!
How do we solve the problem of resolution, particularly on the tiny screens typical of wearable
and field computers?
•!
What alternatives to visualization may be needed to promote ease of access, representation, and
use of information?
Converging Technologies for Improving Human Performance (pre-publication on-line version)
111
•!
What is the best mode for data retrieval in field settings (e.g., how do we get the information we
need now)?
•!
How can we build technology to handle realtime dynamic input from several sources, as is done
by human sensory organs and the human brain?
•!
Will we need a totally new approach to computer design and interface architecture (e.g., abandon
keyboards and mice) that will allow use of the full range of sensory and cognitive capabilities,
such as audition, touch, gaze, and gesture (e.g., the use of Talking Signs® and Internet
connections to access websites tied to specific locations)?
Visualization is the dominant form of human-IT interaction. This is partly because the visual sense is
so dominant, particularly in the spatial domain. It is also the dominant mode for representation of
analyzed data (on-screen). But visualization is but a subset of spatialization, which goes beyond the
visual domain by using everyday multimodal situations (from desktops and file cabinets to overlay and
digital worlds) to organize and facilitate access to stored information. These establish a linking by
analogy and metaphor between an information domain and familiar elements of everyday experience.
Spatial (and specifically geographic) metaphors have been used as database organizing systems. But
even everyday geospatial experiences are biased, and to enhance our sensory and cognitive abilities
we need to recognize those biases and mediate them if successful initiation of everyday knowledge
and experience (including natural languages) are to be used to increase human-IT interactions.
The main problem arising from these usages is simply that an assumption of general geospatial
awareness is false. Basic geographic knowledge (at least in the United States) is minimal, and
knowledge of even rudimentary spatial concepts like distance, orientation, adjacency, and hierarchy is
flawed. Recent research in spatial cognition has revealed a series of biases that permeate naïve spatial
thinking. Partly because of a result of cognitive filtering of sensed information and partly because of
inevitable technical errors in data capture and representation, biases occur. Golledge (2002) has
suggested that these include the following:
•!
conceptual bias due to improper thinking and reasoning (e.g., applying metric principles to
nonmetric situations)
•!
perceptual biases, including misunderstandings and misconceptions of notions of symmetry,
alignment, clustering, classification, closure, and so on (e.g., assuming Miami, Florida, MUST be
east of Santiago, Chile, because Miami is on the east cost of North America and Santiago is on the
west coast of South America) (Fig. B.1)
•!
violating topological features of inclusion and exclusion when grouping (spatial) data
•!
assuming distance asymmetry when distance symmetry actually exists, and vice versa (e.g.,
different perceptions of trips to and from work)
•!
inappropriate use of cognitive concepts of rotation and alignment (e.g., misreading map
orientation)
•!
cognitively overestimating shorter distances and underestimating longer distances (Stevens’ Law
or regression towards the mean)
•!
distortions in externalized spatial products (e.g., distorted cognitive maps) (Liben 1982; Fig. B.2)
•!
bias that results from using imprecise natural language (e.g., fuzzy spatial prepositions like “near”
and “behind” that are perspective dependent). (Landau and Jackendoff 1993)
B. Expanding Human Cognition and Communication
112
Figure!B.1.! Cognitive East/West alignment effects.
Golledge has argued that these (and other storage, processing, and externalizing biases) result in
perceptual and cognitive errors in encoding, internally manipulating, decoding and using stored
information. The following are examples of the accommodations humans make to deal with these
biases (incidentally developing new ones):
•!
making naturally occurring irregular shapes and areas regular for purposes of simplification,
representation, and generalization
•!
mentally rotating features or distributions to fit preconceptions (e.g., vertically aligning North and
South America, as shown in Figure B.1)
•!
imposing hierarchical orderings to clarify distributions (e.g., systems of landmarks)
•!
making effective rational decisions without perfect information
•!
cognitively generalizing from one scale to another without appropriate empirical evidence (e.g.,
from laboratory to real world scales)
•!
realizing that data collected for machine use has to be more perfect than data collected for human
use.
Converging Technologies for Improving Human Performance (pre-publication on-line version)
113
D EV ELOP MEN T!OF!EN VIRON MENT AL!LEA RNING
D EVE LOP MEN T!OF! ENVIRONMENTAL! FOR GE TTING
Figure!B.2.! Three examples of cognitive maps, of long-term residents (top), mid-term residents, (middle),
and newcomers (bottom), recovered using non-metric multidimensional scaling of cognitive interpoint
distances. (The exact parallel reversals for memory loss is speculative.)
NBIC and Improving Human-Computer Interfaces and Interactions
A key question is why won‘t existing interface architecture be appropriate for human-computer
interaction in the future?
Existing interface architecture is still being modeled on dated technology — the typewriter keyboard
and the cursor driven mouse — and not for ease of human-computer interaction. The interface
concern is the most pressing problem of HCI and is its most critical part. It is the medium through
which information is accessed, questions are posed, and solution paths are laid out and monitored. It
is the tool with which the user manipulates and interacts with data. Interface architectures like the
desktop, filing cabinet, and digital world are implemented (still) via keyboards and mice. Today‘s
interfaces are cursor dependent and contribute significantly to creating a digital divide that impedes
8 million sight-impaired and 82 million low-vision (potential) users from freely interacting with the
dominant IT of this age.
Communicating involves transferring information; to do so requires compatibility between sender and
receiver. The interface architecture that controls human-computer information exchange, according to
Norman (1988), must
B. Expanding Human Cognition and Communication
114
•!
facilitate the exchange of knowledge in the environment and knowledge in the head
•!
keep the interaction task simple
•!
ensure that operations are easy to do
•!
ensure correct transfer among information domains
•!
understand real and artificial restraints on interaction
•!
acknowledge existence of error and bias due to modal difficulties
•!
eventually standardize procedures
Thus, the interface must maximize the needs of both human user and computer.
These needs raise the question of what cutting edge hardware (e.g., rendering engines, motion tracking
by head mounted display units, gaze tracking, holographic images, avatars complete with gestures, and
auditory, tactual, and kinesthetic interface devices), adds to information processing? Besides the
emphasis on historic input devices (keyboard and mouse), there is a similar emphasis on a dated
output device, the limited domain of the flat computer screen (inherited from the TV screen of the
1930s), which is suited primarily for visualization procedures for output representation. While there is
little doubt that the visual senses are the most versatile mode for the display of geospatial data and data
analysis (e.g., in graph, table, map, and image mode), it is also argued that multiple modality
interfaces could enrich the type, scale, and immediacy of displayed information. One of the most
critical interface problem relates to the size and resolution of data displays. This will be of increasing
importance as micro-scale mobile and wearable computers have to find alternatives to 2-inch square
LED displays for output presentation. The reasons for moving beyond visualization on flat screens are
compelling. Examples include
•!
multimodal access to data and representations provide a cognitively and perceptually rich form of
interaction
•!
multimodal input and output interfaces allow HC interaction when sight is not available (e.g., for
blind or sight-impaired users) or when sight is an inappropriate medium (e.g., accessing onscreen
computer information when driving a vehicle at high speeds)
•!
when absence of light or low precludes the use of sight
•!
when visual information needs to be augmented
•!
when a sense other than vision may be necessary (e.g., for recording and identifying bird calls in
the field)
Nonvisual technology allows people with little or no sight to interact (e.g., using sound, touch, and
force-feedback) with computers. Not only is there a need for text to speech conversion, but there is
also a need to investigate the potential use of nonvisual modalities for accessing cursor-driven
information displays, icons, graphs, tables, maps, images, photos, windows, menus, or other common
data representations. Without such access, sight-disabled and low-sight populations are at an immense
disadvantage, particularly when trying to access spatial data. This need is paramount today as home
pages on the World Wide Web encapsulate so much important information in graphic format, and as
digital libraries (including the Alexandria Digital Map and Image Library at the University of
California, Santa Barbara) become the major storage places for multidimensional representations of
spatial information.
Converging Technologies for Improving Human Performance (pre-publication on-line version)
115
In the near future, one can imagine a variety of new interfaces, some of which exist in part now but
which need significant experimentation to evaluate human usability in different circumstances before
being widely adopted. Examples of underutilized and underinvestigated technologies include the
following:
•!
a force-feedback mouse that requires building virtual walls around on-screen features, including
windows, icons, objects, maps, diagrams, charts, and graphs. The pressure-sensitive mouse allows
users to trace the shape of objects or features and uses the concept of a gravity well to slip inside a
virtual wall (e.g., a building entrance) to explore the information contained therein (Jacobson et al.
2002).
•!
vibrotactile devices (mice) that allow sensing of different surfaces (dots, lines, grates, and
hachures) to explore flat, on-screen features (e.g., density shading maps and meteorological or
isoline temperature maps) ( O‘Modhrain and Gillespie 1995; Jacobson, et al. 2002)
•!
use of real, digitized, or virtual sounds including speech to identify on-screen phenomena (e.g.,
Loomis, Golledge, and Klatzky 2001)
•!
avatars to express emotions or give directions by gesturing or gazing
•!
smart clothing that can process nearby spatial information and provide information on nearby
objects or give details of ambient temperature, humidity, pollution levels, UV levels, etc.
Currently, the use of abstract sound appears to have significant potential, although problems of spatial
localization of sound appear to offer a significant barrier to further immediate use. Some uses (e.g.,
combinations of sound and touch — NOMAD — and sound and Braille lettering — GPS Talk — are
examples of useful multimodal interfaces (e.g., Parkes and Dear 1990; Brabyn and Brabyn 1983;
Sendero Group 2002). Some maps (e.g., isotherms/density shading) have proven amenable to sound
painting, and researchers in several countries have been trying to equate sound and color. At present,
much of the experimentation with multimodal interfaces is concentrated in the areas of video games
and cartoon-like movies. Researchers such as Krygier (1994) and Golledge, Loomis, and Klatzky
(1994) have argued that auditory maps may be more useful than tactual maps and may, in
circumstances such as navigating in vision-obstructed environments, even prove more useful than
visual maps because they don‘t require map-reading ability but rely on normal sensory experiences to
indicate spatial information such as direction.
What Needs to be Done to Help NBIC Make Contributions in the Spatial Domain?
•!
If space is to be used as a metaphor for database construction and management, and if human
wayfinding/navigation practices are to be used as models for Internet search engines, there are a
host of spatial cognition research activities that need to be pursued. First there is a need for a
concept-based common vocabulary. There must be a sound ontology, an understanding of spatial
primitives and their derivatives, and a meaningful way to communicate with a computer using
natural language and its fuzzy spatial prepositions (i.e., a common base of spatial linguistics,
including a grammar).
•!
We need to find matches between information types and the best sensory modalities for
representing and using each type of information.
•!
We need an educated and IT-enlightened science and engineering community that understands
spatial thinking and reasoning processes.
B. Expanding Human Cognition and Communication
116
•!
We need to change educational and learning practices to produce an NBIC-enlightened public and
an IT-enlightened set of decision makers. Part of this need can be achieved by producing spatially
aware professionals who understand and use actual or enhanced sensory and cognitive capabilities
to understand and react to different situations and settings.
•!
We need to explore the cognitive processes used in risky decision making and use innovative IT
practices to develop databases, management systems, and analytical techniques that are
cognitively compatible with these processes (Montello 2001).
•!
We need to develop new realtime dynamic human-computer interfaces (both input and output) that
facilitate collaborative decision making. This may involve building virtual environments suited
for real-time collaborative image exchange and simultaneous use, analysis, modification, and
representation of data, even when researchers are continents apart.
•!
We need to determine what dimensions of cyberspace are compatible with perceptualization and
visualization, particularly in the spatial domain.
•!
We need to define the impacts of selecting specific scales and levels of resolution for visual or
perceptual representation of information.
•!
We need to explore the value of changing network representations and displays of information in
cyberspace to grid layout or configurational displays — the expansion from 1- to 2- or
3-dimensional information representations would facilitate a higher level of abstract thinking and
reasoning to be implemented in analyzing configurational displays.
•!
The explosion of interfaces built upon visualization has produced too many graphic interfaces that
do not maximize cognitive capabilities of users, and have further disadvantaged disabled groups
such as the blind or sight-impaired. This latter fact is continuing the computer alienation of aged
populations, where over 70% have low vision or other sight problems. There are, according to
census estimates, over 52 million disabled people in the United States. Approximately 3-4 million
of these are blind, legally blind, or severely vision-impaired. A further 80+ million people have
low vision. We cannot ignore these groups or exclude them from use of future technology.
•!
We need to determine optimal output interfaces for wearable computers that do not limit the user
to visually reading complex displays (e.g., maps) on tiny screens. This carries with it the various
cartographic representation problems of choosing scale, resolution, degree of simplification,
generalization, and accuracy. This is not just a computer graphics problem, but a problem for
cartographic theorists, empirical researchers, and researchers in spatial perception and spatial
cognition, and it may involve innovative nanotechnology to build “fold-out“ or “expandable“
screens.
•!
There is a need to explore interfaces that can meaningfully display dynamic data at various scales
and degrees of resolution.
•!
There is a need to examine whether nano- or biotechnology can alter the senses and cognitive
capabilities of humans to enhance HCI. In particular, can nano-biotechnology enhance our tactual
and auditory capabilities (e.g., sensing gloves and ear implants) to ensure that information
processing becomes perceptually and cognitively less biased and error ridden?
•!
There is a need for distributed national learning and research networks to be developed to
encourage timely transfer of information from the research to the educational domains; otherwise,
the current 3-5 year lags needed for much of this transfer to take place will continue.
Converging Technologies for Improving Human Performance (pre-publication on-line version)
117
•!
As we learn more about how the mind stores data, there is a need to examine if we can use the
mind as a model to enhance efforts to build a national network of digital libraries.
•!
There is a need for solving problems associated with using immersive virtual environments (e.g.,
motion sickness) so that their real potential in research and decision making can be exploited and
evaluated.
•!
There is a need to explore ways to increase the effectiveness of human-environment relations.
This may involve
−! developing personal guidance and spatial information systems that allow people to carry with
them in a wearable computer all the local environmental information that they need to
undertake daily activities (Fig. B.3)
−! developing smart environments that allow people to access wireless information (e.g.,
infrared-based auditory signage or locally distributed servers that allow immediate access to
the Internet and webpages) (Fig. B.4).
Figure!B.3.! Personal guidance system.
•!
Since environmental information is filtered through our senses and consequently is biased,
individually selective, and related to stage of cognitive development, we need to know to what
extent human sensing is dependent on perspective or point of view for encoding spatial relations.
Attention must be paid to the roles of alignment, frames of reference, and scale or resolution (e.g.,
asymmetries of distance, orientation error, or locational inaccuracy), which produce information
not always consistent with metric geometries and logically based algebras used to unpack
information from data about the real world. Perhaps a new subjective mathematics is needed to
interpret our cognitive maps.
•!
We need to determine if knowledge of wayfinding in the real world can help us find our way in
cyberspace. Spatial knowledge in humans develops from landmark ! route ! configurational
understanding. Much high-order spatial knowledge in humans concerns understanding spatial
relations embedded in configurational or layout knowledge, whereas much of the knowledge in IT
is link- and network-based, potentially reducing its information potential by requiring human
ability to integrate information obtained from specific routes in cyberspace.
B. Expanding Human Cognition and Communication
118
Figure!B.4.! “Smart environments.”
There are two dominant ways for NBIC to impact the 52+ million disabled people in the United States:
1.! free them from the tyranny of print and other “inaccessible” visual representations
2.! help them obtain independence of travel
Enacting measures like the following will increase mobility, employability, and quality of life:
•!
changing computer interface architecture so that disabled groups (e.g., blind, sight impaired,
dyslexic, arthritic, immobile) can access the Internet and its webpages as transparently and quickly
as able-bodied people
•!
enabling wearable computers for use in everyday living (e.g., finding when the next bus is due or
where it is now) (Fig. B.4)
•!
developing voice-activated personal guidance systems using GPS, GIS, and multimodal interfaces
that will enable people to travel in unfamiliar environments (Fig. B.4)
•!
improve speech recognition for input to computers
•!
use infrared-based remote auditory signage systems (RASS) (e.g., talking sign technology) to
facilitate wayfinding, business or object location identification, recognition of mass transit
services and promotion of intermodal transfer, and for defining other location-based services and
information systems
Converging Technologies for Improving Human Performance (pre-publication on-line version)
119
Outcomes
Following are some outcomes of the integration of spatial cognition and converging NBI technologies:
•!
Expanding sensory and cognitive capabilities should improve learning and result in a more NBIC-
enlightened public, scientists, engineers, and public policymakers.
•!
Developing multimodal input and output interfaces will enrich human ability to process and
analyze information, covering all types of spatial information required for microscopic, global, or
extraterrestrial research. It will also help to remove the rapidly growing effects of the digital
divide by allowing more disabled (or otherwise disadvantaged) people to join the computer-
literate population, thus improving employment possibilities and improving quality of life.
Converging NBIC technology will broaden our abilities to think “outside the box” in a variety of
sensory domains, such as the following examples of convergence of NBI and spatial cognition methods:
•!
Natural language-driven mobile and wearable computers
•!
Internet search engines based on human wayfinding practices
•!
Smart fabrics that sense the environment and warn us of pollution levels, etc.
•!
Smart environments (e.g., remote auditory signage systems) that talk to us as we travel through
them
•!
GPS-based personal guidance systems that facilitate travel (e.g., tourism) in unfamiliar places
•!
Smart maps that explain themselves at the touch of a stylus or as a result of gaze or gesture (e.g.,
“You are here” maps or on-screen computer representations of data) (Fig. B.5)
•!
Robotic guide dogs that carry large environmental databases and can develop routes to unfamiliar
places
•!
Smart buildings that inform about their contents and inhabitants, e.g., transit terminals (Fig. B.6).
Of particular interest are NBIC-based knowledge and devices that enhance spatial cognition used in
wayfinding performance:
•!
Remote auditory signage (Talking Signs/Remote Infrared Auditory Signage) (at places or on
vehicles, including mass transit)
•!
Talking fluorescent lights inside buildings such as shopping centers and transit terminals (Fig. B.7)
GPS-based guidance systems with Pointlink capabilities to locations and websites for place-based
information.
B. Expanding Human Cognition and Communication
120
Figure!B.5.! Talking maps.
Figure!B.6.! Transit terminal with remote auditory signage.
Converging Technologies for Improving Human Performance (pre-publication on-line version)
121
Figure!B.7.! Talking neon lights in airport terminal.
Conclusion
The convergence of nano-, bio-, info- technology and spatial cognition research will
•!
broaden our ability to think outside the box
•!
ensure that NBI technologies are compatible with ways that humans think and reason
•!
facilitate new product development
•!
help remove barriers to the natural integration of disabled and disadvantaged groups into the
community, thus improving their quality of life
•!
provide new environments for learning
•!
enhance cognitive functioning by improving perceptual and cognitive capabilities
•!
help create less abstract and more “naturally human“ computer interface architecture
•!
once we have learned how and where spatial information is stored in the brain (place cell
analysis), this may prompt new ideas about how we think and reason
For example, eventually, the most powerful computer interface will rely on an architecture that
combines geospatial metaphors with spatialization principles and multimodal input and output devices
that provide access to text, maps, images, tables, and gestures.
But there is the inevitable downside, such as the thorny ethical and legal issues of defining and
maintaining appropriate levels of individual privacy and security of public or business information.
But developments in NBIC are the future of humankind, and these and other unrealized problems,
must — in the way of humankind — be faced and solved.
B. Expanding Human Cognition and Communication
122
Finally, if VE can be developed in an effective way, humans will have many of the capabilities of the
Star Trek holodeck. They will stroll through the Amazon jungles, trek to the North or South Pole,
explore an active volcano, avalanche, or hurricane, redesign cities or parts of them, change transport
systems to maximize the benefits of intelligent highways, visit drought areas, explore areas of poverty
or crime, all within the safety of VE. The contribution of such systems to education, research, and
decision making in the policy arena could be immense. As long as we can solve the cognition and
technical problems of building and using VE, these goals may be achievable.
References
Albers, M.C. 1994. The Varese System, hybrid auditory interfaces and satellite-ground control: Using auditory
icons and sonification in a complex, supervisory control system. In G. Kramer and S. Smith (Eds.),
Proceedings of the Second International Conference on Auditory Display (pp. 3-13). Sante Fe, NM.
Albers, M.C. 1996. Auditory cues for browsing, surfing, and navigating the WWW: The audible web. In S.P.
Frysinger and G. Kramer (Eds.), Proceedings of the Third International Conference on Auditory Display
(pp. 85-90). Palo Alto, Ca.
Axen, U., and I. Choi. 1994. Using additive sound synthesis to analyze simple complexes. In G. Kramer and S.
Smith (Eds.), Proceedings of the Second International Conference on Auditory Display (pp. 31-44). Sante
Fe, NM.
Axen, U., and I. Choi. 1996. Investigating geometric data with sound. In S. P. Frysinger and G. Kramer (Eds.),
Proceedings of the Third International Conference on Auditory Display (pp. 25-28). Palo Alto, Ca.
Ballas, J., and D.E. Kieras. 1996. Computational modeling of multimodal I/O in simulated cockpits. In S. P.
Frysinger and G. Kramer (Eds.), Proceedings of the Third International Conference on Auditory Display
(pp. 135-136). Palo Alto, Ca.
Begault, D.R., and E.M. Wenzel. 1996. A virtual audio guidance and alert system for commercial aircraft
operations. In S. P. Frysinger and G. Kramer (Eds.), Proceedings of the Third International Conference on
Auditory Display (pp. 117-122). Palo Alto, Ca.
Brabyn, L.A., and J.A. Brabyn. 1983. An evaluation of “Talking Signs“ for the blind. Human Factors, 25(1), 49-53.
Briffault, X., and M. Denis. 1996 (August). Multimodal interactions between drivers and co-drivers: An analysis
of on-board navigational dialogues. Paper presented at the Proceedings of the Twelfth European Conference
on Artificial Intelligence, Budapest.
Cohen, M., and E.M. Wenzel. 1995. The design of multidimensional sound interfaces. In T. A. F. I. I. I. E.
Woodrow Barfield (Ed.), Virtual environments and advanced interface design. (pp. 291-346): Oxford
University Press, New York, NY, US.
Cohen, P.R., and S.L. Oviatt. 1995. The role of voice input for human-machine communication. Proceedings of
the National Academy of Sciences, 92(22), 9921-9927.
Delclos, V.R., and A. Hartman. 1993. The impact of an interactive multimedia system on the quality of learning
in educational psychology: an exploratory study. Journal of Research on Technology in Education, 26(1),
83-93.
Dufresne, A., O. Martial, C. and Ramstein. 1995. Multimodal user interface system for blind and “visually
occupied“ users: Ergonomic evaluation of the haptic and auditive dimensions.
Flowers, J.H., D.C. Buhman, and K.D. Turnage. 1996. Data sonification from the desktop: Should sound be a
part of standard data analysis software. In S. P. Frysinger and G. Kramer (Eds.), Proceedings of the Third
International Conference on Auditory Display (pp. 1-8). Palo Alto, Ca.
Gardner, J.A., R. Lundquist, and S. Sahyun. 1998 (March). TRIANGLE: A Tri-Modal Access Program for
Reading, Writing and Doing Math. Paper presented at the Proceedings of the CSUN International
Conference on Technology and Persons with Disabilities, Los Angles.
Converging Technologies for Improving Human Performance (pre-publication on-line version)
123
Golledge, R.G. 2002. The nature of geographic knowledge. Annals of the Association of American Geographers,
92(1), In Press.
Golledge, R.G., J.M. Loomis, and R.L. Klatzky. 1994 (February 20-26). Auditory maps as alternatives to tactual
maps. Paper presented at the 4th International Symposium on Maps and Graphics for the Visually Impaired,
Sao Paulo, Brazil.
Haga, H., and M. Nishino. 1995 (17-21 June). Guidelines for designing hypermedia teaching materials. Paper
presented at the Educational Multimedia and Hypermedia 1995. Proceedings of ED-MEDIA 95 - World
Conference on Educational Multimedia and Hypermedia, Graz, Austria.
Hardwick, A., S. Furner, and J. Rush. 1996 (21 Jan). Tactile access for blind people to virtual reality on the
World Wide Web. Paper presented at the IEE Colloquium on Developments in Tactile Displays (Digest
No.1997/012) IEE Colloquium on Developments in Tactile Displays, London, UK.
Hardwick, A., J. Rush, S. Furner, and J. Seton. 1997. Feeling it as well as seeing it-haptic display within gestural
HCI for multimedia telematics services. In P. A. Harling and A. D. N. Edwards (Eds.), Progress in Gestural
Interaction. Proceedings of Gesture Workshop ‘96, York, UK (pp. 105-16). Berlin, Germany: Springer-
Verlag.
Hui, R., A. Ouellet, A. Wang, P. Kry, S. Williams, G. Vukovich, and W. Perussini. 1995. Mechanisms for haptic
feedback, IEEE International Conference on Robotics and Automation (pp. 2138-2143).
Jacobson, R.D., M. Rice, R.G. Golledge, and M. Hegarty. 2002. Force feedback and auditory interfaces for
interpreting on-screen graphics and maps by blind users (Technical Paper funded by the UCSB Research
Across the Disciplines (RAD) Program ): Geography Departments of Florida State University and
University of California Santa Barbara.
Krygier, J.B. 1994. Sound and Geographic Visualisation. In A.M. MacEachren and D.R. Fraser-Taylor (Eds.),
Visualisation in Modern Cartography (pp. 149-166): Pergamon.
Ladewski, B.G. 1996. Interactive multimedia learning environments for teacher education: comparing and
contrasting four systems. Journal of Computers in Mathematics and Science Teaching 15(1-2) 173-97.
Landau, B., and R. Jackendoff. 1993. “What“ and “where“ in spatial language and spatial cognition. Behavioral
and Brain Sciences 16, 217-238.
Loomis, J.M., R.G. Golledge, and R.L. Klatzky. 2001. GPS-based navigation systems for the visually impaired.
In W. Barfield and T. Caudell (Eds.), Fundamentals of Wearable Computers and Augmented Reality (pp.
429-446). Mahway, NJ: Erlbaum.
Lunney, D., and R, Morrison. 1981. High Technology Laboratory Aids for Visually Handicapped Chemistry
Students. Journal of Chemical Education, 8(3), 228-231.
Mansur, D., M. Blattner, and K. Joy. 1985. Sound graphs: A numerical data analysis for the blind. Journal of
Medical Systems, 9(3) 163-174.
Marston, J. 2002. Towards an Accessible City: Empirical Measurement and Modeling of Access to Urban
Opportunities for those with Vision Impairments Using Remote Infrared Audible Signage. , UCSB, Santa
Barbara. Unpublished Ph.D. Dissertation.
Mayer, R.E., and R.B. Anderson. 1992. The instructive animation: Helping students build connections between
words and pictures in multimedia learning. Journal of Educational Psychology, 84, 444-452.
Merlet, J.F., C, Nadalin, C. Soutou, A. Lapujade, and F. Ravat. 1993 (17-20 Oct.). Toward a design method of a
multimedia information system. Paper presented at the 1993 International Conference on Systems, Man and
Cybernetics. Systems Engineering in the Service of Humans (Cat. No.93CH3242-5) Proceedings of IEEE
Systems Man and Cybernetics Conference - SMC, Le Touquet, France.
Metois, E., and M. Back. 1996. BROWeb: An interactive collaborative auditory environment on the world wide
web. In S. P. Frysinger and G. Kramer (Eds.), Proceedings of the Third International Conference on
Auditory Display (pp. 105-110). Palo Alto, Ca.
B. Expanding Human Cognition and Communication
124
Montello, D.R., ed. 2001. Spatial Information Theory: Foundations of Geographic Information Science.
Proceedings, International Conference, COSIT 2001, Morro Bay, CA, September. New York: Springer.
Morozov, M. 1996 (14-16 Sept.). Multimedia lecture room: a new tool for education. Paper presented at the
Multimedia, Hypermedia, and Virtual Reality. Models, Systems, and Applications. First International
Conference, Moscow, Russia.
Mynatt, E.D. 1997. Transforming graphical interfaces into auditory interfaces for blind users. Human-Computer
Interaction 12(1-2), 7-45.
Norman, D.A. (1988). The Psychology of Everyday Things. New York: Basic Books.
O‘Keefe, J., and L. Nadel. 1978. The Hippocampus as a Cognitive Map. Oxford: Clarendon Press.
O‘Modharain, M., and B. Gillespie. 1995. The Moose: A Haptic User Interface for Blind Persons (Stan-M95;
CCRMA). Stanford, CA: Stanford.
Parkes, D., and R. Dear. 1990. NOMAD: AN interacting audio-tactile graphics interpreter. Paper presented at
the Reference Manual, Version 2.0, NSW Australia: Institute of Behavior Science, University of Newcastle.
Phillips, R. 1994. Producing interactive multimedia computer-based learning projects. Computer Graphics,
28(1), 20-4.
Portigal, S., and T. Carey. 1994. Auralization of document structure. In G. Kramer and S. Smith (Eds.),
Proceedings of the Second International Conference on Auditory Display (pp. 45-54). Sante Fe, NM.
Rhyne, J. A., and C. Wolf. 1993. Recognition based user interfaces. In H. R. Harston and D. Hix (Eds.),
Advances in Human-Computer Interaction: Vol. 4 (pp. 191-250). Norwood, NJ: Ablex.
Schomaker, L., J. Nijtmans, A. Camurri, F. Lavagetto, P. Morasso, C. Benoit, T. Guiard-Marginy, B. Le Goff,
J. Robert-Ribes, A. Adjoudani, I. Defee, S. Munch, K. Hartnung, and J. Blauert. 1995. A taxonomy of
mulitmodal interaction in the human information processing system : Esprit Project 8579.
Sendero Group. 2002 Available: www.senderogroup.com.
Stemler, L.K. 1997. Educational characteristics of multimedia: a literature review. Journal of Educational
Multimedia and Hypermedia, 6(3-4), 339-59.
Stevens, R. D., A.D.N. Edwards, and P.A. Harling. 1997. Access to mathematics for visually disabled students
through multimodal interaction. Human-Computer Interaction 12, 47-92.
Taylor, M.M., F. Neel, and D.G. Bouwhuis, eds. 1991. The structure of multimodal dialogue. Amsterdam:
North-Holland.
Yeung, E. 1980. Pattern recognition by audio representation of multivariate analytical data. Analytical
Chemistry, 52(7) 1120-1123.
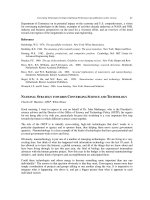
V
ISUAL
L
ANGUAGE AND
C
ONVERGING
T
ECHNOLOGIES IN THE
N
EXT
10-15
Y
EARS
(
AND
B
EYOND
)
Robert E. Horn, Visiting Scholar, Stanford University
Visual language is one of the more promising avenues to the improvement of human performance in
the short run (the next 10 to 15 years) (Horn 2000b, 2000c). The current situation is one of
considerable diversity and confusion as a new form of communication arises. But visual language also
represents many great opportunities. People think visually. People think in language. When words and
visual elements are closely intertwined, we create something new and we augment our communal
intelligence.
Converging Technologies for Improving Human Performance (pre-publication on-line version)
125
Today, human beings work and think in fragmented ways, but visual language has the potential to
integrate our existing skills to make them tremendously more effective. With support from
developments in information technology, visual language has the potential for increasing human
“bandwidth,“ the capacity to take in, comprehend, and more efficiently synthesize large amounts of
new information. It has this capacity on the individual, group, and organizational levels. As this
convergence occurs, visual language will enhance our ability to communicate, teach, and work in
fields such as nanotechnology and biotechnology.
Definition
Visual language is defined as the tight integration of words and visual elements and has characteristics
that distinguish it from natural languages as a separate communication tool as well as a distinctive
subject of research. It has been called visual language, although it might well have been called
visual-verbal language.
A preliminary syntax, semantics, and pragmatics of visual language have been described. (Horn 1998)
Description of, understanding of, and research on visual language overlap with investigations of
scientific visualization and multimedia.
Figure!B.8.! Defining visual language.
History
The tight integration of words and visual elements has a long history (Horn 1998, Chapter 2). Only in
the last 50 years, with the coming together of component visual vocabularies from such widely
separate domains as engineering diagramming technologies developed in medical illustration and
hundreds of expressive visual conventions from the world of cartooning, has something resembling a
full, robust visual-verbal language appeared (Tufte 1983, 1990).
Its evolution has been rapid in the past ten years, especially with the confluence of scientific
visualization software; widespread use of other quantitative software that permits the creation of over
one hundred quantitative graphs and charts with the push of a single function key; and the profusion of
multimedia presentation software, especially PowerPoint which, it is said, has several million users a
day.
B. Expanding Human Cognition and Communication
126
Figure!B.9.! Creation of visual language.
The Promise of More Effective Communication
There is widespread understanding that visual-verbal language enables forms and efficiencies of
communication that heretofore have not been possible. For example, improvements in human
performance from 23 to 89% have been obtained by using integrated visual-verbal stand-alone
diagrams. In this case, stand-alone diagrams refer to diagrams that have all of the verbal elements
necessary for complete understanding without reading text elsewhere in a document (Chandler and
Sweller 1991; Mayer 2001; Horton 1991).
There are several key advantages of the emerging visual-verbal language:
a)! It facilitates representation. This new language facilitates presentation of complex,
multidimensional visual-verbal thought, and — with multimedia tools — can incorporate
animation, as well. Researchers and scholars are no longer constrained by the scroll-like thinking
of endless paragraphs of text.
i)! It facilitates big, complex thoughts. Human cognitive effectiveness and efficiency is
constrained by the well-known limitations of working memory that George Miller identified in
1957 (Miller 1957). Large visual displays have for some time been known to help us overcome
this bandwidth constraint. But only since the recent advances in visual language have we been
able to imagine a major prosthesis for this human limitation. The prosthesis consists of a suite of
visual language maps. This visual-verbal language (together with computer-based tools) may
eliminate the major roadblocks to thinking and communicating big, complex thoughts, i.e., the
problem of representing and communicating mental models of these thoughts efficiently and
effectively.