Gear Noise and Vibration Episode 1 Part 7 pot
Bạn đang xem bản rút gọn của tài liệu. Xem và tải ngay bản đầy đủ của tài liệu tại đây (888.26 KB, 20 trang )
100
Chapter
7
frequency
divider
frequency
divider
phase
comparator
phase
error
which
is
T.E.
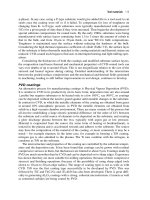
Fig 7.6
Block diagram
of
high speed T.E. tester.
Typically,
with
a
gear ratio
of
19:31
and the
standard 18,000
(x 4)
line
encoders
and 12 bit
digital recording,
the
resolution would
be to
about
0.1
second
of arc and
more than adequate
for
automobile
work.
The
detailed
design
of the
electronics requires some care
to get the
high accuracy
necessary
for the final
phase comparison.
This approach, unlike that
in
section
7.1
(the original pulse
frequency
multiplying
system)
is not
affected
by
torsional vibrations
at the
input
so it can be
used under industrial conditions
in
situ
on
machinery such
as
printing machines.
The
encoders
can be
mounted quite large distances
apart
(50
m)
on
printing rolls
to
investigate
dot
synchronisation problems
and
the
results show clearly when
the
gears
start
coming
out of
contact.
Although
intended originally
for on
site work
at
moderate speeds
of
the
order
of 200 rpm
there seems
to be no
practical limit
to
operating speeds
other than
the
requirement that
for the
simplest
and
most robust system
the
vibration
should
not be so
severe that there
is
reversal
of
rotation. This
is a
requirement
for
most
of the
systems.
Practical
limitations
of the
"double-divide" high speed system arise
from
three sources:
(a)
Since
the
system
will
operate over very large
frequency
ranges
from
roughly
0.01
rpm to
6000 rpm,
the
operator needs
to
dial tooth
numbers, roughly
to
zero
the
trace
on the
screen
and to set a
low-pass
filter
according
to the
conditions
so the
system
is not
completely
automatic
and
"idiot
proof." This makes
it
suitable
for
development
or
consultancy
work
but
less suitable
for
production monitoring using
unskilled
personnel when
speeds
and
tooth numbers change
frequently.
T. E.
Measurement
101
If
on the
other hand
a
test
rig is set up to
test
a
particular drive,
the
settings remain constant
and the
only requirement
is for the
operator
to
centralise
the
trace
on the
monitor. This
can
alternatively
be
done
by
computer control.
(b)
Unusual tooth numbers with large numbers
of
teeth give
too
coarse
a
frequency
resolution
to
pick
out
harmonics
of
tooth
frequency. If, for
example,
a 68
tooth pinion
is
meshing with
a
313
tooth wheel then
the
carrier wave which contains
the
phase
information
is at a frequency of
72,0007(68
x
313)
or 3.3
times tooth
frequency.
Setting
a
very high
performance
filter
(8-th order elliptic)
to 2 x
tooth
frequency
cuts
out
the
unwanted
"carrier"
frequency but
means that
only
the
1/tooth
and
2/tooth
components
of
error
can be
measured. This
is
rarely
a
limitation.
It can be
avoided
by
using multiplying circuits
[7] as in the
original system
but
measurement
is
then influenced
by
vibration.
Results
can
also
be
obtained
by
using
an
approximate
ratio,
see
section
7.10.
(c)
Encoder dynamics.
The
encoders
are
driven
via
light
but
torsionally
stiff
couplings,
but it is not
possible
to get the
torsional resonant
frequency
much
above
1500
Hz so the
useful
operating range
is
limited
to
about 1200
Hz
even with
the
most
careful
design
of the
coupling.
To
achieve this performance
there
must
be an
accessible
free end on
each
shaft.
The
alternative
is
using encoders mounted directly
on the
drive
shafts
but
this gives only
a
limited improvement
in frequency
range.
(d)
Non-synchronous drives. Occasionally
it is not
possible
to
mount
an
encoder directly
on a
gearshaft
so a friction or
belt drive
is
used. This
tends
to
limit
the rig
dynamics severely
and
also
the
drive
is no
longer
an
exact ratio.
The
drive ratio
can
usually
be
approximated
with
sufficient
accuracy using tooth numbers
of
less
than
100.
An
alternative variant possible
for
on-line high speed work
is a
blend
of
the
high speed
and
velocity approaches. Each encoder string
is
processed
separately
and is
simply taken
to a
demodulator.
The two
resulting vibrations
can
then either
be
logged separately
or the
input
can be
scaled
by the
velocity
ratio
and
subtracted
from the
output
to
give
the
T.E. This method appears
simple
but
costs
increase
as it
requires
two
expensive
filters
(demodulators)
and
two
accurate
flip-flops
rather than
one and
there
is an
additional scaling
involved
with possible errors
due to
small
differences
of two
large quantities.
There
are
different
approaches
to
demodulating
the
pulse string
from
an
encoder.
One
used
by
Tuma
[5]
involves
the
analytic extraction
of the
phase
of the
pulse string
and the
steady increase
of the
phase corresponds
to
the
rotational speed while
the
variations correspond
to the
torsional vibration.
At
each transition
from
+n/2
to -
n/2
the
analysis needs
to add the
value
TL
102
Chapter
7
This method
is
difficult
to
implement
in
real time
so is
more suitable
for
research where time scales
do not
need
to be
short.
The
corresponding analog approach uses
a
phase locked loop
to
generate
a
reference pulse string
at the
average rotation
speed.
The
phase
locked loop behaves
as a
seismic system
with
a
second order characteristic
and
will give good vibration information above
the
natural
frequency
of the
loop
while ignoring speed variations
or
vibrations well below
the
natural
frequency
of the
loop. Fig.
7.7
shows
a
block diagram
for one
loop
but two
are
needed
for
T.E. determination.
The
divider
can be set to any
number that
allows
the
output
not to
exceed
full
scale
but
setting
the
dividers
on the two
channels
to
numbers which approximate
to the
gear drive ratio
simplifies
subsequent subtraction.
input
from
encoder
2nd
order
filter and
damped
integrator
high
precision
flip
flop
t
0
6th
order
filter
output
Fig 7.7
Block diagram
for
phase-locked loop
for one
encoder channel.
T.
E.
Measurement
103
The
natural
frequency of the
loop
can be set
very
low so
that
the
output
still
records
the
once
per
revolution
conponents
of
torsional vibration
but
it is
more customary
to set the
loop
frequency at
about
a
third
of
tooth
frequency. The
output then gives
the
tooth
frequency and
harmonics
which
are
relevant
for
noise
investigations while ignoring eccentricities which
are
not of
interest
for
noise.
7.5
Tangential
accelerometers
One
alternative analog method
of
measuring T.E.
is by the use of
tangentially
mounted accelerometers
to
measure
the
torsional accelerations
of
each
of the
shafts
as
sketched
in
Fig. 7.8.
Two
matched accelerometers
are
used
and
their outputs
are
summed into
the
single
charge
amplifier
so
that
any
lateral vibrations
are
self cancelling.
The
torsional accelerations
of the
two
gears
are
scaled, proportional
to the
diameters,
to
give tangential
movements
at the
pitch radii
and
subtracted
to
leave
the
T.E.
En
route,
the
levels
of the
torsional vibration
in the
system
are
obtained.
Previous attempts using this approach
had
achieved limited
success
but
detailed checks against encoder measurement
of
torsional vibration
at
Cambridge established that:
clamp
bolt
accelerometer
clamp
bolt
accelerometer
Fig 7.8
Torsional accelerometer arrangement.
104
Chapter
7
(a)
Information
at
I/rev
was not
reliable
and
should
be
discarded.
In
operation
the low cut frequency on the
charge amplifiers
was set to
attenuate
the
I/rev
part
of the
signal
but to
pass
tooth
frequency.
(b)
There
was
good agreement between
accelerometers
and
encoders
in
the
middle
frequency
range.
(c) The
accelerometers appeared
to
give reliable information
at
high
frequencies
(>1
kHz) where
the
encoders were
no
longer reliable
due to
torsional
resonances.
The
advantage
of the
accelerometer
system
is the
extended
frequency
range
at the
upper
end and the
relative
ease
of
fitting tangential
accelerometers with
a
clamped flange compared with aligning encoders
and
using delicate high
frequency
couplings.
The
accelerometers
do not
need
a
free
shaft
end.
The
flange
needs
care
as the
match
to the
shaft
should
be
good,
the
flange
should
be
light
and the
clamping powerful enough
to
ensure that
the
accelerometers
follow
the
shaft
vibrations
faithfully.
Corresponding disadvantages
are the
I/rev
spurious results
due to
gravity interacting with accelerometer
axis
misalignment
and the
major
problems
of
supplying electrical power
and
buffering
out the
signal
on a
rotating
system
as
slip
rings
or
telemetry tend
to be
expensive
or
temperamental.
In
practice
the
accelerometer system
is
only
likely
to be
used when
there
is no
access
to a free end of
both
shafts
or the
1/tooth
frequencies are too
high
for
encoders.
It
may, however,
be
fitted
independently
for
monitoring
purposes
(as in
Chapter
15)
and the
measurement
of
T.E.
is
then
a
bonus.
Tangential
accelerometers inevitably give very
low
outputs
at low frequencies
so if
tooth
frequencies are
down
at 5 Hz as may
occur
with
worms
and
wheels
the
acceleration
for 1
um
is
only 0.0001
g and is
down below
the
noise level
so
this method
is not
suitable. Double integration
to
angular displacement
is
also temperamental
at low frequencies. The
usual solution
as
with much
vibration
testing
is to
analog integrate acceleration
to
velocity, data
log
velocity
then
frequency
analyse velocity
and
divide each band
by the
mean
angular
frequency to
derive
the
amplitude distribution.
7.6
Effects
of
dynamics
For
most noise investigations
we
wish
to
know
the
inherent accuracy
of
the
gears
as
mounted. Running
at
full
speed with encoders
fitted
will
give
us
the
torsional relative displacement
of the
gears
but
this
will
be a
function
of
both
the
inherent forcing
due to
T.E.
and the
torsional
and
lateral
vibrations
of the
internals
of the
drive
as
well
as
effects
from the
external
drive system dynamics.
T. E.
Measurement
105
T.E.
I.E.
1
revolution
T.E.
1
revolution
T.E.
1
revolution
T.E.
1
revolution
I
revolution
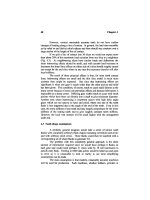
Fig
7.9
Variation
of
T.E. with
speed
due to
internal dynamics.
106
Chapter
7
Running
up and
down
the
speed range
as in
section
6.4
will
give
information
about
the
resonances
but the
main interest
for
production control
is
in
determining
the
quasi-static T.E.
(to
assess
gear accuracy) avoiding
the
complications
of the
system dynamics.
This
suggests that
the
ideal test condition would
be to run at 10
rpm
and
full
torque. This
is
usually
not
possible either because drive motor
or
(dynamometer)
load cannot operate
at low
speed
and
full
torque
or
because
gearbox teeth
or
bearings would
be
destroyed.
Plain
bearings
will
increase
their eccentricity
as the
speed drops
so the
alignment
of the
meshing
gears
may be
affected.
A
knowledge
of the
position
of the
first
internal resonance
is
highly
desirable, either
from
theoretical predictions
or by
running
the
drive under
torque
to find the
position
of the first
resonance.
The
resonance
may
appear
either
as a
peak
or as an
anti-resonance because
the
measured torsional
effects
due
to the
mesh
may
decrease
if
there
is
high lateral vibration
to
absorb
the
errors. Typically
the
T.E. traces would appear
as in
Fig. 7.9, with
the
underlying eccentricity
effects
unaltered
by the
speed changes
but
once-per-
tooth
showing
a
resonance. Tooth meshing conditions
may not be
exactly
correct
but
since
the
frequency
of the
lowest resonance
is
very insensitive
to
tooth mesh
stiffness
this does
not
matter.
Once
the first
resonance
is
located, results
up to
about
2/3 of
that
frequency
are
effectively
quasi-static
but the
effect
on
scuffing
and on
hydrodynamic
bearings must
be
checked unless
the
drive
is
designed
to run
over
a
wide speed range.
7.7
Choice
of
encoders
The
choice
of
encoders
is
wide
and
looking
at any
manufacturer's
catalog
is
confusing
as
some
50
different
designs
may be
listed. Absolute
angular position
is not
required
so it is the
incremental type
of
encoder that
is
used.
It is
simplest
to
classify
the
encoders, rather arbitrarily,
in
groups
as in
Table
1
which
refers
to
typical sizes
in a
range made
by
Heidenhain
[2].
As
can be
seen
from
Table
1,
high accuracy tends
to be
associated
with
large diameter (and correspondingly high
cost).
The
largest encoders
are
not
available
with
TTL
output
and
correspondingly have lower
frequency
limits.
The
outputs
are
11
uA
peak
to
peak
up to 90
kHz,
allowing
150
rpm or
1
V p-p up to
180
kHz, allowing
300
rpm.
The
medium size encoders
are
available with
TTL
outputs
and so
with
18,000
lines
can be run up to
3330 rpm, though
the
speed
can be
increased
by
using
an
encoder with
less
lines.
The
small encoders have
a 300 kHz
limit but,
as
they have
fewer
(5000) lines,
can
operate
up to
3600
rpm
before
encountering
the frequency
limitation.
T.
£.
Measurement
107
Table
1 -
Encoder parameters
Dia.
mm
Mass
kg
170
2.8
200
3.3
110
0.7
110
0.8
58
0.25
58
0.25
36.5
0.1
36.5
0.1
Shaft
type
Solid
14
<j>
60 mm
bore
Solid
10<t>
20mm
bore
12
mm
bore
Solid
10<j>
Solid
4<J>
6 mm
bore
Accuracy
Sec
arc
±1
±1
±5
±5
±13
±13
±18
±18
No of
lines
typically
36000
36000
18000
18000
5000
5000
3600
3600
Output
11
nA
90kHz
1
V
180kHz
TTL
1
MHz
TTL
1
MHz
TTL
300kHz
TTL
300 kHz
TTL
300kHz
TTL
300kHz
Name
ROD
800
RON
886
ROD
260
ROD 225
ERN
420
ROD
420
ROD
1020
ERN
1020
Encoder
price
is
roughly proportional
to
weight
so
there
is a financial
incentive
to use the
smaller encoders.
All
encoders have axial length less than
50mm.
When
mounting encoders onto
a
gearbox, choosing between
a
through-bore
or
stub
shaft
installation
can be
difficult.
If
there
is a
through
shaft
such
as a
collet operating
rod
then there
is no
choice
and an
encoder
with
sufficient
through bore must
be
used. Otherwise, with
a free
shaft
end,
the
choice
is
complex
but is
dictated
by the
mechanics
of the
test setup.
The
through-bore type
is
usually completely supported
by the
gear
shaft
extension
and so the
installation
is
simple
with
high torsional natural
frequencies,
typically
above 1000
Hz
even
for the
medium-sized encoders.
Reference
to
"earth"
requires
a
restraint
arm as
long
as
possible with rigid light
construction
so
there
are
small angular movements
of the
stator
due to any
eccentricities.
The
corresponding disadvantages
are
that
the
shaft
must
run
true
or
lateral vibrations will
be
high
and the
shaft
must
be
strong enough
to
take
the
weight
and
vibration
of the
encoder body. This
is not
usually true
if
an
extension
has
been bonded
or
pressed
onto
an
existing (short)
gearshaft.
The
overhung mass
of the
encoder
may be
large
in
relation
to
gear masses
and
so may
give
an
extra
low frequency
resonance.
108
Chapter
7
mounting
plate
gearcase
Fig
7.10 Encoder mounting
at
shaft
ends.
Installation
of the
stub
shaft
type
of
encoder
is
more
difficult
as the
main
body
has to be
held
by
bolting onto
a
mounting plate which
is
itself
supported
off the end
face
of the
gearbox
as in
Fig.
7.10
The
plate should
be
mounted
sufficiently
accurately
to
ensure that
the
encoder
is
aligned
to the
gearshaft
extension
within
about
25
um
and the
gearshaft
extension should
be
running
true
within
about
25 um so
that
the flexible
coupling between them
does
not
have
to
cope
with large misalignments.
The
manufacturers
can
supply suitable couplings (such
as the
KO3) which
are
torsionally very rigid
to
maintain high torsional natural
frequencies but are
flexible laterally
as the
encoders
must
not be
subjected
to
high
(10 N)
spindle loads either axially
or
laterally.
The
mounting plates
for the
encoders must
be
mounted very rigidly
to the end
face
of the
gearcase
since
if
they vibrate torsionally
the
information
will
not be
correct.
T.
£.
Measurement
109
mounting
plate
centre
distance
mounting
plate
gearcase
plate
support
pillars
support
pillar
Fig
7.11
Staggered mounting with
low
centre distance.
A
complication
can
arise with either through
or
stub mounting since
the
centre distance
of the
gear pair
may not
accommodate
the two
encoder radii
and
one
shaft
must
be
extended
to
allow
the
encoders (and
if
necessary their
couplings)
to be
staggered
axially
as in
Fig.
7.11.
Use of
smaller encoders
such
as the 58 mm
diameter encoders helps greatly
as the
centre distance
can
then
be 60 mm
without stagger
or
about
40 mm
with
an
extended
shaft
and
stagger.
The
smallest practical size
is
36.5
mm
diameter
and
without stagger
the
centre distance
is 37 mm or
with
maximum
stagger
the
centre distance
can
be
about
22 mm.
Unfortunately
this involves having
a
shaft
extension which
is
long
and
slender, making
it
difficult
to
ensure that
it
runs true. Long
shaft
extensions make
it
more likely that gearbox dynamics will
be
altered
if the
encoder
is
shaft
mounted
or
that
the flexible
coupling
has to
accommodate
large
eccentricities.
110
Chapter?
7.8
Accuracy
of
measurement
The
calibrated accuracy
of the
larger
(150
mm)
encoders
is
better
than
1
second
of arc and for the
100
mm
encoders used normally
is
about
2
seconds
of
arc.
Careful
design
and
manufacture
of the
necessary torsional
diaphragm couplings
will
give errors that
are
undetectable
and
there
is
virtually
no
limit
to the
accuracy obtainable with
the
electronics especially
for
low
tooth numbers.
When
comparing
accuracies,
the
first
requirement
is to
check
whether peak value, peak
to
peak
or
r.m.s.
is
being quoted.
For
gear noise
work
it is p-p
which
is
most
frequently of
use,
so on the
encoders listed above
there
is a
range
from 2 sec to 36 sec
arc.
The
resulting accuracy
of
T.E.
is
controlled predominantly
by the
encoder accuracy.
For
drives which need absolute accuracy, such
as
printing
drives
or
positioning drives,
the
quoted
±1
second (ROD 800)
or ±2 to ±5
seconds
(ROD 260)
is the
relevant accuracy.
It is
possible
to
improve
on
this
accuracy
by
first
using
a
dynamic
back-to-back
calibration technique which
gives
the
individual errors
at,
say, 2000 points round
an
encoder
[8].
This information
can
then
be
used
to
computer-correct observed
results
and get a
significant gain
in
accuracy
so
that
±0.1
sec of arc is
feasible.
For
noise purposes, this
is not
needed since
we get a
major accuracy
bonus because
we are
only interested
in frequencies
such
as
tooth
frequency
which
is at
15
times
per rev or
greater
frequencies.
A
typical
manufacturer's
calibration curve
is
shown
in
Fig
7.12
and
the
major
components
of
error
are of frequency
less than
5
times
per rev
and at
line
frequency
(18000
times/rev)
or
greater.
Initial calibration checks
on
the
large encoders gave
errors
of
less
than 0.03
sec arc at
15/rev
harmonics
and
above
and
subsequent
tests
on
medium size encoders
(ROD220) also showed errors well under
0.1
sec
[6].
1
sees
0
arc
- 1
1
revolution
Fig
7.12 Typical error curve
for an
encoder.
T. E.
Measurement
111
Harmonic
errors
for
ERN420
encoder
0.7
r
10
20 30
harmonics
of
1/rev
40
50
Fig
7.13 Frequency analysis
of
encoder position
errors.
Recently,
tests
were carried
out on the
small size
of
encoder
(ERN420)
with
a
nominal accuracy
of 26 sec arc p-p for the
5000 line
version.
The
results were very encouraging
as the
errors
for
components
at
frequencies
above
15/rev
were well below
0.1
sec and
were consistent
to
well
within
this figure. Fig.
7.13
shows results
for the frequency
analysis
of the
errors
for 2
test runs
in the
same direction.
As
errors
at
tooth
frequencies are
at
least
30 dB
down
and are
less than 0.03
of a
second
of arc
then even
on 1
m
diameter gear this corresponds
to
less than
a
tenth
of a
micron
and may be
ignored.
The
error curves supplied
by the
manufacturers
may
sometimes show
significant
errors
at frequencies
such
as
98/rev
but
these
false
errors
are due
to
arbitrary sampling techniques which pick
up and
alias high
frequency
errors
and do not
necessarily appear when
the
encoders
are
being used
for
normal
T.E. measurement especially when checking worms
and
wheels.
The
very
small
encoders
are
less accurate
but
accuracy
at
once
per
tooth
frequency
is
unlikely
to be a
problem since
the
radii
of the
gears
are so
small. Typically
with
a
gear only
50 mm
diameter,
as 1 sec arc is
4.85
(iradian,
0.5
jim
error
is
4
sec
arc. When using
the
very small encoders
the
coupling
is
liable
to
give
112
Chapter?
I/rev
errors
larger than
the
encoder
errors
but
this again does
not
influence
1/tooth
accuracy.
When
using tangential
accelerometers,
T.E. accuracies
are
normally
high
for
once-per-tooth
frequencies but it is
more
difficult
to
assess accuracies
if
there
are
high torsional vibrations present
(at low frequency)
since
we may
be
concerned with
a
small
difference
between
two
large quantities. However,
errors
are
usually
negligible.
7.9
Worms
and
wheels
and
spiral bevels
Testing worms
and
wheels
or
spiral bevels
follows
the
same
approach
as
testing parallel
shaft
gears but,
as
with
all
crossed axis gears,
greater
care
is
needed.
There
is
little point
in
testing
the
gear pairs
out of
their casings
as
they
are
extremely sensitive
to
shaft
positions
and the
change
from
setup
rig
T.E.
to
in-case T.E.
can be
dramatic.
The
layout
of the
test
is
inevitably more
complicated
as
there
is a
change
of
direction involved
and
usually
offset
axes
so
auxiliary packing blocks must
be
made.
In
addition allowance
may be
needed
for
small variations
in
axis
offset
so it is
usual
to
have
a
flexible
coupling
at
input
and
output.
The
coupling needs
to be
robust
to
stand
up to
shop
floor
handling
if on
production
but
must
be
accurate.
Worms
and
wheels have
the
complication that
the
critical once
per
tooth
frequency is at
once
per rev of the
input
so
coupling
and
encoder should
be
reasonably accurate. Designs which have
an
internal coupling between
a
motor
and
worm
are
difficult
to
test
in the
completed
state
as
errors which
are
at
"once
per
tooth"
or
harmonics
can be
gear
or
coupling. When
the
drive
is
being used
for
positioning
and
accuracy
is
important
it is
advisable
to
have
some system such
as
double eccentrics
for
varying
the
position
and
directions
of the
worm axis relative
to the
wheel
to
allow selection
of the
best meshing
conditions
to
minimise
the
1/tooth
component.
When
testing accurate worms
and
wheels intended
for
positioning
use in the
metrology
lab it is
advisable
to run the
input rather faster than
normal
since
an
input
speed
of 10
rpm
and a
reduction ratio
of 360 to 1
would
involve
a
wait
of 36
minutes
for
each output rev. This suggests that
an
input
speed
of
about
200 rpm
would
be
more suitable
and so the
tendency
is to use a
smaller
encoder
at
input especially
as
high accuracy
is not
needed.
The
smallest size
of
encoder
is not
usually suitable
as the
bellows type
of
coupling
for
4 mm dia is not
accurate
at
I/rev.
There should also
be an
integral ratio
between
the
numbers
of
lines
at
input
and
output
to
simplify
the
setting
of the
ratios.
Similar
considerations apply
to
spiral bevel drives
but
they
are
usually used
for
high powers rather than accuracy
so
there
is
liable
to be
heat
T. E.
Measurement
113
generation
in
situ. This
can
mean that
to get
realistic T.E. results
in a
metrology lab,
it is
necessary
to
preheat
a
rear axle
differential
unit
to
about
70°
C to get
results which
are
representative
of
in-service conditions. This
is
especially
relevant
for
aluminium
alloy
casings.
7.10 Practical problems
An
extension
of the use of
T.E. (single
flank)
checking
is to
measure
the
errors
on one
(drive)
flank
then,
without altering settings
or
losing
position,
to
transfer
to the
"back"
flank and
measure that.
The
resultant plot
gives
not
only
the
errors
but the
variation
in
backlash
which
may be
crucial
for
control drives
or
very accurate positioning systems.
The
pulse processing
is
in
general more complex
as it
must account
for
direction changes
if
drive
direction
is
reversed
but if it is
possible
to
reverse
the
load torque
to
transfer
to the
other
flank
while continuing
to
rotate
in the
same direction this does
not
involve change
of
rotation direction
and so all the
systems will cope.
The
encoder systems, other than
the
batching approach,
rely
on the
basic assumption that between sampling pulses there
are
negligible variations
in
speed.
In
practice this
is
true unless
a
ridiculously
low
number
of
encoder
lines
is
used
for the
velocity approach
or
there
are
very high tooth numbers
with
the
high speed
approach.
Testing
parallel
shaft
gears
as
pairs
in
their
unmounted state allows
extra testing
to be
done
to
check
the
effects
of
misalignment
on the
mesh.
Input
pinion block with
drive motor
Q
O
O!
slip
gauges
CT
O
Straight edge
Fig
7.14 Diagram
of
plan view
of
setup
on
surface table
for
parallel axis
checking.
114
Chapter
7
Straight
edge
Fig
7.15
Use of two
feelers
to
prevent centre distance variation when
checking misalignment.
The
basic setup
can be as
shown
in
plan view
in
Fig.
7.14
where
an
accurate straight edge
is
used
as a
reference.
One
bearing block
is
positioned
against
the
edge
and
slip gauges
are
used
to
position
the
other bearing block
so
that
it is
exactly parallel
and the
correct centre distance away. Testing like
this
gives
the
results that would
be
obtained
if the
gear axes were perfectly
aligned
in the
gearbox
but it is
sometimes very worthwhile
in
development
being able
to
deliberately misalign
the
gear
axes
to
check sensitivity
to
manufacturing
errors
or
deflections. Feeler gauges
may be
used
or the two
stacks
of
slip gauges altered
but it is
advisable
to
ensure that centre distance
at
the
gears
is not
altered
as
indicated
in
Fig.
7.15,
exaggerated.
The
problem
in the
high speed system
of
very large tooth numbers
giving
too
coarse sampling
was
mentioned above
and
there
is a
linked
problem
if for
unusual
reasons
the
drive
is not
exactly synchronous.
The
latter
can
occur
if for
operational reasons
an
encoder
is not
directly coupled
to
a
gear
but is
driven
by a
friction
drive
or a
belt drive. Large tooth numbers
can
occur
if a
gearbox
is
two-stage
as
with, say,
19:27
first
mesh
and
31:34
second mesh,
the
overall ratio
is
589:918
with
no
common factors.
If
lack
of
space involves using
small
encoders which only give 20,000 pulses
per
rev,
T. E.
Measurement
115
there
are
insufficient
pulses
to
allow measurement
of
1/tooth
frequencies and
the
scaling
is too
coarse
as
mil
scale would
be 360 x 60 x 60 x 589 /
20,000
or
over
10° arc at the
output gear.
A
solution
to the
problem
can be to use an
approximate ratio which
can
be
found
using
the
Matlab routine
'rat'.
The
ratio
in
this case
is
0.64161
so
the
routine reads
[N,D]
-
rat(0.64161, 0.0005)
The
exact ratio
is
input together with
a
figure
for the
permissible
error
from the
exact value
and the
routine returns
the
values
of the
lowest
integers which
will
approximate
the
ratio.
The
routine returns 34:53 which
is
an
exact ratio
of
0.64151
and so
only 0.0001 away
from the
correct value.
Dialling
up
this will allow measurement
to a
sensible
full
scale value
and
with
adequate margin between
1/tooth
and
carrier
frequencies.
The
corresponding penalty
is
that
the
trace
will gradually creep
up or
down
the
screen
and
exceed
the
limits, reappearing
at the
other limit. Non-
synchronous ratios between 0.99
and
1.01 present problems
but
these ratios
are
rare.
When
the
system
is
run,
the
output would normally appear either
on
scale
as in
Fig.
7.16
or
going over
the
limits
as in
Fig.
7.17.
In the
latter
case
the
trace
is
brought into range
by
injecting pulses into
one or
other encoder
string until
the
trace
is
roughly central
as in
Fig.
7.16.
upper
limit
5V
(360
phase)
lower
limit
-5 V (0
phase)
Fig
7.16 T.E. trace centred
on
screen.
116
Chapter
7
upper
limit
5 V
(360
phase)
lower limit
-5 V (0
phase)
Fig
7.17 T.E. trace exceeding
limits.
With
a
non-exact
ratio
or
with
microslip
at a
drive
joint
or
with
a
friction
or
belt non-synchronous drive
the
trace
will
drift
as
indicated
in
Fig.
7.18.
This
is of
course
a
nuisance
but
provided that
the
trace does
not
drift
out of
range within, say,
4
revs
of the
input
it is
possible
to
record
4
revs
and
the
resulting
frequency
analysis
will
be
sufficiently
accurate. Taking
a
value
for
drift
which
is
0.0003 away
from the
correct value means that each
revolution
the
drift
will
be
0.0003
of
360° which
is 389 sec of
arc. Turning
this into
um
for a
radius
of 50 mm
gives
94
jam
so in 4
revs
377
urn
apparent
slip
will
occur.
A
full
scale setting
of the
order
of
twice this will allow
for the
4
revs
of
slip
and
typical eccentricities.
The
alternative
is to
change allegiance
to the
seismic approach
described above where each encoder string
is
analysed separately
to
give
the
torsional
vibrations which
are
then scaled
and
subtracted. This
has the
penalty
of
more complex electronics
but
still
operates easily
in
real time
if
phase lock loops
are
used.
If
drift
is
ocurring
it can be
difficult
to
decide whether
the
cause
is
mechanical
microslip
in the
drive
or is
stray electrical pulses
from
mains
interference.
Variation
of
torque
may
solve
the
problem
or if
count activity
occurs
on the
dividers
of the
high speed system when
the rig is
stationary.
Operating
an
electric
drill
which
is
plugged
in to a
neighbouring socket
may
induce
a
response
if a
system
is
noise spike sensitive.
T.
£.
Measurement
117
upper limit
5 V
(360 phase)
lower
limit
-5 V (0
phase)
Fig
7.18 T.E. trace with
drift
occurring.
This problem
of
noise sensitivity
can be
greatly reduced
in a
specific
case
by
altering
the
interface electronics
so
that
the
encoder signal
comparators
at
input have
a
slow switching response suitable
for the
particular (slow)
test
conditions.
The
system interfaces must then
be
altered
back
to
normal
if
high speed tests
are
subsequently required.
In
practice
it can
very
be
difficult
to
prevent
microslip
if
rigid
couplings
are
used when testing gears
in
situ
in a
gearbox
so it is
very
advisable
to use flexible
couplings such
as the
Heidenhain
KO3
which
is
designed
to
give both accurate drive
and
high torsional rigidity
to
keep
natural
frequencies
high. Correspondingly
any
support system
for an
encoder
body
or
torsional restraint system requires care
to
prevent vibration.
7.11
Comparisons
With
five
differing
methods
of
measuring T.E. available
it is, at first
sight, rather
difficult
to
make
a
choice. However
the
original approach
is
now
no
longer used
due to the
restrictions imposed
by the
multipliers
so it can
be
ruled out.
Tangential
accelerometers
will
not
give
useful
results
at
once
per rev
or
at low frequencies and so are
unlikely
to be
used
in a
metrology laboratory
where test speeds
are
very low. Running
at
speed would give tooth separation
unless
the
complication
of a
torque load
at
output
is
added.
The
main
use of
accelerometers
is
rather specialised
for
conditions where tooth
frequencies are
118
Chapter?
high, above
1 kHz and
torque
is
applied
or
where
the
lack
of a free
shaft
end
rules
out
encoders. They
can
however
be fitted
inside gearboxes whereas
encoders
are
less
likely
to be
oilproof.
The
choice
of
encoders
is
controlled
by
factors such
as the
mechanical
limitations
on
centre distance
and the
mass
and
speed limitations
of
large
encoders.
In
practice,
for
gear noise work, accuracy
is not a
limitation.
Choice between
shaft
mounting
and
coupling drive
is not
clear
and
depends
on
available space
and on
whether
a
robust
shaft
extension
is
available.
For
the
electronics, choice between
the
batching, velocity
and
high
speed approaches
is
much more
difficult.
At
metrology
speeds,
typically
below
25
rpm,
any of the
systems
can be
used
and
will
give satisfactory
results
and
accuracies
are
comparable
as it is the
encoder accuracies which
control
the
final
result.
At
these speeds
the
choice
will
tend
to
depend
on
availability
and
cost
of the
equipment.
The
batching approach
is
probably
the
most
straightforward
if
unskilled labour
is
doing routine production testing.
However
the
equipment commercially available
[9] is
expensive
as it is
designed
to
handle
a
very wide range
of
test gears
and to be
"foolproof.
The
velocity
approach
is
probably
the
cheapest option
as it
does
not
involve
interpolation
and
only needs
a
standard data logging card
in its
simplest
version
but is
slow.
To
increase
speed
sufficiently
to
work
in
real time
a
specialised counter card
is
needed.
At
high rotation speeds
it is not
possible
to use the
batching
approach
and
either
the
velocity
or
high speed approach must
be
used.
The
velocity approach requires
fast
computing ability
and so
tends
to
have
to
work
off-line.
The
high speed approach
has the
ability
to
display
the
results
in
real
time
but
initial zeroing
is
required, taking
a few
seconds
if
done manually
or
about
4
revs
of the
input
if
under computer control.
If
the
drive
is not
synchronous
the
double divide system
does
not
like
drift
and the
attendant complications
so it is
simpler
to use the
velocity
approach
or
demodulation
of the
individual encoder
signals.
Demodulation
using
phase-lock loops works
fast
and
effectively
but is not
easily
or
quickly
altered
if
loop natural
frequency has to be
changed
so
although
it is
very
suitable
for
test rigs which
are
always operating
in a
narow band
of
conditions
it is
less
suitable
for
wide ranging conditions.
T. E.
Measurement
119
References
1.
Munro,
R.G.,
'A
Review
of the
Theory
and
Measurement
of
Gear
Transmission
Error.'
Int. Conference
on
Gear Noise
and
Vibration,
I.
Mech.
E.,
April 1990,
p 3.
2.
Heidenhain
Ltd.,
200
London Rd., Burgess
Hill,
Sussex,
RH15
9RD,
U.K.
or 115
Commerce Drive,
Schaumburg,
IL
60173,
U.S.A.
3.
Sweeney,
P.J.
and
Randall, R.B.,
'Gear
transmission error
measurement
using phase
demodulation.'
Proc.
Inst.
Mech. Eng.,
Vol210C,
1996,
pp
201-213.
4.
Remond,
D.,
'Practical
performances
of
high-speed measurement
of
gear transmission error
or
torsional vibrations with optical
encoders.'
Meas. Sci.
Technol.
9
1998,1.O.P.
pp
347-353
5.
Tuma
J.,
'Phase
demodulation
in
angular vibration
measurements.'
International
Carpathian Control Conference,
Malenovice,
Czech
Republic.
May
2002.
(Dept.
Control
Systems
and
Instruments,
VSB
Tech
Univ
Ostrava,
Ostrava, Czech
Republic,
)
6.
Smith, J.D.,
'Gear
Transmission Error Accuracy with Small Rotary
Encoders.'
Proc.
Inst.
Mech.
Eng.,
vol. 201,
No. C2,
1987,
pp
133-
135.
7.
Smith, J.D.,
'A
Modular System
for
Transmission Error
Testing.',
Proc. Inst. Mech. Eng. vol. 202,
No. C6,
1988,
p
439.
8.
Smith, J.D.,
'Practical
Rotary Encoder Accuracy Limits
for
Transmission
Error
Measurement.'
Proc. Inst. Mech.
Eng.,
1991,
205
(C6),pp
431-436.
9.
Klingelnberg
Ltd.
PSKE
900.
www.klingelnberg-oerlikon