Data Analysis Machine Learning and Applications Episode 1 Part 1 doc
Bạn đang xem bản rút gọn của tài liệu. Xem và tải ngay bản đầy đủ của tài liệu tại đây (793.18 KB, 25 trang )
Studies in Classification, Data Analysis,
and Knowledge Organization
Managing Editors Editorial Board
H H. Bock, Aachen Ph. Arabie, Newark
W. Gaul, Karlsruhe D. Baier, Cottbus
M. Vichi, Rome F. Critchley, Milton Key nes
R. Decker, Bielefeld
E. Diday, Paris
M. Greenacre, Barcelona
C. Lauro, Naples
J. Meulman, Leiden
P. Monari, Bologna
S. Nishisato, Toronto
N. Ohsumi, Tokyo
O. Opitz, Augsburg
G. Ritter, Passau
M. Schader, Mannheim
C. Weihs, Dortmund
E. Diday, Y. Lechevallier, and
O. Opitz (Eds.) Ordinal and
Symbolic Data Analysis. 1996
R. Klar and O. Opitz (Eds.)
Classification and Knowledge
Organization. 1997
C. Hayashi, N. Ohsumi, K. Yajima,
Y. Tanaka, H H. Bock, and Y. Baba (Eds.)
Data Science, Classifaction,
and Related Methods. 1998
I. Balderjahn, R. Mather, and
M. Schader (Eds.)
Classification, Data Analysis, and
Data Highways. 1998
A. Rizzi, M. Vichi, and H H. Bock (Eds.)
Advances in Data Science
and Classification. 1998
M. Vichi and O. Optiz (Eds.)
Classification and Data Analysis. 1999
W. Gaul and H. Locarek-Junge (Eds.)
Classification in the Information
Age. 1999
H H. Bock and E. Diday (Eds.)
Analysis of Symbolic Data. 2000
H. A. L. Kiers, J P. Rasson, P.J.F.
Groenen, and M. Schader (Eds.)
Data Analysis, Classification, and
Related Methods. 2000
W. Gaul, O. Opitz, M. Schader (Eds.)
Data Analysis. 2000
R. Decker and W. Gaul (Eds.)
Classification and Information
Processing at the Turn of the
Millenium. 2000
S. Borra, R. Rocci, M. Vichi,
and M. Schader (Eds.)
Advances in Classification and Data
Analysis. 2000
W. Gaul and G. Ritter (Eds.)
Classification, Automation, and New
Media. 2002
K. Jajuga, A. Sokolowski, and
H H. Bock (Eds.)
M. Schwaiger and O. Opitz (Eds.)
Exploratory Data Analysis in
Empirical Research. 2003
M. Schader, W. Gaul, and M. Vichi (Eds.)
Between Data Science and Applied
Data Analysis. 2003
H H. Bock, M. Chiodi, and
A. Mineo (Eds.)
Advances in Multivariate Data
Analysis. 2004
D. Banks, L. House, F.R. McMorris,
P. Arabie, and W. Gaul (Eds.)
Classification, Clustering, and Data
Minig Applications. 2004
D. Baier and K D. Wernecke (Eds.)
Innovations in Classification, Data
Science, and Information Systems. 2005
M. Vichi, P. Monari, S. Mignani, and
A. Montanari (Eds.)
New Developments in Classification
and Data Analysis. 2005
D. Baier, R. Decker, and L. Schmidt-Thieme (Eds.)
Data Analysis and Decision Support. 2005
C. Weihs and W. Gaul (Eds.)
Classification - the Ubiquitous
Challenge. 2005
M. Spiliopoulou, R. Kruse, C.
Borgelt, A. Nürnberger, and W. Gaul (Eds.)
From Data and Information Analysis
to Knowledge Engineering. 2006
V. Batagelj, H H. Bock, A. Ferligoj,
and A. Žiberna (Eds.)
Data Science and Classification. 2006
S. Zani, A. Cerioli, M. Riani, M. Vichi (Eds.)
Data Analysis, Classification and the
Forward Search. 2006
F. de Carvalho (Eds.)
Selected Contributions in Data Analysis
and Classification. 2007
Advances in Data Analysis. 2007
C. Preisach, H. Burkhardt, L. Schmidt-Thieme,
R. Decker (Eds.)
Data Analysis, Machine Learning and Applications.
2008
P. Brito, P. Bertrand, G. Cucumel,
R. Decker, H J. Lenz (Eds.)
Classification, Clustering and Data
Analysis. 2002
Titles in the Series:
123
Data Analysis,
Machine Learning
and Applications
Christine Preisach
· Hans Burkhardt
Proceedings of the 31st Annual Conference
of the Gesellschaft für Klassifikation e.V.,
Albert-Ludwigs-Universität Freiburg,
March 7–9, 2007
(Editors)
Lars Schmidt-Thieme
· Reinhold Decker
With 226 figures and 96 tables
© 2008 Springer-Verlag Berlin Heidelberg
This work is subject to copyright. All rights are reserved, whether the whole or part of the material is
concerned, specifi cally the rights of translation, reprinting, reuse of illustrations, recitation, broadcasting,
reproduction on microfi lm or in any other way, and storage in data banks. Duplication of this publication
or parts thereof is permitted only under the provisions of the German Copyright Law of September 9,
1965, in its current version, and permission for use must always be obtained from Springer. Violations
are liable for prosecution under the German Copyright Law.
The use of registered names, trademarks, etc. in this publication does not imply, even in the absence of
a specifi c statement, that such names are exempt from the relevant protective laws and regulations and
therefore free for general use.
Cover Design: WMX Design GmbH, Heidelberg, Germany
Printed on acid-free paper
5 4 3 2 1 0
springer.com
Christine Preisach
University of Hildesheim
Marienburgerplatz 22
Germany
Professor Dr. Hans Burkhardt
Gebäude 052
79110 Freiburg i. Br.
Germany
Professor Dr. Dr. Lars Schmidt-Thieme
Marienburgerplatz 22
31141 Hildesheim
Germany
Professor Dr. Reinhold Decker
Germany
ISBN: 978-3-540-78239-1
e-ISBN: 978-3-540-78246-9
Library of Congress Control Number: 2008925870
Institute of Computer Science and
Universität Freiburg
Universitätsstraße 25
33615 Bielefeld
Lehrstuhl für Mustererkennung und
Institute of Business Economics and
Institute of Computer Science and
Institute of Business Economics and
Information Systems
Information Systems
insbes. Marketing
Bildverarbeitung
31141 Hildesheim
Fakultät für Wirtschaftswissenschaften
Lehrstuhl für Betriebswirtschaftslehre,
Editors
Preface
This volume contains the revised versions of selected papers presented during the
31
st
Annual Conference of the German Classification Society (Gesellschaft für Klas-
sifikation – GfKl). The conference was held at the Albert-Ludwigs-University in
Freiburg, Germany, in March 2007. The focus of the conference was on Data Analy-
sis, Machine Learning, and Applications, it comprised 200 talks in 36 sessions. Ad-
ditionally 11 plenary and semi-plenary talks were held by outstanding researchers.
With 292 participants from 19 countries in Europe and overseas this GfKl Confer-
ence, once again, provided an international forum for discussions and mutual ex-
change of knowledge with colleagues from different fields of interest. From alto-
gether 120 full papers that had been submitted for this volume 82 were finally ac-
cepted.
With the occasion of the 30
st
anniversary of the German Classification Society
the associated societies Sekcja Klasyfikacji i Analizy Danych PTS (SKAD), Verenig-
ing voor Ordinatie en Classificatie (VOC), Japanese Classification Society (JCS) and
Classification and Data Analysis Group (CLADAG) have sponsored the following in-
vited talks: Paul Eilers - Statistical Classification for Reliable High-volume Genetic
Measurements (VOC); Eugeniusz Gatnar - Fusion of Multiple Statistical Classifiers
(SKAD); Akinori Okada - Two-Dimensional Centrality of a Social Network (JCS);
Donatella Vicari - Unsupervised Multivariate Prediction Including Dimensionality
Reduction (CLADAG).
The scientific program included a broad range of topics, besides the main theme
of the conference, especially methods and applications of data analysis and machine
learning were considered. The following sessions were established:
I. Theory and Methods
Supervised Classification, Discrimination, and Pattern Recognition (G. Ritter); Clus-
ter Analysis and Similarity Structures (H H. Bock and J. Buhmann); Classifica-
tion and Regression (C. Bailer-Jones and C. Hennig); Frequent Pattern Mining (C.
Borgelt); Data Visualization and Scaling Methods (P. Groenen, T. Imaizumi, and A.
Okada); Exploratory Data Analysis and Data Mining (M. Meyer and M. Schwaiger);
Mixture Analysis in Clustering (S. Ingrassia, D. Karlis, P. Schlattmann and W. Sei-
VI Preface
del); Knowledge Representation and Knowledge Discovery (A. Ultsch); Statistical
Relational Learning (H. Blockeel and K. Kersting); Online Algorithms and Data
Streams (C. Sohler); Analysis of Time Series, Longitudinal and Panel Data (S. Lang);
Tools for Intelligent Data Analysis (M. Hahsler and K. Hornik); Data Preprocessing
and Information Extraction (H J. Lenz); Typing for Modeling (W. Esswein).
II. Applications
Marketing and Management Science (D. Baier, Y. Boztug, and W. Steiner); Banking
and Finance (K. Jajuga and H. Locarek-Junge); Business Intelligence and Person-
alization (A. Geyer-Schulz and L. Schmidt-Thieme); Data Analysis in Retailing (T.
Reutterer); Econometrics and Operations Research (W. Polasek); Image and Sig-
nal Analysis (H. Burkhardt); Biostatistics and Bioinformatics (R. Backofen, H P.
Klenk and B. Lausen); Medical and Health Sciences (K D. Wernecke); Text Mining,
Web Mining, and the Semantic Web (A. Nürnberger and M. Spiliopoulou); Statistical
Natural Language Processing (P. Cimiano); Linguistics (H. Goebl and P. Grzybek);
Subject Indexing and Library Science (H J. Hermes and B. Lorenz); Statistical Mu-
sicology (C. Weihs); Archaeology and Archaeometry (M. Helfert and I. Herzog);
Psychology (S. Krolak-Schwerdt); Data Analysis in Higher Education (A. Hilbert).
Contributed Sessions (by CLADAG and SKAD)
Latent class models for classification (A. Montanari and A. Cerioli); Classification
and models for interval-valued data (F. Palumbo); Selected Problems in Classifica-
tion (E. Gatnar); Recent Developments in Multidimensional Data Analysis between
research and practice I (L. D’Ambra); Recent Developments in Multidimensional
Data Analysis between research and practice II (B. Simonetti).
The editors would like to emphatically thank all the section chairs for doing
such a great job regarding the organization of their sections and the associated paper
reviews.
Cordial thanks also go to the members of the scientific program committee for
their conceptual and practical support as well as for the paper reviews: D. Baier
(Cottbus), H H. Bock (Aachen), H. Bozdogan (Tennessee), J. Buhmann (Zürich),
H. Burkhardt (Freiburg), A. Cerioli (Parma); R. Decker (Bielefeld), W. Gaul (Karl-
sruhe), A. Geyer-Schulz (Karlsruhe), P. Groenen (Rotterdam), T. Imaizumi (Tokyo),
K. Jajuga (Wroclaw), R. Kruse (Magdeburg), S. Lang (Innsbruck), B. Lausen (Erlan-
gen-Nürnberg), H J. Lenz (Berlin), F. Murtagh (London), H. Ney (Aachen), A.
Okada (Tokyo), L. Schmidt-Thieme (Hildesheim), C. Schnoerr (Mannheim), M.
Spiliopoulou (Magdeburg), C. Weihs (Dortmund), D. A. Zighed (Lyon).
Furthermore we would like to thank the additional reviewers: A. Hotho, L. Mar-
inho, C. Preisach, S. Rendle, S. Scholz, K. Tso.
The great success of this conference would not have been possible without the
support of many people mainly working in the backstage. We would like to par-
ticularly thank M. Temerinac (Freiburg), J. Fehr (Freiburg), C. Findlay (Freiburg),
E. Patschke (Freiburg), A. Busche (Hildesheim), K. Tso (Hildesheim), L. Marinho
(Hildesheim) and the student support team for their hard work in the preparation
Preface VII
of this conference, for the support during the event and the post-processing of the
conference.
The GfKl Conference 2007 would not have been possible in the way it took place
without the financial and/or material support of the following institutions and com-
panies (in alphabetical order): Albert-Ludwigs-University Freiburg – Faculty of Ap-
plied Sciences, Gesellschaft für Klassifikation e.V., Microsoft München and Springer
Verlag. We express our gratitude to all of them. Finally, we would like to thank Dr.
Martina Bihn from Springer Verlag, Heidelberg, for her support and dedication to
the production of this volume.
Hildesheim, Freiburg and Bielefeld, February 2008 Christine Preisach
Hans Burkhardt
Lars Schmidt-Thieme
Reinhold Decker
Contents
Part I Classification
Distance-based Kernels for Real-valued Data
Lluís Belanche, Jean Luis Vázquez, Miguel Vázquez 3
Fast Support Vector Machine Classification of Very Large Datasets
Janis Fehr, Karina Zapién Arreola, Hans Burkhardt 11
Fusion of Multiple Statistical Classifiers
Eugeniusz Gatnar 19
Calibrating Margin–based Classifier Scores into Polychotomous
Probabilities
Martin Gebel, Claus Weihs 29
Classification with Invariant Distance Substitution Kernels
Bernard Haasdonk, Hans Burkhardt 37
Applying the Kohonen Self-organizing Map Networks to Select Variables
Kamila Migdađ Najman, Krzysztof Najman 45
Computer Assisted Classification of Brain Tumors
Norbert Röhrl, José R. Iglesias-Rozas, Galia Weidl 55
Model Selection in Mixture Regression Analysis – A Monte Carlo
Simulation Study
Marko Sarstedt, Manfred Schwaiger 61
Comparison of Local Classification Methods
Julia Schiffner, Claus Weihs 69
Incorporating Domain Specific Information into Gaia Source
Classification
Kester W. Smith, Carola Tiede, Coryn A.L. Bailer-Jones 77
X Contents
Identification of Noisy Variables for Nonmetric and Symbolic Data in
Cluster Analysis
Marek Walesiak, Andrzej Dudek 85
Part II Clustering
Families of Dendrograms
Patrick Erik Bradley 95
Mixture Models in Forward Search Methods for Outlier Detection
Daniela G. Calò 103
On Multiple Imputation Through Finite Gaussian Mixture Models
Marco Di Zio, Ugo Guarnera 111
Mixture Model Based Group Inference in Fused Genotype and
Phenotype Data
Benjamin Georgi, M.Anne Spence, Pamela Flodman , Alexander Schliep 119
The Noise Component in Model-based Cluster Analysis
Christian Hennig, Pietro Coretto 127
An Artificial Life Approach for Semi-supervised Learning
Lutz Herrmann, Alfred Ultsch 139
Hard and Soft Euclidean Consensus Partitions
Kurt Hornik, Walter Böhm 147
Rationale Models for Conceptual Modeling
Sina Lehrmann, Werner Esswein 155
Measures of Dispersion and Cluster-Trees for Categorical Data
Ulrich Müller-Funk 163
Information Integration of Partially Labeled Data
Steffen Rendle, Lars Schmidt-Thieme 171
Contents XI
Part III Multidimensional Data Analysis
Data Mining of an On-line Survey - A Market Research Application
Karmele Fernández-Aguirre, María I. Landaluce, Ana Martín, Juan I.
Modroño 183
Nonlinear Constrained Principal Component Analysis in the Quality
Control Framework
Michele Gallo, Luigi D’Ambra 193
Non Parametric Control Chart by Multivariate Additive Partial Least
Squares via Spline
Rosaria Lombardo, Amalia Vanacore, Jean-Francçois Durand 201
Simple Non Symmetrical Correspondence Analysis
Antonello D’Ambra, Pietro Amenta, Valentin Rousson 209
Factorial Analysis of a Set of Contingency Tables
Amaya Zárraga, Beatriz Goitisolo 219
Part IV Analysis of Complex Data
Graph Mining: Repository vs. Canonical Form
Christian Borgelt and Mathias Fiedler 229
Classification and Retrieval of Ancient Watermarks
Gerd Brunner, Hans Burkhardt 237
Segmentation and Classification of Hyper-Spectral Skin Data
Hannes Kazianka, Raimund Leitner, Jürgen Pilz 245
FSMTree: An Efficient Algorithm for Mining Frequent Temporal
Patterns
Steffen Kempe, Jochen Hipp, Rudolf Kruse 253
A Matlab Toolbox for Music Information Retrieval
Olivier Lartillot, Petri Toiviainen, Tuomas Eerola 261
A Probabilistic Relational Model for Characterizing Situations in
Dynamic Multi-Agent Systems
Daniel Meyer-Delius, Christian Plagemann, Georg von Wichert, Wendelin
Feiten, Gisbert Lawitzky, Wolfram Burgard 269
Applying the Q
n
Estimator Online
Robin Nunkesser, Karen Schettlinger, Roland Fried 277
XII Contents
A Comparative Study on Polyphonic Musical Time Series Using MCMC
Methods
Katrin Sommer, Claus Weihs 285
Collective Classification for Labeling of Places and Objects in 2D and 3D
Range Data
Rudolph Triebel, Óscar Martínez Mozos, Wolfram Burgard 293
Lag or Error? - Detecting the Nature of Spatial Correlation
Mario Larch, Janette Walde 301
Part V Exploratory Data Analysis and Tools for Data Analysis
Urban Data Mining Using Emergent SOM
Martin Behnisch, Alfred Ultsch 311
KNIME: The Konstanz Information Miner
Michael R. Berthold, Nicolas Cebron, Fabian Dill, Thomas R. Gabriel,
Tobias Kötter, Thorsten Meinl, Peter Ohl, Christoph Sieb, Kilian Thiel, Bernd
Wiswedel 319
A Pattern Based Data Mining Approach
Boris Delibaši´c, Kathrin Kirchner, Johannes Ruhland 327
A Framework for Statistical Entity Identification in
R
Michaela Denk 335
Combining Several SOM Approaches in Data Mining: Application to
ADSL Customer Behaviours Analysis
Francoise Fessant, Vincent Lemaire, Fabrice Clérot 343
On the Analysis of Irregular Stock Market Trading Behavior
Markus Franke, Bettina Hoser, Jan Schröder 355
A Procedure to Estimate Relations in a Balanced Scorecard
Veit Köppen, Henner Graubitz, Hans-K. Arndt, Hans-J. Lenz 363
The Application of Taxonomies in the Context of Configurative Reference
Modelling
Ralf Knackstedt, Armin Stein 373
Two-Dimensional Centrality of a Social Network
Akinori Okada 381
Benchmarking Open-Source Tree Learners in
R/RWeka
Michael Schauerhuber, Achim Zeileis, David Meyer, Kurt Hornik 389
Contents XIII
From Spelling Correction to Text Cleaning – Using Context Information
Martin Schierle, Sascha Schulz, Markus Ackermann 397
Root Cause Analysis for Quality Management
Christian Manuel Strobel, Tomas Hrycej 405
Finding New Technological Ideas and Inventions with Text Mining and
Technique Philosophy
Dirk Thorleuchter 413
Investigating Classifier Learning Behavior with Experiment Databases
Joaquin Vanschoren, Hendrik Blockeel 421
Part VI Marketing and Management Science
Conjoint Analysis for Complex Services Using Clusterwise Hierarchical
Bayes Procedures
Michael Brusch, Daniel Baier 431
Building an Association Rules Framework for Target Marketing
Nicolas March, Thomas Reutterer 439
AHP versus ACA – An Empirical Comparison
Martin Meißner, Sören W. Scholz, Reinhold Decker 447
On the Properties of the Rank Based Multivariate Exponentially
Weighted Moving Average Control Charts
Amor Messaoud, Claus Weihs 455
Are Critical Incidents Really Critical for a Customer Relationship? A
MIMIC Approach
Marcel Paulssen, Angela Sommerfeld 463
Heterogeneity in the Satisfaction-Retention Relationship – A
Finite-mixture Approach
Dorian Quint, Marcel Paulssen 471
An Early-Warning System to Support Activities in the Management of
Customer Equity and How to Obtain the Most from Spatial Customer
Equity Potentials
Klaus Thiel, Daniel Probst 479
Classifying Contemporary Marketing Practices
Ralf Wagner 489
XIV Contents
Part VII Banking and Finance
Predicting Stock Returns with Bayesian Vector Autoregressive Models
Wolfgang Bessler, Peter Lückoff 499
The Evaluation of Venture-Backed IPOs – Certification Model versus
Adverse Selection Model, Which Does Fit Better?
Francesco Gangi, Rosaria Lombardo 507
Using Multiple SVM Models for Unbalanced Credit Scoring Data Sets
Klaus B. Schebesch, Ralf Stecking 515
Part VIII Business Intelligence
Comparison of Recommender System Algorithms Focusing on the
New-item and User-bias Problem
Stefan Hauger, Karen H. L. Tso, Lars Schmidt-Thieme 525
Collaborative Tag Recommendations
Leandro Balby Marinho and Lars Schmidt-Thieme 533
Applying Small Sample Test Statistics for Behavior-based
Recommendations
Andreas W. Neumann, Andreas Geyer-Schulz 541
Part IX Text Mining, Web Mining, and the Semantic Web
Classifying Number Expressions in German Corpora
Irene Cramer, Stefan Schacht, Andreas Merkel 553
Non-Profit Web Portals - Usage Based Benchmarking for Success
Evaluation
Daniel Deli´c, Hans-J. Lenz 561
Text Mining of Supreme Administrative Court Jurisdictions
Ingo Feinerer, Kurt Hornik 569
Supporting Web-based Address Extraction with Unsupervised Tagging
Berenike Loos, Chris Biemann 577
A Two-Stage Approach for Context-Dependent Hypernym Extraction
Berenike Loos, Mario DiMarzo 585
Analysis of Dwell Times in Web Usage Mining
Patrick Mair, Marcus Hudec 593
Contents XV
New Issues in Near-duplicate Detection
Martin Potthast, Benno Stein 601
Comparing the University of South Florida Homograph Norms with
Empirical Corpus Data
Reinhard Rapp 611
Content-based Dimensionality Reduction for Recommender Systems
Panagiotis Symeonidis 619
Part X Linguistics
The Distribution of Data in Word Lists and its Impact on the
Subgrouping of Languages
Hans J. Holm 629
Quantitative Text Analysis Using L-, F- and T-Segments
Reinhard Köhler, Sven Naumann 637
Projecting Dialect Distances to Geography: Bootstrap Clustering vs.
Noisy Clustering
John Nerbonne, Peter Kleiweg, Wilbert Heeringa, Franz Manni 647
Structural Differentiae of Text Types – A Quantitative Model
Olga Pustylnikov, Alexander Mehler 655
Part XI Data Analysis in Humanities
Scenario Evaluation Using Two-mode Clustering Approaches in Higher
Education
Matthias J. Kaiser, Daniel Baier 665
Visualization and Clustering of Tagged Music Data
Pascal Lehwark, Sebastian Risi, Alfred Ultsch 673
Effects of Data Transformation on Cluster Analysis of Archaeometric
Data
Hans-Joachim Mucha, Hans-Georg Bartel, Jens Dolata 681
Fuzzy PLS Path Modeling: A New Tool For Handling Sensory Data
Francesco Palumbo, Rosaria Romano, Vincenzo Esposito Vinzi 689
Automatic Analysis of Dewey Decimal Classification Notations
Ulrike Reiner 697
XVI Contents
A New Interval Data Distance Based on the Wasserstein Metric
Rosanna Verde, Antonio Irpino 705
Keywords 713
Author Index 717
Applying the Kohonen Self-organizing Map Networks
to Select Variables
Kamila Migdađ Najman and Krzysztof Najman
University of Gda
´
nsk, Poland
Abstract. The problem of selection of variables seems to be the key issue in classification of
multi-dimensional objects. An optimal set of features should be made of only those variables,
which are essential for the differentiation of studied objects. This selection may be made easier
if a graphic analysis of an U-matrix is carried out. It allows to easily identify variables, which
do not differentiate the studied objects. A graphic analysis may, however, not suffice to analyse
data when an object is described with hundreds of variables. The authors of the paper propose
a procedure which allows to eliminate variables with the smallest discriminating potential
based on the measurement of concentration of objects on the Kohonen self organising map
networks.
1 Introduction
An intensive development of computer technologies in recent years lead i.a. to an
enormous increase in the size of available databases. The question refers not only to
an increase in the number of recorded cases. An essential, qualitative change is the
increase of the number of variables describing a particular case. There are databases
where one object is described by over 2000 attributes. Such a great number of vari-
ables meaningfully changes the scale of problems connected with the analysis of
such databases. It results, inter alia, in problems of separation of the group structure
of studied objects. According to i.a. Milligan (1994, 1996, p. 348) the approach fre-
quently applied by the creators of databases who strive to describe the objects with
the possibly large number of variables is not only unnecessary but essentially erro-
neous. Adding several irrelevant variables to the set of studied variables may limit or
even eliminate the possibility of discovering the group structure of studied objects.
In the set of variables only such variables should be included, which (cf: Gordon
1999, p. 3), contribute to:
• an increase in the homogeneity of separate clusters,
• an increase in the heterogeneity among clusters,
• easier interpretation of features of clusters which were set apart.
46 Kamila Migdađ Najman and Krzysztof Najman
The reduction of the space of variables would also contribute to a considerable re-
duction of time of analyses and to apply much more refined, but at the same time
more sophisticated and time consuming methods of data analysis.
The problem of reduction of the set of variables is extremely important while
solving the classification problems. That is why a considerable attention was de-
voted to it in literature (cf.: Gnanadieskian, Kettenring, Tsao, 1995). It is possible to
distinguish three approaches to the development of an optimal set of variables:
1. weighing the variables – where each variable is given a weight which is related
to its relative importance in description of the studied problem,
2. selection of variables – consisting in the elimination of variables with the small-
est discriminating potential from the set of variables; this approach may be con-
sidered as a special case of the first approach where some variables are assigned
the weight of 0 – in the case of rejected variables and the weight of 1 in the case
of selected variables,
3. replacement of the original variables with artificial variables – this is a classical
statistical approach based on the analysis of principal components.
In the present paper a method of selecting variables based on the neural SOM net-
work belonging to the second of the above types of methods will be presented.
2 A proposition to reduce the number of variables
The Kohonen SOM network is a very attractive method of classifying multidimen-
sional data. As shown by Deboeck G. and Kohonen T. (1998) it is an efficient method
of sorting out complex data. It is also an excellent method of visualisation of multi-
dimensional data, examples supporting this supposition may be found in Vesanto J.
(1997). One of important properties of the SOM network is the possibility of visuali-
sation of shares of particular variables in a matrix of unified distances (an U-matrix).
Joint activation of particular neurons of the network is the sum of activations result-
ing from activation of particular variables. Since those components may be recorded
in a separate data vector, they may be analysed independently from one another.
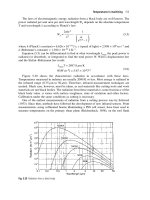
Let us consider two simple examples. Figure 2 shows a set of 200 objects de-
scribed with 2 variables. It is possible to identify a clear structure of 4 clusters, each
made of 50 objects. The combination of both variables clearly differentiates the clus-
ters.
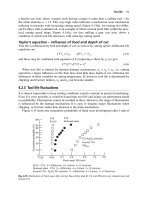
A SOM network was built for the above dataset with a hexagonal structure, with
a dimension of 17x17 neurons with a Gaussian neighbour function. The visualisation
of the matrix of unified distances (the U-matrix) is shown in Fig. 2. The colour of
particular segments indicates the distance, in which a given neuron is located in
relation to its neighbours. Since some neurons identify the studied objects, this colour
shows at the same time the distances between objects in the space of features. The
“wall” of higher distances is clearly visible. Large distances separate objects which
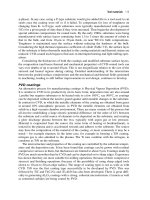
create clear clusters (concentrations). The share of both variables in the matrix of
unified distances (U-matrix) is presented in Fig. 2. It can be clearly observed, that
Kohonen Self-Organizing Map Networks to Select Variables 47
3 4 5 6 7 8 9 10 11 12
3
4
5
6
7
8
9
10
11
OBJECTS
Variable 1
Vari able 2
Fig. 1. An exemplary dataset - set 1
variables 1 and 2 separate the set of objects, each variable dividing the set into two
parts. Both parts of the graph indicate extreme distances between objects located
there. This observation allows to say, that both variables are characterised with a
similar potential of discrimination of the studied objects. Since the boundary between
both parts is so “acute” it may be considered, that both variables have a considerable
potential to discriminate the studied objects.
U-mat r ix
24
35
18
41
6
26
33
8
30
61
54
100
76
60
99
62
55
71
22
14
27
12
20
46
77
92
64
63
89
73
78
17
39
16
11
21
3
50
44
67
86
66
59
85
32
34
49
38
31
97
95
98
65
87
88
53
93
56
28
36
19
10
45
5
25
96
84
90
1
42
2
9
4
47
48
79
51
57
81
91
75
94
40
15
7
112
74
68
82
83
69
72
80
29
37
43
52
192
13
23
114
110
115
170
156
58
70
152
190
111
148
128
159
151
169
184
186
124
106
117
133
119
102
142
123
141
194
155
178
120
136
105
118
162
167
196
172
187
165
157
164
104
146
113
135
127
153
198
168
173
185
163
188
176
183
195
171
144
131
150
103
147
149
129
175
193
200
177
182
122
116
107
126
130
138
160
179
189
154
101
108
140
197
166
174
125
145
121
137
143
109
134
132
139
158
199
181
161
191
180
0
0.368
0.737
Fig. 2. The matrix of unified distances for the dataset 1
48 Kamila Migdađ Najman and Krzysztof Najman
Vari able1
24
35
18
41
6
26
33
8
30
61
54
100
76
60
99
62
55
71
22
14
27
12
20
46
77
92
64
63
89
73
78
17
39
16
11
21
3
50
44
67
86
66
59
85
32
34
49
38
31
97
95
98
65
87
88
53
93
56
28
36
19
10
45
5
25
96
84
90
1
42
2
9
4
47
48
79
51
57
81
91
75
94
40
15
7
112
74
68
82
83
69
72
80
29
37
43
52
192
13
23
114
110
115
170
156
58
70
152
190
111
148
128
159
151
169
184
186
124
106
117
133
119
102
142
123
141
194
155
178
120
136
105
118
162
167
196
172
187
165
157
164
104
146
113
135
127
153
198
168
173
185
163
188
176
183
195
171
144
131
150
103
147
149
129
175
193
200
177
182
122
116
107
126
130
138
160
179
189
154
101
108
140
197
166
174
125
145
121
137
143
109
134
132
139
158
199
181
161
191
180
n
0.1
0.2
0.3
0.4
0.5
0.6
0.7
0.8
0.9
(a)
Vari able2
24
35
18
41
6
26
33
8
30
61
54
100
76
60
99
62
55
71
22
14
27
12
20
46
77
92
64
63
89
73
78
17
39
16
11
21
3
50
44
67
86
66
59
85
32
34
49
38
31
97
95
98
65
87
88
53
93
56
28
36
19
10
45
5
25
96
84
90
1
42
2
9
4
47
48
79
51
57
81
91
75
94
40
15
7
112
74
68
82
83
69
72
80
29
37
43
52
192
13
23
114
110
115
170
156
58
70
152
190
111
148
128
159
151
169
184
186
124
106
117
133
119
102
142
123
141
194
155
178
120
136
105
118
162
167
196
172
187
165
157
164
104
146
113
135
127
153
198
168
173
185
163
188
176
183
195
171
144
131
150
103
147
149
129
175
193
200
177
182
122
116
107
126
130
138
160
179
189
154
101
108
140
197
166
174
125
145
121
137
143
109
134
132
139
158
199
181
161
191
180
n
0.1
0.2
0.3
0.4
0.5
0.6
0.7
0.8
0.9
(b)
Fig. 3. The share of variable 1 and 2 in the matrix of unified distances (U-matrix) - dataset 1
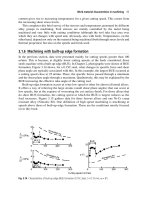
The situation is different in the second case. Like in the former case we observe
200 objects described with two variables, belonging to 4 clusters. The first vari-
able allows to easily classify objects into 4 clusters. The variable 2 does not have,
however, such potential, since the clusters are non-separable in relation to it. Fig. 2
presents the objects, while Fig. 2 shows the share of particular variables in the matrix
of unified distances (the U-matrix) based on the SOM network.
The analysis of distance between objects with the use of the two selected vari-
ables suggests, that variable 1 discriminates the objects very well. The borders be-
tween clusters are clear and easily discernible. It may be said that variable 1 has a
great discriminating potential. Variable 2 has, however, much worse properties. It is
not possible to identify clear clusters. Objects are rather uniformly distributed over
the SOM network. We can say that variable 2 does not have the discriminating po-
tential.
The application of the above procedure to assess the discriminating potential of
variables is also highly efficient in more complicated cases and may be successfully
applied in practice.
Its essential weakness is the fact, that for a large number of variables it becomes
time consuming and inefficient. A certain way to circumvent that weakness, if the
number of variables does not exceed several hundred, is to apply a preliminary group-
ing of variables. Very often, in socio-economic research, there are many variables
which are differently and to a different extent correlated with one another. If we
preliminarily distinguish the clusters of variables of similar properties, it will be pos-
sible to eliminate the variables with the smallest discriminating potential from each
cluster of variables. Each cluster of variables is analysed independently, what makes
the analysis easier. An exceptionally efficient method of classification of variables is
the SOM network which has a topology of a chain. In Figure 2 the SOM network
is shown, which classifies 58 economic and social variables describing 307 Polish
poviats (smallest territorial administration units in Poland) in 2004.
In particular clusters of variables their number is much smaller than in the entire
dataset and it is much easier to eliminate those variables with the smallest discrim-
inating potential. At the same time this procedure does not allow to eliminate all
Kohonen Self-Organizing Map Networks to Select Variables 49
10 20 30 40 50 60 70 80 90
-30
-20
-10
0
10
20
30
40
50
OBJECTS
Vari able 1
Variable 2
Fig. 4. An exemplary dataset - set no. 2
Vari able1
14
4
42
32
8
44
46
2
24
38
9
11
20
16
15
6
21
50
13
30
27
49
1
5
29
28
34
7
35
22
3
31
37
48
12
26
39
10
45
17
23
25
75
98
18
43
36
33
19
47
90
70
82
71
41
40
57
78
94
84
58
88
79
59
55
51
91
73
85
64
61
65
62
80
96
89
83
95
100
63
54
74
92
53
72
87
76
93
97
66
81
69
67
99
113
68
86
56
60
77
52
139
134
130
103
138
109
140
143
114
124
137
127
126
133
107
104
131
146
108
135
144
111
117
136
105
142
132
115
121
147
150
101
145
110
122
125
102
141
106
148
120
116
119
129
128
155
112
118
123
149
172
177
169
167
159
178
164
198
160
157
184
163
176
199
171
182
162
195
158
196
152
170
181
166
189
153
186
175
197
190
179
192
156
165
191
185
188
194
174
151
154
180
200
168
173
187
161
193
183
n
0
0. 1
0. 2
0. 3
0. 4
0. 5
0. 6
0. 7
0. 8
0. 9
(a)
Vari able2
14
4
42
32
8
44
46
2
24
38
9
11
20
16
15
6
21
50
13
30
27
49
1
5
29
28
34
7
35
22
3
31
37
48
12
26
39
10
45
17
23
25
75
98
18
43
36
33
19
47
90
70
82
71
41
40
57
78
94
84
58
88
79
59
55
51
91
73
85
64
61
65
62
80
96
89
83
95
100
63
54
74
92
53
72
87
76
93
97
66
81
69
67
99
113
68
86
56
60
77
52
139
134
130
103
138
109
140
143
114
124
137
127
126
133
107
104
131
146
108
135
144
111
117
136
105
142
132
115
121
147
150
101
145
110
122
125
102
141
106
148
120
116
119
129
128
155
112
118
123
149
172
177
169
167
159
178
164
198
160
157
184
163
176
199
171
182
162
195
158
196
152
170
181
166
189
153
186
175
197
190
179
192
156
165
191
185
188
194
174
151
154
180
200
168
173
187
161
193
183
n
0
0.1
0.2
0.3
0.4
0.5
0.6
0.7
0.8
0.9
1
(b)
Fig. 5. The share of variable 1 and 2 in a matrix of unified distances - dataset 2
variables with similar properties, because they are located in one, not empty cluster.
Quite frequently, because of certain factual reasons we would like to retain some
variables, or prefer to retain at least one variable for each cluster.
For a great number of variables, above 100, a solely graphic analysis of discrim-
inating potential of variables would be inefficient. Thus it seems justified to look for
an analytical method of assessment of the discriminating potential of variables based
on the SOM network and the above observations.
One of the possible solutions results from the observation of the location of ob-
jects on the map of unified distances for variables. It can be observed, that the vari-
ables with a great discriminating potential are characterised with a higher object con-
centration on the map than the variables with a small potential. The variables with
a small discriminating potential are to an important extent rather uniformly located
50 Kamila Migdađ Najman and Krzysztof Najman
U-mat r ix
3
4
5
6
7
9
42
43
44
45
54
12
13
14
18
20
27
30
33
41
55
56
11
38
46
52
1
25
39
40
48
49
51
57
82
24
28
32
35
36
50
34
10
37
58 47 23 29 21 26 19 17 31 16 15 22 53
0
26.5
53.1
Fig. 6. The share of variable 1 and 2 in a matrix of unified distances (an U-matrix)
on the map. On the basis of this observation we propose to apply the concentration
indices on the SOM map in the assessment of discriminating potential of variables.
In the presented study we tested the two known concentration indices. The first one
is the concentration index based on entropy:
K
e
= 1−
H
log
2
(n)
(1)
where:
H =
n
i=1
(p
i
log
2
(
1
p
i
)) (2)
The second of proposed indices is the classical Gini concentration index:
K =
1
100n
[
n
i=1
(i −1)p
cum
i
−
n
i=2
ip
cum
i−1
] (3)
Both indices were written in the form appropriate for individual data. It seems
that higher values of those coefficients should suggest variables with a greater dis-
criminating potential.
3 Applications and results
As a result of application of the proposed indices in the first example, the values
recorded in Table 1 were received (SOM network the same like in Fig 2).
The value of discriminating potential was initially assessed as high for both vari-
ables. The values of concentration coefficients for both variables were also similar
1
.
1
It is worth to note, that the value of coefficients is of no relevance here. The differences
between values of particular variables are more important.
Kohonen Self-Organizing Map Networks to Select Variables 51
Table 1. Values of concentration coefficients for set 1.
Variable K
e
Gini
1 0.0412 0.3612
2
0.0381 0.3438
The values of indices for variables from the second example are given in Table
2 (SOM network the same like in Fig 2). As it is possible to observe, the second
variable is characterised with much smaller values of concentration coefficients than
the first variable.
Table 2. Values of concentration coefficients for set 2.
Variable K
e
Gini
1 0.0411 0.3568
2
0.0145 0.2264
It is compatible with observations based on graphic analysis, since the discrimi-
nating potential of the first variable was assessed as high, while the potential of the
second variable was assessed as low. The procedure of elimination of variables of
a low discriminating potential may be connected with a procedure of classification
of variables. Thus a situation may be prevented, where all variables of a given type
would be eliminated, if they were located in one cluster of variables only. Such prop-
erty will be desirable in many cases. A full procedure of elimination of variables is
presented in Fig. 3. It is a procedure consisting in several stages. In the first stage
the SOM network is built on the basis of all variables. Then the values of concentra-
tion coefficients are determined. In the second stage variables are classified on the
basis of the SOM network with a chain topology. Then, variables with the smallest
value of concentration coefficient are eliminated from each cluster of variables. In
the third stage a new SOM network is built for a reduced set of variables. In order
to assess, whether the elimination of particular variables leads to an improvement
in the resulting group structure, the value of one index of the quality of classifica-
tion should be identified. Among the better known ones it is possible to mention the
Calinski-Harabasz, Davies-Bouldin
2
, and Silhouette
3
indices. In the quoted research
the value of the Silhouette index was determined. Apart from its properties that allow
for a good assessment of the group structure of objects, this index allows to visualise
the belonging of objects to particular clusters, what is compatible with the idea of
studies based on graphic analysis proposed here. This procedure is repeated until the
number of variables in a cluster of variables is not smaller than a certain number
2
Compare: Milligan G.W., Cooper M.C. (1985), An examination of procedures for deter-
mining the number of clusters in data set. Psychometrika, 50(2), p. 159-179.
3
Rousseeuw P.J. (1987), Silhouettes: a graphical aid to the interpretation and validation of
cluster analysis. J. Comput. Appl. Math. 20, p. 53-65.
52 Kamila Migdađ Najman and Krzysztof Najman
determined in advance and the value of the Silhouette index increases. The appli-
cation of the above procedure (compare Fig. 3) for the determination of an optimal
set of variables in the description of Polish poviats is presented in Table 3. In the
presented analysis the reduction of variables was carried out on the basis of the Ke
concentration coefficient since it manifested several times higher differentiation of
particular variables than the Gini coefficient. The value of the Silhouette index for
the classification of poviats on the basis of all variables adopts the value of -0.07.
It suggests, that the group structure is completely false. Elimination of the variable
no. 24
4
clearly improves the group structure. In the subsequent iterations subsequent
variables are systematically eliminated, increasing the value of the Silhouette index.
After six iterations the highest value of the Silhouette index is achieved and the
elimination of further variables does not result in an improvement of the resulting
cluster structure. The cluster structure obtained after the reduction of 14 variables is
not very strong, but it is meaningfully better than the one resulting from the consid-
eration of all variables. The resulting classification of poviats is factually justified, it
is possible then to well interpret the clusters
5
.
Table 3. Values of the Silhouette index after the reduction of variables
Step Removed Variables Global Silhouette Index
0 all var. -0.07
1
24 0.10
2
36 0.11
3
18, 43 0.11
4
1, 2, 3, 6 0.13
5
3, 15, 26, 39 0.28
6
4, 17 0.39
7
5, 20, 23 0.38
4 Conclusions
The proposed method of selection of variables has numerous advantages. It is a fully
automatic procedure, compatible with the Data Mining philosophy of analyses. Sub-
stantial empirical experience of the authors suggest, that it leads towards a consider-
able improvement in the obtained group structure in comparison with the analysis of
the whole data set. It is more efficient the greater is the number of variables studied.
4
After each iteration the variables are renumbered anew, that is why in subsequent iterations
the same numbers of variables may appear.
5
Compare: Migdađ Najman K., Najman K. (2003), Zastosowanie sieci neuronowej typu
SOM w badaniu przestrzennego zró
˙
znicowania powiatów (Application of the SOM neural
network in studies of spatial differentiation of poviats), Wiadomo
´
sci Statystyczne, 4/2003,
p. 72-85
Kohonen Self-Organizing Map Networks to Select Variables 53
THE NUMBER OF
VARIABLES IN CLUSTER
> P
THE SOM FOR VARIABLES
CLUSTERING VARIABLES
FROM EACH CLUSTER REMOVE
VARIABLE WHICH HAS THE SMALLEST
Ke, K
THE SOM
FOR OBJECTS
CLUSTERING OBJECTS
ESTIMATE OF GOODNESS OF
CLUSTERING
HAS CLUSTERING
QUALITY INCREASE ?
DOCUMENTATION
YES
YES
NO
DATA
BASE
THE SOM
FOR OBJECTS
CALCULATE
Ke, K
CALCULATE
Ke, K
Fig. 7. Procedure of determination of an optimal set of variables
This procedure may be also applied together with other methods of data classifica-
tion as a preprocessor. It is also possible to apply other measures of discriminating
potential than the concentration coefficients. It is also possible to use the measures
based on the distance between objects on the SOM map.
The proposed method is, however, not devoid of flaws. Its application should be
preceded with a subjective determination of a minimum number of variables in a
single cluster of variables. There are no factual indications, how great that number
should be. This method is also very sensitive to the quality of the SOM network