- Trang chủ >>
- Khoa Học Tự Nhiên >>
- Vật lý
Short-Wave Solar Radiation in the Earth’s Atmosphere Part 9 pot
Bạn đang xem bản rút gọn của tài liệu. Xem và tải ngay bản đầy đủ của tài liệu tại đây (620.28 KB, 32 trang )
246 Analysis of Radiative Observations in Cloudy Atmosphere
Fig. 7.7a,b. Spectral dependence of single scattering co-albedo 1 – ω
0
retrievedfromthe
ground observation data: a in Arctic, 1979and b in St. Petersburg suburb (city Petrodvorets),
1996
Fig. 7.8. Spectral dependence of optical thickness τ
0
retrieved from the data of the ground
observations in Arctic: experiment 11 – 13 August 1979 and experiment 12 – 08 October
1979
7.3.2
Data Processing of Satellite Observations
Optical thickness
τ
0
and single scattering co-albedo 1 −ω
0
for extended clouds
were obtained with inverse asymptotic formulas [(6.13), (6.28)]. The approx-
imate accounting of the horizontal inhomogeneity including the scattering of
radiation by the upper atmospheric layers was accomplished with (6.36) and
(6.39). Multidirectional reflected radiance measurements with the POLDER
Optical Parameters from Ground and Satellite Observations 247
instrument were processed for the retrieval of cloud optical parameters. The
pixels with the cloud amount exceeding 0.5 were only considered.
The follow ing sequence of the procedures for every pixel is proposed for
processing POLDER data:
1. At the first step the angular dependent functions are calculated.
2. The next step includes the calculation of the approximate optical thick-
ness for every viewing direction with the simple formula, assuming
theconservativescattering.Theobtainedvaluesshowthedegreeofthe
shadowinginfluence(ortheinfluenceofthecloudtopdeviationfrom
theplane)andgivethepossibilitytoevaluateparameterr with (6.39).
Besides, they allow choosing the pairs of viewing directions where the
optical thickness is approximately equal.
3. Thethirdstageconsistsoftheparameters
2
retrieval from the radiances at
each pair of viewing directions with the equal optical thickness [(6.13)].
If the optical thickness defined at the previous stage without accounting
of the absorption is more than 100, parameter s
2
is obtained according
to (6.16). Then the averaging over all pairs of the viewing directions is
accomplished, and the relative mean square deviation is estimated.
4. At the fourth stage optical thickness
τ
0
is calculated for every viewing
direction, assuming the true absorption, and the results are averaged.
5. Then, the similar procedure is repeated for every available wavelength.
6. At the sixth stage the res ults are prepared for mapping (inserting the
missed pixels; inserting the values averaged over the neighbor pixels
to the missed pixels or to the pixels with only one viewing directio n;
rejecting the edge pixels). The uncertainties are calculated for every
pixel using the formulas similar to (6.46).
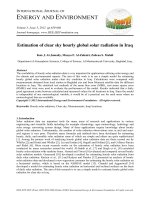
7. Finally, the images of the single scattering co-albedo and optical thick-
ness are figured with the GRADS editor. The space distribution of single
scattering co-albedo (1 −
ω
0
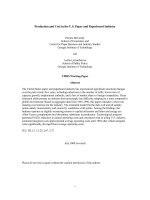
) is shown in Fig. 7.9, optical thickness τ
0
is shown in Fig. 7.10 (Melnikova and Nakajima 2000a,b). The values of
(1 −
ω
0
) are in the range 0.001–0.010; the optical thickness is about
15–25 and can reach 100 in the Tropics. Black gaps in the images cor-
respond to the pixels with the cloud amount less than 0.5. Four images
are presented in Figs. 7.9 and 7.10, the upper picture join three images
registered during the successive satellite pass with time interval about
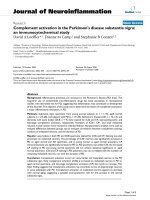
one hour (i.e. these images are presenting one cloud field). Figure 7.11
demonstrates the values of (a) – single scattering co-albedo (1 −
ω
0
),
and (b) – optical thickness
τ
0
and shadow parameter r multiplied by 10
2
in three spectral channels ver sus pixel numbers. The latter turns not to
depend on wavelength, and in con trast the spectral dependence of the
optical thickness decreases with wavelength for all (!) processed pixels.
Please remember that the processing has been accomplished for every
wavelength independently. The size of every pixel is about 60 km.
248 Analysis of Radiative Observations in Cloudy Atmosphere
Fig. 7.9. Images of single scattering co-albedo (1 − ω
0
) of the cloud pixels, retrieved from
POLDER data
Fig. 7.10. Images of optical thickness τ
0
ofthecloudpixels,retrievedfromPOLDERdata
General Analysis of Retrieved Parameters of Stratus Cloudiness 249
Fig. 7.11a,b. Cloud optical parameters versus pixel numbers: a – single scattering co-albedo
(1−ω
0
), and b – optical thickness τ
0
(solid line)andshadowparameterr×10
2
(dashed line)
for three wavelength channels 443 nm – black line; 670 nm – red line; 865 nm –blueline;1–
latitude 58.75
◦
N and longitude 23
◦
W–75
◦
; 2 – latitude 44.75
◦
N and longitude 24
◦
W–30
◦
E;
3 – latitude 8.75
◦
N and longitude 120
◦
E–140
◦
E
7.4
General Analysis of Retrieved Parameters of Stratus Cloudiness
7.4.1
Single Scattering Albedo and Volume Absorption Coefficient
Molecular absorption bands are apparent in the figures illustrating the spectral
dependence of single scattering co-albedo (1 −
ω
0
)buttheyareexpressed
differently in different cloud layers. The molecular band at wavelength 0.42
µ
appears in experiments 1, 2 and 4. I t can be identified as an absorption by
hematite (see Sect. 3.3, Fig. 3.14 and studies by Ivlev and Andreev 1986 and
Sokolic and Toon 1999) contained in flue sand escapes from the Kara-Kum
and Sahara deserts. One can see the weak bands of the aerosol absorption at
wavelengths around 0.5 and 0.8
µm in the curves obtained from the data of
experiments 3 and 4, accomplished above the sea surface. I t could be attributed
250 Analysis of Radiative Observations in Cloudy Atmosphere
to sea salt (namely to NaCl) content in the atmospheric aerosols according to
the study by Ivlev and Andreev (1986).
The atmosphere in the Arctic regions is purer – the conservative scatter-
ing becomes apparent within a large range of wavelength (Fig. 7.2d, experi-
men t 11). Spectral values (1–
ω
0
) retrieved from airborne experiments 3 and
7 (Fig. 7.2b,c) and from the satellite experiments (certain parts of the curves
in Fig. 7.11, 3) demonstrate a monoton ic increase with wavelength that can
be attributed to organic fuel combustion (Sokolic 1988). The values of single
scattering co-albedo (1–
ω
0
)obtainedfromairborneexperiments1,2and5
and most pixels of the sat ellite images show no spectral dependence, which is
typical for the black carbon and dust aerosols.
Consideration of volume absorption coefficient
κ of the s eparate cloud sub-
layers (Fig. 7.4) indicates strong vertical inhomogeneity. The upper curves in
Fig. 7.4b demonstrate significant absorption by two upper cloud sublayers cor-
responding either to the oxygen and water vapor absorption bands (0.68, 0.72,
0.76
µm) or to the ozone Chappuis molecular absorption band (0.65 µm). Two
lower sublayers show the opposite spectral dependence. It could be explained
with the higher content of ozone in the upper tropospheric layers compared
with the lower ones. The results of exper iment 7 show the monotonic increase
of the absorption coefficient with wavelength in the bottom layer (1.0–1.1 km).
A similar result has been mentioned above for the cloud, considered as a whole
layer.
Inspiteofsignificantuncertaintiesoftheretrievalofvalues(1−
ω
0,i
)and
especially
τ
i
the obtained result demonstrates the r ather real magnitudes and
spectral dependence coinciding with the results of considering the cloud layer
as a whole. Using the spectral dependence of the irradiances promotes dimin-
ishing the uncertainties of the retrieval because the results obtained for the
neighbor wavelengths do not distinguish stro ngly fr om each other. Smoothing
over spectral values out of the absorption bands could be rather effective for
obtaining the real values of the optical parameters.
Several pixels of the satellite images (in Fig. 7.11, 1) are characterized with
magnitude 0.05 for value (1 −
ω
0
). It could be concl uded that the observational
errors increases at the edges of the image, especially for the single pixels with
the strong absorption. However, the other parts consist of several pixels with
the higher absorption and could correspond to the industrial regions with the
increasing content of the soot aerosols. Only some rare pixels above the ocean
are characterized with the conservative scattering of radiation.
7.4.2
Optical Thickness
τ
0
and Volume Scattering Coefficient α
The values of volume scattering coefficient α vary strongly in different exper-
iments. Spectral dependence
α(λ) demonstrates the strong vertical inhomo-
geneity of the cloud, and both the magnitudes and the spectral dependence are
different in different cloud sublayers. It reflects the inhomogeneity of the mi-
crophysical cloud structure. The volume scattering coefficient obtained for the
cloud as a whole coincides with the averaged values obtained for the separate
Influence of Multiple Light Scattering in Clouds on Radiation Absorption 251
sublayers within the uncertainty range. The scattering coefficient is maximal
for the inner sublayers close to the cloud top. The obtained vertical profile of
thevolumescatteringcoefficientissimilartotheairborneresultsaccomplished
in stratus-cumulus cloudiness in the Southern hemisphere (Boers et al. 1996)
and to the results of the FIRE experiment in the Arctic (Curry et al. 2000). The
same values are cited in the book by Mazin and Khrgian (1989) for stratus
clouds. Thus, our results could be assumed to be the quite real ones.
Figure 7.10 illustrates that most pixels are characterized with optical thick-
ness
τ
0
about 10–25, while i n some regions consisting of several pixels the
optical thickness reaches 70–80 and even 100 (in the Tropical latitudes). Space
variation s of the optical thickness seem rather monotonic in images obtained
from the satellite data, and this obstacle points to the low enough uncertainty
of either observatio ns or da ta processing.
The presented results of the retrieval of optical thickness
τ
0
and single scat-
tering albedo
ω
0
fromthe airborne, ground, and satellite radiative observations
demonstrate the similar values and spectral features in spite of using different
observational methods and different formulas. It shows the inverse asymptotic
formulas to be quite suitable for obtaining the cloud optical parameters. The
elaborated method has more advantages comparing with the other methods
(Rosenberg et al. 1974; Asano 1994; Nakajima TY and Nakajima T 1995; Rublev
et al. 1997) because it pr ovides obtaining two parameters for every wavelength
in the shortwave spectral range and for every pixel of the satellite images
independently and with no additional restricting assumptions.
The approximate account of the cloud top inhomogeneity turns out to be
rathereffectiveeither forinverse orfor directproblems.The introducedshadow
parameterturnsouttotakeintoaccounttheupperatmosphericlayersinfluence
together with the uncer tainty of the phase function approximation with the
Henyey-Greenstein function. It will be promising to analyze the results of
similar data processing in the global scale.
It should be mentioned that the more accurate presentation of the phase
function would change the numerical magnitudes of the results because it has
to retrieve the phase function parameter for substituting its real value instead
of the model one to the formulas.
7.5
Influence of Multiple Light Scattering in Clouds on Radiation Absorption
7.5.1
Empirical Formulas for the Estimation
of the Volume Scattering and Absorption
The results discussed in the previous section have common features, namely:
1. magnitudes of the single scattering albedo are lower than the values
calculat ed with Mie theory,
2. and the existence of the spectral dependence of the optical thickness
con tradicted Mie theory r esults.
252 Analysis of Radiative Observations in Cloudy Atmosphere
TheinterpretationoftheUVradiationobservationsinthecloudyskyby(Mayer
et al. 1998) also demonstrates the strong extinction: the cloud optical thickness
in the UV region has been retrieved to be equal to several hundreds.
Mie theory calculations yield volume scattering coefficient
α (and optical
thickness
τ
0
)forensembleoftheparticleswithsize> 5 µm independent of
wavelength in the shortwave region, and the magnitude of the volume absorp-
tion coefficient in the cloud has to be in range 10
−5
–10
−8
(single scattering
albedo
ω
0
is about 0.99999–1.0).
Here we propose a possible explanation of this contradiction. It links with
the multiple scattering within clouds. Qualitatively the similar assumption
has been proposed in the book by Kondratyev and Binenko (1984), while
considering the airborne observational data.
The cloud layer is considered to consist of droplets, sometimes with addi-
tion of aerosols within the droplet. The molecular scattering is accounted for
with summarizing the scattering coefficients and as the molecular scattering
coefficientismuchlower(byafactorof10
3
) than the cloud scattering coef-
ficient, its yield turns out to be negligible. It’s known that the mean number
of the scattering events in the cloud with optical thickness
τ
0
is proportional
to
τ
2
0
owing to the multiple scattering (Minin 1981,1988; Yanovitskij 1997);
forreflectingphotonsitisproportionalto
τ
0
. Thus, the photon path within
the optically thick cloud significantly increases compared to the photon path
within the clear sky, and the number of collisions with air molecules (more
rigorous with fluctuations of the molecular density) increases as well. The
radiation absorption removes the part of photons and weakens the increasing
effect of the molecular sca ttering. Since it is necessary to tak e into account tha t
the cloud layer does not simply superpose to the molecular atmosphere, but
it increases the molecular scattering. We should mention that the increasing
of the molecular absor ption within oxygen absorption band
λ = 0.76 µm due
to the increasing of the photon path within the cloud has been considered in
various studies (Dianov-Klokov et al. 1973; Marshak et al. 1995; Kurosu et al.
1997; Pfeilsticker et al. 1997; Wagner et al. 1998; Pfeilsticker 1999). The same
reasons are also valid for radiation scattering and absorption by the aerosol
particles between droplets.
It is clear that the multiple scattering theory and the radiative transfer equa-
tion takes in to a ccount all processes of scattering and absorption, but it is
right only, if they are accurately put in the model of scattering and absorbing
medium. Usually the averaging values of scattering and absorption coefficients
over the elementar y volume are substituted to the transfer equation and then
the solving is accomplished with one of the radiativ e transfer methods. How-
ever, from the physical point it is incorrect to average the initial parameters
over the elementary volume befo re solving. The incorrectness is intensified
with the essentially different scales of the elementary v olumes for different
particles (molecules, aerosols and droplets), whose sizes distinguish by an or-
der of magnitude and much more (look Sect. 1.2) and the transfer equation
is derived in a phenomenological way for this incorrect elementary volume.
Strictly speaking, the equation of the radiative transfer for the complex multi-
component medium is to be inferred from Maxwell equations accounting all
Influence of Multiple Light Scattering in Clouds on Radiation Absorption 253
its components. However, we don’t aim here to consider the mathematical
aspectoftheproblem,thusweproposetheempiricalapproach,presentedin
several studies (Melnikova 1989, 1997; Kondratyev et al. 1997; Melnikova and
Mikhailov 2000).
Usually the scattering or absorption coefficients of the whole medium are
presented as a sum of the corresponding coefficients of separate components.
Specify the optical parameters relating to the molecular component with M,
relating to the aerosol component with A, and relating to the droplets with D.
Then the usual notation looks like:
α = α
M
+ α
A
+ α
D
,
κ = κ
M
+ κ
A
.
(7.1)
Accounting for the mutual influence of the scattering and absorption by dif-
ferent components, we propose the empirical relations:
α = (α
M
+ α
A
)Cτ
p
D
ω
q
0
+ α
D
,
κ = (κ
M
+ κ
A
)Cτ
p
D
ω
q
0
,
(7.2)
where
ω
0
isthesinglescatteringalbedo,C isthefactorofproportionality,
τ
D
and α
D
are the optical thickness and the volume scattering coefficient
caused only by scattering by droplets (value of
τ
0
in Fig. 7.1 and value of α
in Fig. 7.12a for λ > 0.8 µm), α
M
, α
A
, κ
M
, κ
A
are the values of scattering and
absorption coefficientsof molecules and aerosol particles in theclear sky (
α
M
is
a coefficient of Raleigh scattering) at corresponding wavelength and altitude of
the atmosphere;pand q are the empiric coefficients, estimated inseveral studies
(Melnikova 1989, 1992, 1997; Kondratyev et al. 1997; Melnikova and Mikhailov
2000). The coefficient of scattering by droplets
α
D
has no factor because the
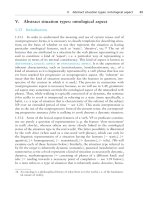
Fig. 7.12a,b. Spectral dependence of the volume coefficients (a –scatteringandb –absorp-
tion) of the stratus cloud, retrieved from the data of the experiments, numbered as per
Table 3.2
254 Analysis of Radiative Observations in Cloudy Atmosphere
Fig. 7.13a,b. Volume c o effi c i ents o f a –scatteringandb – absorption, transformed using
(7.2). The curve numbering corresponds to the experiments, listed in Table 3.2. The curve
marked with letter R characterizes the molecular scattering at altitude 1 km
equation of radiative transfer and corresponding asymptotic formulas solving
it are written for one component – droplet (in some cases for the droplet with
the absorbing particle within it). Item
κ
M
τ
p
D
ω
q
0
in the second of (7.2) differs
from zero only within the molecular absorption bands. Remember that the
problem is considered only for
τ
0
>> 1.
Factor C turns out to be equal to unity. Powers p and q are equal to: p
= 2and
q = τ
2
0
, as per the estimations in several studies (Melnikova 1989, 1992, 1997;
Kondratyev et al. 1997; Melnikova and Mikhailov 2000). These magnitudes
correspond to the above-mentioned fact that the mean number of scattering
events in the cloud of optical thickness
τ
0
is proportional to τ
2
0
(Minin 1981;
Yanovitskij 1997). We should point out that powers p and q were obtained from
the analysis of the magnitudes of volume scattering and absorption coefficients
for the data of two experiments at two wavelengths.
Transform values [
α(λ)−α(0.8)] and κ(λ) (Tables A.8, Appendix A) using
(7.2) leads to the values obtained with Mie theory and usually attribut ed to
the cloud elementary volume (Grassl 1975; Nakajima et al. 1991). The spectral
dependence of the transformed values of both difference [
α(λ)−α(0.8)] and
the volume absorption coefficient is presented in Fig. 7.13a,b. It is seen that the
magnitudes of the volume absorption coefficient demonstrated in Fig. 7.13b
practically coincide with the ones usually calculated with Mie theory for cloud
droplets (Grassl 1975). The molecular absorption bands become sharper. The
values of the single scattering albedo corresponding to the absorption coeffi-
cients presented in Fig. 7.13b are about 0.99998 that is close to the standard
magnitudes for the cloud layer. Difference [
α(λ)−α(0.8)] converted with (7.2)
does not distinguish much from Raleigh scattering coefficient for the clear sky.
The presented consideration concerns the external mixture,i.e.thecase,
when aerosol particles are situated between the cloud droplets. When aerosol
References 255
particles are situated within the droplets (the internal mixture)theaerosol
absorption is correctly accoun ted for in calculation with the formulas for
one-component medium. Basing on the obtained results one could conclude
that the anomalous absorption by clouds points to the external mixture of
the atmospheric aerosols and cloud droplets because in the opposite case the
radiation absorption by clouds coincides with the theoretical values.
7.5.2
Multiple Scattering of Radiation as a Reason for Anomalous Absorption
of Radia tion by Clouds in the Shortw ave Spectral Region
The aerosols consisting of hydrophobic particles such as sand, soot etc. could
exist within the cloud between droplets with higher probability than the hy-
drophilic ones (salt, sulfates); hence, they increase the shortwave absorption
of radiation by the cloud. Hydrophilic particles, being the nuclei of conden-
sation increase the droplet number. This obstacle in turn increases the cloud
optical thickness and causes the cloud cooling. The aerosol absorption by the
cloud increasing up to 15% has been app roximately estimated basing on the
proposed mec hanism with the mean values of the aerosol volume absorption
coefficient equal to 0.08 km
−1
and of the volume scattering coefficient equal to
30 km
−1
with geometrical thickness ∆z = 1 km and within spectral range 0.4–
1.0
µm. The molecule absorption within the ozone Chappuis band increases up
to 6–10% and the molecule absorption within oxygen band 0.76
µm increases
up to 10% that coincides with the results of the study by Dianov-Klokov et al.
(1973). This effectturns out strongerfor the thicker clouds, andit quantitatively
explains the anomalous absorption by clouds.
Experimental studies (Boers et al. 1996; Bott et al. 1996) actually indicate the
higher content of the carbonaceous and mineral compound in the atmospheric
aerosols than has been assumed before together with their significant yield to
forming the radiative regime of the atmosphere. The hydrophobic particles
could be injected into the atmosphere as the result of industrial escapes, sand
storms, volcanic eruptions, and fires. These sources do not seem enough to ac-
count for the cloud anomalous absorption display ed on a global scale, however
the aerosols flue escapes extend up to 3000 km keeping their radiation activity
in the optical range (Mazin and Khrgian 1989).
In the remainder of this chapter, we would like to point out that careful
accounting of the optical properties of all atmosphericcomponentsis necessary
for the construction of optical models (Vasilyev and Ivlev 2002).
References
Asano S (1994) Cloud and Radiation Studies in Japan. Cloud Radiation Interactions and
Their Parameterization in Climate Models. In: WCRP-86 (WMO/TD No. 648), WMO,
Geneva, pp 72–73
Binenko VI, Kondratyev KYa (1975) Vertical profiles of typical cloud forms. In: Main Geo-
physical Observatory Studies 331, pp 3–16 (in Russian)
256 References
Boers R, Jensen JB, Krummel PB, Gerber H (1996) Microphysical and short-wave radiative
structure of wintertime stratocumulus clouds over the Southern Ocean. Q J R Meteorol
Soc 122:1307–1339
Bott A, Trautmann T, Zdunkowski W (1996) A numerical model of the cloud-topped plane-
tary boundary layer: Radiation, turbulence and spectral microphysics in marine stratus.
Q J R Meteorol Soc 122:635–667
Curry JA, Hobbs PV, King MD, Randall DA, Minnis P, Isaac GA, Pinto JO, Uttal T, B ucholtz
A, Cripe DG, Gerber H, Fairall CW, Garrett TJ, Hudson J, Intrieri JM, Jakob C, Jensen T,
Lawson P, Marcotte D, Nguyen L, Pilews kie P, Rangno A, Rogers DC, Strawbridge KB,
Valero FPJ, Willams AG, Wylie D (2000). FIRE Arctic Clouds Experiment. Bulletin of the
American Meteorological Society 81:5–29
Dianov-Klokov BG, Grechko EI, Malkov GP (1973) Airborne measurements of the effective
photon free pass from radiation reflected and transmitted by clouds in the oxygen band
0.76
µm. Izv Acad Sci USSR, Atmosphere and Ocean Physics 9:524–537 (in Russian)
Feigelson EM (ed) (1981) Radiation in the cloudy atmosphere. Gidrometeoizdat, Leningrad
(in Russian)
Grassl H (1975) Albedo reduction and radiative heating of clouds by absorption aerosol
particles. Beitr Phys Atmos 48:199–209
Ivlev LS, Andreev SD (1986) Optical properties of atmospheric aerosols. St. Petersburg
University Press, St. Petersburg (in Russian)
Kondratyev KYa (ed) (1969) Radiative characteristics of the atmosphere and the surface.
Gidrometeoizdat, Leningrad (in Russian)
Kondratyev KYa (ed) (1991) Aerosol and Climate. Gidrometeoizda t, Leningrad (in Russian)
Kondratyev KYa, Binenko VI (1984) Impact of Clouds on Radiation and Climate. Gidrome-
teoizdat, Leningrad (in Russian)
Kondratyev KYa, Binenko VI, Melnikova IN (1997) Absorption of solar radiation by clouds
and aerosols in the visible wavelength region. Meteorology and Atmospheric Physics
0/319:1–10
Kondratyev KYa, Binenko VI, Melnikova IN (1998) Vertical profile of spectral scattering and
absorption coefficients of stratus clouds. II. Application to data of airborne radiative
observation. Atmosphere and Ocean Optics 11:381–387
Kurosu T, Rozanov VV, Burrows JP (1997) Parameterization schemes for terrestrial water
clouds in the radiative transfer model GOMETRAN. J Geoph R es 102(D18):21809–
21823
Marchuk GI, Kondratyev KYa,Kozoderov VV, Khvorostyanov VI (1986) Clouds and Climate.
Gidrometeoizdat, Leningrad (in Russian)
Mars hak A, Davis A, Wiscombe W, Cahalan R (1995) Radiative smoothing in fractal clouds.
J Geoph Res 100(D18):26247–26261
Mayer B, Kylling A, Madronich S, Seckmeyer G (1998) Enhanced absorption of UV radiation
due to multiple scattering in clouds: Experimental evidence and theoretical explanation.
J Geophys Res 103(D23):31241–31254
Mazin IP, Khrgian AKh (eds) (1989) Clouds and cloudy atmosphere. Gidrometeoizdat,
Leningrad (in Russian)
Melnikova IN (1989) Light absorption in cloud layers. In: Atmospheric Physics Problems.
St.Petersburg State University Press, St.Petersburg, 20, pp. 18–25
Melnikova IN (1992) Spectral optical parameters of cloud layers. Theory, Part I. Atmosphere
Optics 5:178–185 (Bilingual)
Melnikova IN (1992)Spectral opticalparameters of cloud layers. Applicationtoexperimental
data. Part II. Atmospher e Optics 5:178–185 (Bilingual)
References 257
Melnikova IN (1997) Determination of strati clouds optical parameters from measurement
of reflected or transmitted solar radiation. In: IRS’96 Current problems in Atmospheric
Radiation. Proceedings of the International Radiation Symposium, August 1996, Fair-
banks, Alaska. A. Deepak Publishing, pp 210–213
Melnikova IN (1997) Studies of influence of the multiple scattering on the true light ab-
sorption in clouds with using calculations of the Monte-Carlo method. I International
Conference Natural and anthropogenic aerosols, 29th September–4th October, St. Pe-
tersburg (in Russian)
Melnikova IN (1998) Vertical profile of spectral scattering and absorption coefficients of
stratus clouds. I. Theory. Atmosphere and Ocean Optics 11:5–11 (Bilingual)
Melnikova IN, Mikhailov VV (1992) The optical parameters in strati on basis of aircraft
spectral measurements. Thesis of International Radiation Symposium, August, Tallinn
Melnikova IN, Mikhailov VV (1993) Determination of optical characteristics of cloud layers.
Dokl. RAS 328:319–321 (in Russian)
Melnikova IN, Mikhailov VV (1994) Spectral scattering and absorption coefficients in strati
derived from aircraft measurements. J Atmos Sci 51:925–931
Melnikova IN, Fedorova EYu (1996) Vertical profile of optical parameters inside cloud
layer. In: Problems of Atmospheric Physics. State University Press, St.Petersburg, 20, pp
261–272
Melnikova IN, Domnin PI (1997) Determination of optical parameters of homogeneous
optically thick cloud layer. Atmosphere and Ocean Optics 10:734–740 (Bilingual)
Melnikova IN, Mikhailov VV (2000) Influence of multiple scattering of radiation on aerosols
and molecular absorption and scattering into clouds. In: IRS’2000, Current problems in
Atmospheric Radiation, Proceedings of the International Radiation Symposium, July,
St. Petersburg, Russia, pp 326–328
Melnikova IN, Nakajima T (2000) Single scattering albedo and optical thickness of stratus
clouds obtained from “POLDER” measurements of reflected radiation. Earth Observa-
tions and Remote Sensing 3:1–16 (Bilingual)
Melnikova IN, Nakajima T (2000) Space distribution of cloud optical parameters obtained
from reflected radiation observations with the POLDER instrument on the board of the
ADEOS satellite. In: Ivlev LS (ed) N atural and anthropogenic aerosols, St. Petersburg,
pp 78–85 (in Russian)
Melnikova IN, Mikhailov VV (2001) Vertical profile of spectral optical parameters of stratus
clouds from airborne radiative measurements. J Geophys Res 106(D21):27465–27471
Melnikova IN, Domnin PI, Varotsos C, Pivovarov SS (1997) Retrieval of optical properties
of cloud layers from transmitted solar radiance data. In: Proceedings of SPIE, Vol. 3237,
23rd European Meeting on Atmospheric Studies by Optical Methods, September 1996,
Kiev, Ukraine, pp 77–80
Melnikova IN, Domnin PI, Radionov VF (1998) Retrieval of optical thickness and single
scattering albedo from measurements of reflected or transmitted solar radiation. Izv.
RAS, Atmosphere and Ocean Physics 34:669–676 (Bilingual)
Melnikova IN, Mikhailov VV, Domnin PI, Radionov VF (2000) Optical characteristics of
clouds derived from measurements of reflected or transmitted solar radia tion. J A tmos
Sci 57:2135–2143
Minin IN (1981) Leningrad School of the radiative transfer theory. Astrophysics. Academy
of Sciences of Armenian Repu blic 17:585–618 (in Russian)
N akajima T, King MD, Spinhirne JD, Radke LF (1991) Determination of the optical thickness
and effective particle radius of clouds from reflected solar radiation measurements. II.
Marine stratocumulus observations. J Atmos Sci 48:728–750
258 References
N akajima TY, Nakajima T (1995)Wide-area determination of cloud microphysical properties
from NOAA AVHRR Measurements for FIRE and ASTEX regions. J Atmos Sci 52:4043–
4059
Pfeilsticker K (1999) First geometrical path length probability density function derivation of
theskylight from high-resolution oxygen A-band spectroscopy.2.Derivation of the Levy
index for the skylight transmitted by midlatitude clouds. J Geoph Res 104(D43):4101–
4116
Pfeilsticker K, Erle F, Platt U (1997) Absorption of solar radiation by atmospheric O
4
.
J Atmos Sci 54:934–939
Pfeilsticker K, Erle F, Funk O, Marquard L, Wagner T, Platt U (1998). Optical path modifi-
cation due to tropospheric clouds: Implications for zenith sky measurements of strato-
spheric gases. J Geoph Resv 103(D19):35323–25335
Radionov VF, Sakunov GG, Grishechkin VS (1981) Spectral albedo o f snow surface from
measurements at drifting station SP-22. In: First global experiment FGGE, Vol. 2: Polar
aerosols, extended cloudiness and radiation. Gidrometeo izdat, Leningrad, pp 89–91 (in
Russian)
Rozenberg GV, Malkevitch MS, Malkova VS, Syachinov VI (1974) Determination of the
optical characteristics of c louds from measurements of reflected solar radiation on the
Kosmos-320 satellite. Izv. Acad. Sci. USSR, Atmosphere and Ocean Physics 10:14–24 (in
Russian)
Rublev AN, Trotsenko AN, Romanov PYu (1997) Using data of the satellite radiometer
AVHRR for cloud optical thickness determining. Izv. RAS, Atmosphere and Ocean
Physics 33:670–675 (Bilingual)
Sokolic I, Toon OB (1999) Incorporation of mineralogical composition into models of
the radiative properties of mineral aerosol from UV to IR wavelengths. J Geoph Res
104(D8):9423–9444
Sok olic IN (1988) Interpretation of measurements of optical characteristics of smoke
aerosols. Izv Acad Sci USSR, Atmosphere and Ocean Physics 34:345–357 (Bilingual)
Stephens GL (1979) Optical properties of eight water cloud types. Technical Paper of CSIRO,
Atmosph Phys Division, A spendale, Australia, No. 36, p p 1–35
Vasilyev AV, Ivlev LS (2002) On optical properties of polluted clouds. Atmosphere and Ocean
Optics 15:157–159 (Bilingual)
Vasilyev AV, Melnikova IN,MikhailovVV (1994) Vertical pro file of spectral fluxes of scattered
solar radiation within stratus clouds from airborne measurements.IzvRAS,Atmosphere
and Ocean Physics 30:630–635 (Bilingual)
Wagner T, Erle F, Marquard L, Otten C, Pfeilsticker K, Senne T, Stutz J, Platt U (1998)
Cloudy sky optical paths as derived from differential optical absorption spectroscopy
observations. J Geoph Res 103(D19):25307–25321
Yanovitskij EG (1997) Light scattering in inhomogeneous atmospheres. Springer, Berlin
Heidelberg New York
CHAPTER 8
Conclusion
The authors have considered two effective methods for calculation of the
solar radiance and irradiance under clear and cloudy conditions (the direct
problem solving): the numerical one – the Monte-Carlo method for clear sky,
and the analytical one – the method of the asymptotic formulas for overcast
sky. The advantages of the methods during the calculation of the radiative
characteristics have been shown. The methods have been presented in detail
(including thealgorithms) so that interested colleagues coulddirectly use them.
The uncertainties of these methods have been analyzed. In the beginning of
the book (Chaps. 1 and 2) the physical characteristics and conce ptions have
been defined and the main physical principles of light propagation in the
atmosphere have been explained.
While describing the experiments, the main emphasis has been put to the
methodological details of observations for improving the exactness of mea-
surements. Instruments are improved constantly , but the considered details
of the accomplishment of radiation observations, as we hope, could be useful
for specialists. The sources of observational and processing errors have been
analyzed, and the possibilities for their minimization have been proposed. The
elaborated algorithms of the experimental data processing are based on the
methods of mathematical statistics and even if they could not be directly ap-
plied to the data of other experiments they would be useful to study because the
commonprinciplesofprocessingalargevolumeofdataarethefundamental
ones.
Thepresentedexamplesoftheverticalprofilesandspectraldependenceof
solar semispherical upward and downward fluxes are shown in figures and
tables for using these data in radiative models under different atmospheric
conditions or as the initial data of inverse problems. Here we have presented the
examples of observational data f or different atmospheric and meteorological
conditions. For our colleagues who are interest ed in these data we would like
to remind them that the database is extended enough.
The developed classification of different types of surfaces could be also
mentioned.The obtained results allow effectively identifying thetype of surface
on the o ne hand and adequately taking into account the reflection of solar
radiation from the surface in atmospheric optics on the other hand.
The numerical and analytical methods of the retrieval of the atmospheric
parameters from the data of solar radiation measurements under clear and
overcast sky conditions (the inverse problem solving), elaborated by the au-
260 Conclusion
thors are described in detail. Significant attention is paid to the correctness of
the inverse problem. Careful error analysis and study of the applicability range
in every considered case is in fact the investigation of stability of the inverse
problem solution. The detailed algorithms of the inverse problem solving and
its analysis could be applied to other similar data.
The application of the elaborated methods to the interpretation of the exper-
imen tal data allows the retrieval of new information: the spectral and vertical
dependence of the optical parameters of the clear and cloudy atmosphere.
The obtained examples of the vertical profiles and spectral dependence of the
optical parameters of the atmosphere and surface are presented in figures and
tables. There is a rich database of results similar to the examples presented here,
which could be used as an optical model for different atmospheric conditions.
On the basis of cloud optical parameters obtained from observations, the
mechanism ofinfluence ofthemultiple scattering of radiation by cloud droplets
on the increase of true absorption by atmospheric aerosols and on the molec-
ular scattering and absorption by the cloudy atmosphere is proposed. The
empirical formulas for taking into account this mechanism are inferred. They
allow correcting numerical optical models. Numerically estimating validation
of the obtained cloud optical parameters is accomplished.
This mechanism is applied to the multi-component medium (droplets,
molecules, aerosols) and used for the explanation of the anomalous short-
wave radiation absorption by clouds. Until now this effect has not had an
adequate interpretation.
Appendix A: Tables of Radiative Characteristics
and Optical Parameters of the Atmosphere
Table A .1. Semispherical solar irradiance (mWcm
−1
µm
−1
) reduced to solar incident angle
51
◦
and to the levels of the atmospheric pressure from the results of processing the airborne
sounding data 16 Oct. 1983 in the clear sky. Ground surface is the sand (continued on next
page)
λ (nm) Downwelling irradiance Upwelling irradiance
mW cm
−2
µm
−1
mW cm
−2
µm
−1
P (mbar) 1000 900 800 700 600 500 1000 900 800 700 600 500
350 21.6 24.0 26.7 29.8 33.3 37.0 1.48 3.41 5.31 7.20 9.06 10.9
360 25.9 28.1 35.0 33.3 36.3 39.5 2.09 4.10 6.10 8.08 10.0 12.0
370 42.6 45.7 47.8 51.6 54.6 57.5 3.96 7.09 10.1 13.0 16.0 18.9
380 43.4 46.1 48.9 51.7 54.5 57.3 4.87 7.64 10.4 13.2 16.0 18.8
390 46.0 48.6 51.2 53.9 56.6 59.2 5.70 8.31 10.9 13.6 16.3 19.0
400 64.6 67.1 69.9 73.1 76.5 80.2 7.86 10.4 12.9 15.5 18.1 20.7
410 68.8 71.4 74.3 77.5 81.0 84.8 8.30 10.9 13.5 16.2 18.8 21.5
420 76.5 79.3 82.2 85.3 88.6 92.2 9.33 12.2 15.0 17.9 20.8 23.8
430 55.7 58.3 61.2 64.4 67.9 71.7 7.24 9.47 11.7 14.0 16.3 18.7
440 69.2 72.2 75.6 79.3 83.3 87.6 9.97 12.5 15.1 17.8 20.5 23.2
450 86.3 89.5 93.0 96.8 101.0 106.0 13.7 16.6 19.5 22.5 25.5 28.7
460 88.1 91.0 94.3 97.8 102.0 106.0 15.0 17.6 20.3 23.1 26.0 28.9
470 87.5 90.2 93.2 96.5 100.0 104.0 15.5 17.9 20.5 23.1 25.8 28.5
480 92.9 95.6 98.5 102.0 105.0 109.0 17.4 19.8 22.2 24.7 27.3 30.0
490 86.8 89.2 92.0 95.0 98.3 102.0 16.9 19.1 21.3 23.6 26.0 28.4
500 85.8 88.1 90.7 93.5 96.7 100.0 17.7 19.7 21.8 23.9 26.2 28.4
510 90.0 92.2 94.7 97.4 100.0 104.0 19.8 21.8 23.8 25.9 28.1 30.3
520 83.3 85.4 87.7 90.3 93.1 96.2 19.4 21.1 22.9 24.8 26.8 28.8
530 89.4 91.5 93.8 96.4 99.2 102.0 22.1 23.8 25.6 27.5 29.4 31.4
540 86.6 88.4 90.5 92.9 95.5 98.3 22.7 24.2 25.8 27.5 29.3 31.1
550 89.2 90.9 92.9 95.2 97.7 101.0 24.6 26.1 27.7 29.4 31.1 32.9
560 87.1 88.8 90.8 93.0 95.5 98.2 25.4 26.8 28.2 29.7 31.3 33.0
570 87.7 89.5 91.4 93.6 96.1 98.7 26.6 27.9 29.2 30.7 32.2 33.7
580 88.1 89.8 91.8 94.1 96.5 99.2 27.8 29.0 30.2 31.6 33.0 34.5
590 83.5 85.2 87.1 89.2 91.6 94.2 27.2 28.3 29.4 30.6 31.9 33.3
600 86.2 87.7 89.3 91.2 93.4 95.7 28.6 29.7 30.8 32.0 33.3 34.6
610 86.1 87.4 88.9 90.7 92.7 94.9 29.3 30.3 31.4 32.6 33.8 35.2
262 Appendix A: Tables of Radiative Characteristics and Optical Parameters of the Atmosphere
Table A .1. (continued)
λ (nm) Downwelling irradiance Upwelling irradiance
mW cm
−2
µm
−1
mW cm
−2
µm
−1
P (mbar) 1000 900 800 700 600 500 1000 900 800 700 600 500
620 84.4 85.8 87.4 89.2 91.3 93.5 29.3 30.3 31.4 32.5 33.7 35.0
630 80.7 82.2 83.9 85.9 88.0 90.4 28.6 29.4 30.3 31.2 32.3 33.3
640 80.4 81.7 83.2 85.0 86.9 89.1 28.7 29.6 30.5 31.5 32.5 33.6
650 78.3 79.5 80.9 82.6 84.4 86.5 28.3 29.1 29.9 30.9 31.8 32.9
660 76.4 77.4 78.7 80.1 81.8 83.6 27.7 28.5 29.4 30.3 31.3 32.4
670 77.7 78.7 79.9 81.3 83.0 84.8 28.6 29.4 30.3 31.2 32.2 33.3
680 75.4 76.4 77.6 79.0 80.7 82.6 28.1 28.9 29.7 30.6 31.6 32.6
690 66.7 68.1 69.8 71.7 73.8 76.2 25.5 25.9 26.4 27.0 27.6 28.2
700 67.5 68.8 70.3 72.0 73.9 76.1 25.3 25.8 26.5 27.1 27.8 28.6
710 65.3 66.5 67.9 69.6 71.5 73.6 25.1 25.6 26.2 26.8 27.5 28.2
720 59.7 61.3 63.1 65.2 67.4 69.8 22.5 22.9 23.2 23.7 24.1 24.6
730 59.9 61.3 62.8 64.6 66.6 68.8 23.1 23.5 23.9 24.4 24.9 25.4
740 61.2 62.3 63.6 65.1 66.8 68.7 24.8 25.2 25.6 26.1 26.7 27.3
750 59.6 60.7 62.0 63.5 65.2 67.1 24.6 25.0 25.5 26.0 26.5 27.1
760 42.2 45.0 48.0 51.1 54.5 58.0 18.5 18.5 18.6 18.6 18.7 18.8
770 53.7 55.0 56.5 58.3 60.2 62.4 22.8 23.1 23.4 23.7 24.1 24.6
780 56.2 57.2 58.4 59.7 61.3 63.1 23.9 24.3 24.7 25.1 25.6 26.2
790 54.4 55.4 56.6 58.0 59.5 61.3 23.3 23.6 24.0 24.4 24.8 25.3
800 53.0 54.0 55.2 56.5 58.0 59.8 22.8 23.1 23.5 23.9 24.3 24.8
810 49.3 50.5 51.8 53.4 55.1 57.0 20.9 21.1 21.4 21.7 22.0 22.3
820 46.1 47.4 49.0 50.7 52.5 54.6 19.3 19.5 19.7 19.9 20.2 20.5
830 45.5 46.7 48.0 49.5 51.3 53.2 19.5 19.7 19.9 20.2 20.5 20.8
840 46.8 47.7 48.8 50.0 51.4 53.0 20.6 20.9 21.1 21.4 21.8 22.2
850 45.0 45.9 46.9 48.1 49.5 51.0 20.3 20.5 20.8 21.1 21.4 21.8
860 43.7 44.5 45.5 46.7 48.0 49.6 19.8 20.1 20.3 20.6 20.9 21.3
870 45.5 46.2 47.1 48.1 49.3 50.6 20.4 20.7 21.0 21.3 21.6 22.0
880 44.3 45.1 46.1 47.2 48.5 49.9 19.9 20.1 20.4 20.8 21.1 21.5
890 41.8 42.7 43.7 45.0 46.4 48.0 18.4 18.6 18.9 19.2 19.4 19.8
900 38.3 39.4 40.8 42.3 44.0 45.8 16.3 16.5 16.6 16.8 17.0 17.2
910 35.1 36.5 38.1 39.8 41.7 43.7 14.8 14.9 14.9 15.0 15.0 15.1
920 36.6 37.7 39.1 40.5 42.2 43.9 15.6 15.7 15.9 16.0 16.1 16.3
930 21.3 23.7 26.3 29.1 32.1 35.3 8.35 8.34 8.31 8.28 8.23 8.18
940 21.1 23.5 26.1 28.8 31.7 34.8 8.19 8.12 8.05 7.97 7.89 7.80
950 21.5 23.7 26.1 28.7 31.4 34.3 8.52 8.44 8.36 8.27 8.19 8.10
960 5.71 6.56 8.22 10.6 13.7 17.5 3.73 3.40 3.09 2.81 2.55 2.32
970 0.16 1.11 1.11 1.11 9.00 9.43 0.104 1.05 1.05 1.05 0.80 1.23
Appendix A: Tables of Radiative Characteristics and Optical Parameters of the Atmosphere 263
Table A .2. Semispherical solar irradiance (mWcm
−1
µm
−1
) reduced to solar incident angle
48
◦
and to the levels of the atmospheric pressure from the results of processing the airborne
sounding 29 Apr. 1985 in the clear sky. Ground surface is the snow on ice (continued on next
page)
λ (nm) Downwelling irradiance Upwelling irradiance
mW cm
−2
µm
−1
mW cm
−2
µm
−1
P (mbar) 1000 900 800 700 600 500 1000 900 800 700 600 500
330 19.9 20.9 22.3 24.4 27.2 30.5 9.72 10.7 11.8 13.0 14.1 15.3
340 30.5 31.6 33.1 35.1 37.5 40.5 15.3 16.3 17.3 18.5 19.7 20.9
350 35.7 37.2 38.9 41.0 43.4 46.1 18.2 19.5 20.9 22.3 23.8 25.3
360 38.3 39.7 41.2 43.0 45.1 47.4 19.8 21.1 22.6 24.1 25.7 27.3
370 54.2 55.8 57.6 59.4 61.5 63.9 28.8 30.5 32.2 34.0 35.9 37.8
380 56.9 58.3 59.8 61.4 63.1 64.8 31.2 32.6 34.1 35.7 37.4 39.1
390 57.2 58.4 59.7 61.1 62.7 64.7 30.9 32.1 33.4 34.8 36.4 37.9
400 82.1 83.5 85.1 86.8 88.6 90.6 43.7 45.1 46.6 48.3 50.2 52.2
410 83.8 85.0 86.3 87.9 90.1 92.8 44.4 45.6 46.9 48.5 50.1 51.8
420 87.2 88.6 90.1 91.9 93.9 96.9 46.2 47.6 49.1 50.9 52.9 54.8
430 75.8 76.8 78.1 79.5 81.1 82.9 40.6 41.6 42.8 44.2 45.8 47.7
440 91.1 92.2 93.6 95.1 97.0 99.0 48.3 49.4 50.8 52.3 54.2 56.2
450 103.0 104.0 106.0 108.0 110.0 113.0 54.6 55.7 57.1 58.8 60.9 62.8
460 107.0 108.0 109.0 111.0 113.0 115.0 56.3 57.4 58.7 60.3 62.1 64.2
470 106.0 107.0 108.0 110.0 112.0 113.0 55.6 56.6 57.8 59.2 60.9 62.9
480 111.0 112.0 113.0 115.0 116.0 118.0 57.1 58.0 59.1 60.5 62.2 64.1
490 105.0 106.0 107.0 108.0 110.0 111.0 53.7 54.5 55.6 56.9 58.4 60.2
500 103.0 104.0 105.0 106.0 107.0 109.0 52.2 52.9 53.8 55.0 56.4 58.0
510 107.0 107.0 108.0 109.0 111.0 112.0 53.6 54.2 55.1 56.2 57.5 59.1
520 99.4 100.0 101.0 102.0 103.0 104.0 49.8 50.4 51.2 52.2 53.5 54.9
530 105.0 106.0 106.0 107.0 109.0 110.0 52.1 52.7 53.4 54.4 55.6 57.1
540 101.0 101.0 102.0 103.0 104.0 106.0 49.6 50.2 50.9 51.8 53.0 54.3
550 103.0 103.0 104.0 105.0 106.0 107.0 50.5 50.9 51.6 52.5 53.6 55.0
560 101.0 101.0 102.0 103.0 104.0 105.0 49.3 49.7 50.4 51.2 52.2 53.5
570 102.0 102.0 103.0 103.0 104.0 105.0 49.2 49.6 50.2 50.9 51.9 53.1
580 101.0 101.0 102.0 102.0 104.0 105.0 48.1 48.4 48.9 49.6 50.3 51.2
590 97.9 98.2 98.6 99.3 100.0 101.0 46.6 46.8 47.3 47.9 48.7 49.7
600 98.3 98.6 99.0 99.7 100.0 101.0 46.1 46.4 46.8 47.4 48.3 49.2
610 97.3 97.6 98.0 98.6 99.4 100.0 45.9 46.2 46.6 47.2 48.0 49.0
620 96.7 96.9 97.3 97.9 98.7 99.6 45.4 45.7 46.1 46.7 47.4 48.4
630 93.3 93.5 93.9 94.4 95.1 96.6 43.2 43.3 43.7 44.2 44.9 45.6
640 92.6 92.7 93.1 93.6 94.2 95.0 42.4 42.6 42.9 43.4 44.0 44.9
650 89.8 90.0 90.3 90.8 91.5 92.3 40.9 41.1 41.4 41.9 42.6 43.4
660 86.5 86.7 87.0 87.5 88.2 89.0 39.1 39.3 39.7 40.1 40.8 41.6
670 88.0 88.2 88.5 89.0 89.6 90.4 40.0 40.2 40.5 41.0 41.7 42.5
680 85.7 85.8 86.1 86.6 87.2 88.0 38.8 39.0 39.3 39.7 40.4 41.1
690 78.0 78.3 78.9 79.9 81.1 82.7 34.2 34.3 34.5 34.8 35.2 35.7
700 79.1 79.3 79.6 80.0 81.0 82.3 34.3 34.5 34.8 35.2 35.7 36.2
710 70.4 71.0 71.8 73.0 74.6 76.4 30.6 31.2 31.8 32.5 33.3 34.1
720 65.8 66.5 67.5 68.9 70.7 72.7 28.0 28.4 29.0 29.5 30.2 30.9
264 Appendix A: Tables of Radiative Characteristics and Optical Parameters of the Atmosphere
Table A .2. (continued)
λ (nm) Downwelling irradiance Upwelling irradiance
mW cm
−2
µm
−1
mW cm
−2
µm
−1
P (mbar) 1000 900 800 700 600 500 1000 900 800 700 600 500
730 62.9 63.9 65.1 66.7 68.6 70.8 25.6 25.9 26.4 26.8 27.3 27.8
740 64.9 65.4 66.3 67.4 68.9 70.7 27.3 27.8 28.3 28.9 29.5 30.3
750 64.3 64.8 65.4 66.5 67.8 69.5 27.6 28.1 28.7 29.3 30.0 30.8
760 39.1 40.0 41.5 43.7 46.6 50.2 17.6 17.8 18.0 18.3 18.6 18.9
770 48.5 50.1 52.0 54.3 56.8 59.7 20.2 20.4 20.6 20.9 21.3 21.7
780 59.6 60.1 60.9 62.0 63.4 65.1 25.0 25.4 26.0 26.5 27.1 27.8
790 58.6 59.1 59.7 60.7 62.0 63.5 24.2 24.6 25.2 25.8 26.4 27.1
800 56.8 57.3 57.9 58.9 60.1 61.7 23.2 23.6 24.2 24.7 25.3 26.0
810 55.5 55.9 56.5 57.4 58.6 60.1 22.5 23.0 23.4 24.0 24.5 25.2
820 49.9 50.7 51.8 53.1 54.7 56.6 19.1 19.4 19.7 20.0 20.4 20.8
830 49.1 49.8 50.8 52.1 53.6 55.4 18.9 19.2 19.5 19.9 20.3 20.7
840 49.9 50.4 51.1 52.1 53.3 54.8 19.9 20.2 20.6 21.0 21.5 22.0
850 49.3 49.7 50.2 51.1 52.2 53.5 20.0 20.4 20.9 21.3 21.8 22.4
860 48.0 48.4 48.9 49.7 50.7 52.0 19.4 19.8 20.2 20.7 21.2 21.7
870 47.7 48.0 48.5 49.3 50.4 51.7 19.1 19.4 19.9 20.4 20.9 21.4
880 47.6 48.0 48.5 49.3 50.3 51.6 18.8 19.1 19.6 20.0 20.5 21.1
890 46.8 47.2 47.7 48.5 49.6 50.9 18.0 18.4 18.8 19.2 19.7 20.3
900 40.8 41.5 42.5 43.7 45.1 46.9 14.6 14.8 15.1 15.4 15.8 16.1
910 35.1 36.5 38.1 39.8 41.7 43.7 14.8 14.9 14.9 15.0 15.0 15.1
920 36.6 37.7 39.1 40.5 42.2 43.9 15.6 15.7 15.9 16.0 16.1 16.3
930 21.3 23.7 26.3 29.1 32.1 35.3 8.35 8.34 8.31 8.28 8.23 8.18
940 21.1 23.5 26.1 28.8 31.7 34.8 8.19 8.12 8.05 7.97 7.89 7.80
950 21.5 23.7 26.1 28.7 31.4 34.3 8.52 8.44 8.36 8.27 8.19 8.10
960 5.71 6.56 8.22 10.6 13.7 17.5 3.73 3.40 3.09 2.81 2.55 2.32
970 0.16 1.11 1.11 1.11 9.00 9.43 0.104 1.05 1.05 1.05 0.80 1.23
Appendix A: Tables of Radiative Characteristics and Optical Parameters of the Atmosphere 265
Table A .3. Semispherical solar irradiance (mWcm
−1
µm
−1
) reduced to solar incident angle
48
◦
from the results of processing the airborne sounding 20 Apr. 1985 in the overcast sky.
Ground surface is the snow on ice (continued on next page)
λ (nm) Downwelling irradiance Upwelling irradiance
mW cm
−2
µm
−1
mW cm
−2
µm
−1
z (km) 1.4 1.3 1.2 1.1 0.9 0.8 1.4 1.3 1.2 1.1 0.9 0.8
350 62.01 57.70 47.16 37.50 31.49 29.52 39.26 37.62 30.34 25.44 21.09 20.38
360 68.89 64.81 55.08 44.37 37.39 35.43 44.17 42.26 33.76 28.05 23.92 22.30
370 85.71 81.02 68.52 54.42 47.03 44.75 57.19 54.86 43.40 36.24 30.92 29.03
380 76.88 72.38 60.97 49.09 42.24 40.56 47.65 43.54 34.68 30.78 27.60 27.71
390 79.70 74.86 62.74 50.75 43.97 42.00 47.00 43.40 36.02 33.63 30.97 27.62
400 111.72 104.84 87.95 71.48 61.52 58.99 67.47 61.7 49.86 43.96 39.19 39.95
410 113.57 106.09 89.42 73.66 63.86 61.34 71.80 65.24 51.99 45.81 40.88 41.26
420 109.40 99.78 78.82 70.72 65.59 62.34 65.91 59.76 49.13 44.1 39.98 40.56
430 110.17 100.11 78.01 70.32 65.19 62.05 66.05 59.87 49.00 44.22 40.35 40.66
440 115.66 105.34 82.80 74.70 68.04 65.84 68.98 62.47 51.36 46.15 41.88 43.06
450 130.51 118.52 91.65 82.68 76.18 73.28 76.02 69.04 57.18 51.28 46.47 47.78
460 139.61 126.44 96.97 87.83 81.15 77.80 80.75 73.32 60.26 54.13 49.18 49.79
470 138.56 125.49 96.20 87.15 80.93 77.41 80.04 72.79 59.96 53.74 48.74 49.59
480 139.61 126.31 96.51 87.67 81.09 77.86 79.33 71.96 58.89 52.76 47.88 49.09
490 133.62 120.97 92.39 83.72 77.02 73.94 75.12 68.30 56.17 50.26 45.54 46.48
500 132.58 119.99 91.43 82.91 76.94 73.61 74.09 67.24 55.40 49.47 44.71 45.77
510 129.45 117.02 88.77 80.72 74.77 71.64 72.02 65.24 53.08 47.58 43.20 44.17
520 126.84 114.41 86.46 78.82 72.77 69.82 70.27 63.70 52.11 46.71 42.39 43.36
530 125.80 113.35 85.19 77.86 72.53 69.429 69.32 62.66 50.78 45.47 41.22 42.36
540 129.19 116.44 87.83 80.50 74.43 71.28 70.91 64.08 52.19 46.72 42.32 43.46
550 130.23 117.31 88.20 80.74 75.00 71.44 71.23 64.25 51.99 46.69 42.42 43.46
560 129.44 116.67 87.89 80.70 74.66 71.52 70.78 63.94 51.78 46.53 42.29 43.36
570 125.59 113.06 84.77 77.80 71.81 68.57 67.91 61.03 49.29 44.29 40.25 41.25
580 123.97 111.50 83.30 76.52 70.33 67.36 66.51 59.62 47.88 43.02 39.12 40.05
590 123.97 111.46 83.34 76.68 70.14 67.13 66.23 59.32 47.57 42.78 38.93 39.75
600 122.14 109.80 81.47 74.67 68.48 65.39 64.36 57.51 45.81 41.10 37.32 38.14
610 119.8 107.64 80.42 74.24 68.43 65.22 63.51 56.86 45.40 40.93 37.32 38.14
620 116.68 104.79 78.12 72.16 66.39 63.29 61.61 55.21 44.03 39.56 35.95 36.54
630 112.77 101.39 75.77 69.91 64.14 61.10 59.48 53.17 42.12 37.84 34.43 34.93
640 111.73 100.41 74.86 69.08 63.59 60.39 58.36 52.07 41.25 37.16 33.86 34.23
650 109.90 98.89 74.03 68.31 62.42 59.41 57.38 51.06 40.15 36.04 32.77 33.43
660 107.30 96.32 71.73 66.32 60.93 57.72 55.51 49.48 38.85 34.97 31.89 32.42
670 106.78 96.10 72.11 66.60 60.84 57.77 55.58 49.59 38.85 35.07 32.07 32.32
680 105.48 94.79 71.10 65.91 60.32 57.01 55.23 49.24 38.32 34.51 31.48 32.02
690 95.50 85.71 63.65 58.42 53.04 49.64 48.87 43.26 33.16 29.59 26.80 27.11
700 96.44 86.96 65.86 60.104 52.40 48.70 49.80 44.09 32.33 28.73 25.98 26.70
710 96.56 87.12 65.95 59.88 52.25 48.42 49.57 43.97 32.44 28.71 25.83 26.55
720 94.23 84.81 63.69 58.02 50.11 46.72 48.56 42.81 31.08 27.55 24.87 25.50
730 87.89 78.82 59.04 53.55 45.25 41.87 44.76 38.84 26.93 23.70 21.32 21.88
740 89.65 80.79 61.24 55.46 47.57 43.83 45.52 40.07 28.93 25.3 22.59 23.39
750 88.95 80.24 61.85 56.55 48.30 44.82 46.37 40.91 29.55 26.09 23.48 24.39
266 Appendix A: Tables of Radiative Characteristics and Optical Parameters of the Atmosphere
Table A .3. (continued)
λ (nm) Downwelling irradiance Upwelling irradiance
mW cm
−2
µm
−1
mW cm
−2
µm
−1
z (km) 1.4 1.3 1.2 1.1 0.9 0.8 1.4 1.3 1.2 1.1 0.9 0.8
760 83.27 75.06 57.38 52.71 44.81 42.15 44.58 39.14 27.75 24.40 21.85 22.98
770 61.52 55.77 41.63 36.80 30.57 28.23 29.55 25.74 17.81 15.30 13.52 14.45
780 84.39 76.70 58.12 52.02 43.64 40.48 42.39 37.28 26.23 22.90 20.42 21.08
790 85.67 77.98 59.26 52.80 44.54 40.97 42.79 37.53 26.09 22.75 20.30 21.08
800 81.98 74.42 56.44 50.39 42.18 38.93 41.35 36.06 24.64 21.39 19.03 19.48
810 80.27 72.56 55.58 50.12 41.58 38.46 40.73 35.50 24.04 20.95 18.71 19.27
822 72.60 65.31 49.62 44.66 36.33 33.10 36.54 31.35 19.98 17.20 15.27 15.96
830 71.06 63.83 48.59 43.65 35.70 32.42 35.67 30.64 19.90 16.98 14.91 15.86
840 71.72 64.44 50.54 45.91 37.62 34.16 37.37 32.45 21.21 18.24 16.16 17.16
850 71.07 63.87 50.67 46.42 38.37 34.70 37.56 32.86 21.99 18.96 16.79 17.56
860 67.77 60.88 48.59 44.53 36.74 33.26 35.78 31.09 20.44 17.62 15.61 16.96
870 67.95 61.02 48.98 44.96 36.66 33.34 36.18 31.46 20.62 17.70 15.62 16.46
880 67.37 60.34 48.16 44.28 35.91 32.63 35.49 30.68 19.58 16.88 15.01 15.66
890 66.18 59.10 47.06 43.31 35.00 31.69 35.05 30.18 18.94 16.15 14.23 14.56
900 59.91 53.33 41.36 37.24 28.65 25.84 30.00 25.15 14.28 12.12 10.75 11.04
910 58.60 52.16 40.23 36.14 27.43 24.47 29.12 24.30 13.36 11.32 10.06 10.44
920 57.80 51.44 39.21 34.84 26.50 23.40 28.09 23.36 12.77 10.52 9.09 8.98
930 57.78 51.43 39.79 36.03 27.76 24.80 29.08 24.29 13.53 11.26 9.83 10.74
940 41.78 36.74 25.88 22.41 15.81 13.52 18.78 14.77 6.33 5.27 4.75 4.80
950 42.19 37.32 26.40 22.60 15.38 13.78 18.09 14.38 6.70 5.38 4.61 4.38
960 44.77 39.64 27.87 23.83 16.79 14.83 19.23 15.33 7.16 5.91 5.16 4.89
970 49.87 44.31 31.63 27.24 20.09 17.23 21.84 17.31 7.54 6.48 5.93 6.32
Appendix A: Tables of Radiative Characteristics and Optical Parameters of the Atmosphere 267
Table A. 4. Description of classes of the spectral brightness coefficients (SBC) of the water
surface
∗
(continued on next page)
Notation N – number of spectra in the class (mean and root-mean-square values of SBC
are calculated over them).
H – altitude of the flight in met ers, three values: minimum, arithmetic mean
and maximum over all spectra of the class.
Z – solar zenith angl e in degrees, three values: minimum, arithmetic mean and
maximum over all spectra of the class.
C(cl) – total chlorophyll contents, attributed to the class (
µg/l) for the water
surface from the acc ompanied contact measurements
C(ms) – mineral matter contents, attributed to the class (
µg/l) for the water
surface, from the accompanied contact measurements
Class 1.0 Pure lake water: central parts of the Ladoga and Onega Lakes, farfrom the coast
and river mouths. C(cl) = 0.5 µg/l. C(ms) = 0.5 µg/l. N = 930, H = (200/292/300),
Z
= (37/44/64). Observation to nadir. Variation of weather conditions: clear sky,
transparent cloudiness, overcast sky.
Class 2.0 East part of the Ladoga Lake, central part of the Rybinsk reservoir during
the period before “water blossom”. C(cl)
= 1.5 µg/l, C(ms)= 1.5 µg/l. N = 55,
H
= (300/300/300), Z = (35/39/51). Observation to nadir. Weather conditions:
clear sky.
Class 3.0 The Ladoga and Onega Lakes at the distance 10–15km from the coast, cen-
tral part of the Rybinsk reservoir. C(cl)
= 2.5 µg/l, C(ms) = 1.0 µg/l, N= 226,
H
= (300/300/300), Z= (35/43/64). Observation to nadir. Variation of weather
condition s : clear sky, overcast sky.
Class 4.0 The Ladoga Lake: areas of theVolkhov and Svir rivers mouths andPetrokrepost
bay, the Rybinsk and Tsimlyansky reservoirs C(cl)
= 2.5, C(ms) = 3.0, N = 182,
H
= (200/299/300), Z= (35/40/63). Observation to nadir. Variation of weather
condition s : clear sky, overcast sky.
Class 5.0 The Ladoga Lake: areas of the Volkhov and Svir rivers mouths near the
coast, the Rybinsk reser voir. C(cl)
= 4.0 µg/l, C(ms) = 1.0 µ g/l, N = 165, H=
(300/300/300), Z = (35/40/63). Observation to nadir. Variation of weather con-
ditions: clear sky, overcast sky.
Class 6.0 The Ladoga Lake: areas near the Volkhov and Svir rivers mouths. C(cl)
=
5.0 µg/l, C(ms) = 3.0 µg/l. N = 66, H= (300/300/300), Z = (36/47/63). Observa-
tion to nadir . Weather conditions: clear sky .
Class 7.0 The Mingechaursky reservoir in the period of “water blossom”, the Sivash Gulf.
C(cl)
= 3.5 µg/l, C(ms) = 3.0 µg/l. N = 35,H = (300/357/500), Z= (40/53/63). Ob-
servation to nadir. Weather conditions: clear sky.
Class 8.0 TheMingechaursky reservoir in the periodof “water blossom”. C(cl)
= 4.0 µg/l,
C(ms)= 4.0 µg/l. N = 43, H = (300/300/300), Z= (40/49/61). Observation to
nadir. Weather conditions: clear sky.
Class 9.0 TheMingechaursky reservoir in the periodof “water blossom”. C(cl)
= 5.0 µg/l,
C(ms)= 6.0 µg/l. N = 43, H = (300/300/300), Z= (41/48/56). Observation to
nadir. Weather conditions: clear sky.
Class 10.0 The Mingechaursky reservoir in the period of “water blossom”. C(cl)
= 9.0 µg/l,
C(ms)
= 14.0 µg/l. N = 22, H = (300/300/300), Z = (42/48/56). Observation to
nadir. Weather conditions: clear sky.
268 Appendix A: Tables of Radiative Characteristics and Optical Parameters of the Atmosphere
Table A .4. (continued)
Class 11.0 The Tsimlyansky reservoir (water has light green color). There is no data about
C(cl) and C(ms). N
= 6, H = (200/200/200), Z= (37/37/37). Weather conditions:
transparent cloudiness.
Class 12.0 The Volkhov river. There is no data about C(cl) and C(ms). N = 9, H=
(300/300/300), Z = (37/41/49). Observation to nadir. Weather conditions: clear
sky.
Class 13.0 The Don river (water has asphalt color). There is no data about C(cl) and
C(ms). N
= 9, H = (100/100/100), Z = (36/37/38). Observation to nadir. Weather
conditions: ov ercast sky.
Class 14.0 The Black Sea (green water, i.e. the standard color of sea water), there is
no data about C(cl) and C(ms). N
= 23, H= (150/470/500), Z= (25/31/38).
Observations to nadir, from nadir to 45
◦
at azimuth angles 90
◦
and 135
◦
,from
nadir to 22.5
◦
at azimuth angle 180
◦
.Weatherconditions:clearsky.
Class 14.1 The dependence of SBC upon the viewing direction for class 14.0. N
= 3, H =
(150/383/500), Z= (29/32/37). Observations to viewing angle 22.5
◦
at azimuth
angle 0
◦
(the center of Sun glare). Azimuth angle 0
◦
corresponds to flight
direction “to the Sun”, azimuth angle 180
◦
– “opposite the Sun”).
Class 14.2 The dependence of SBC upon the viewing direction for class 14.0. N
= 2,
H
= (500/500/500), Z = (27/28/28). Observations to viewing angles 22.5
◦
and
45
◦
at azimuth angle 45
◦
(“Sun glare”).
Class 14.3 The dependence of SBC upon the viewing direction for class 14.0. N
= 23,
H
= (150/333/566), Z= (25/30/38). Observations to viewing angles from 22.5
◦
till 45
◦
at azimuth angles 90
◦
and 135
◦
;toviewingangle45
◦
at azimuth angle
180
◦
.
∗
There is an archive of spect ra for every class (in a special binary code)
Appendix A: Tables of Radiative Characteristics and Optical Parameters of the Atmosphere 269
Table A .5. Spectral brightness coefficients (SBC) of the watersurface
∗
(continued on next pa ge)
Class, No.
λ (µm)123456789101112131414.114.214.3
0.35
4. 78
1. 51
5. 44
0. 95
4. 53
1. 17
5. 42
1. 16
6. 50
1. 25
4. 34
0. 86
5. 82
0. 75
6. 11
0. 82
7. 03
0. 74
8. 44
1. 33
3. 09
0. 93
6. 97
0. 56
4. 64
1. 39
7. 06
1. 51
19. 04
5. 71
10. 40
3. 12
5. 38
1. 53
0.36
5. 00
1. 73
5. 23
1. 22
4. 37
1. 33
4. 83
1. 45
4. 71
0. 92
4. 55
0. 69
5. 47
1. 10
6. 78
0. 85
7. 95
0. 83
9. 77
1. 57
2. 42
0. 48
7. 00
0. 56
5. 09
1. 24
3. 82
0. 86
11. 46
2. 29
5. 67
1. 13
2. 67
0. 67
0.37
4. 73
1. 66
4. 64
1. 20
3. 98
1. 28
4. 30
1. 39
4. 01
0. 84
4. 38
0. 65
4. 74
0. 94
5. 97
0. 70
7. 10
0. 72
8. 89
1. 42
1. 98
0. 34
6. 90
0. 55
5. 15
0. 95
3. 66
0. 70
11. 43
1. 94
5. 67
0. 96
2. 62
0. 67
0.38
4. 53
1. 56
4. 36
1. 17
3. 84
1. 17
4. 14
1. 31
3. 93
0. 74
4. 26
0. 65
4. 36
0. 49
5. 25
0. 56
6. 39
0. 64
8. 18
1. 30
1. 94
0. 43
6. 91
0. 62
5. 09
1. 12
3. 54
0. 65
11. 69
2. 57
5. 64
1. 24
2. 53
0. 62
0.39
4. 13
1. 38
4. 07
1. 10
3. 56
1. 05
3. 87
1. 26
3. 72
0. 73
3. 95
0. 61
4. 14
0. 35
4. 91
0. 50
6. 14
0. 63
8. 03
1. 27
2. 01
0. 46
6. 99
0. 70
4. 77
1. 10
3. 91
0. 73
13. 93
3. 20
6. 27
1. 44
2. 77
0. 64
0.40
3. 23
0. 99
3. 18
0. 83
2. 85
0. 75
3. 12
0. 92
3. 19
0. 65
3. 14
0. 49
3. 35
0. 41
3. 76
0. 36
4. 81
0. 49
6. 45
1. 01
2. 36
0. 59
7. 04
0. 70
3. 83
0. 96
5. 31
0. 91
19. 89
4. 97
8. 69
2. 17
3. 83
0. 87
0.41
3. 14
0. 82
3. 28
0. 71
3. 01
0. 70
3. 35
0. 90
3. 56
0. 62
3. 45
0. 43
3. 55
0. 58
4. 77
0. 47
6. 30
0. 70
8. 34
1. 21
2. 63
0. 66
6. 89
0. 77
4. 16
1. 04
6. 31
1. 17
25. 42
6. 36
10. 16
2. 54
4. 22
0. 91
0.42
3. 10
0. 78
3. 32
0. 62
3. 14
0. 68
3. 47
0. 85
3. 80
0. 72
3. 66
0. 49
3. 90
1. 06
5. 73
0. 58
7. 71
0. 90
10. 16
1. 42
2. 73
0. 68
6. 58
0. 86
4. 38
1. 09
6. 22
1. 34
25. 68
6. 42
9. 86
2. 47
3. 97
0. 84
0.43
2. 81
0. 69
3. 06
0. 50
2. 97
0. 56
3. 28
0. 69
3. 67
0. 69
3. 50
0. 49
3. 87
1. 05
5. 79
0. 57
7. 98
0. 90
10. 59
1. 42
2. 59
0. 44
6. 46
0. 97
4. 17
0. 71
6. 31
1. 44
26. 73
4. 54
10. 06
1. 71
3. 98
0. 81
0.44
2. 61
0. 64
2. 92
0. 40
2. 83
0. 45
3. 19
0. 58
3. 66
0. 62
3. 36
0. 45
3. 88
0. 92
5. 82
0. 55
8. 21
0. 87
11. 05
1. 41
2. 59
0. 39
6. 52
1. 11
3. 98
0. 60
6. 43
1. 35
28. 19
4. 23
10. 45
1. 57
4. 13
0. 81
0.45
2. 46
0. 58
2. 85
0. 33
2. 76
0. 38
3. 17
0. 50
3. 77
0. 56
3. 28
0. 42
3. 92
0. 83
5. 89
0. 55
8. 49
0. 83
11. 52
1. 39
2. 76
0. 39
6. 43
1. 29
3. 98
0. 56
6. 14
1. 10
27. 60
3. 86
10. 16
1. 42
4. 03
0. 75
0.46
2. 33
0. 53
2. 74
0. 28
2. 68
0. 31
3. 11
0. 43
3. 82
0. 52
3. 23
0. 41
3. 83
0. 71
5. 74
0. 52
8. 40
0. 77
11. 46
1. 32
2. 90
0. 38
6. 02
0. 90
4. 05
0. 53
5. 85
0. 92
26. 14
3. 40
9. 86
1. 28
3. 89
0. 67
0.47
2. 22
0. 48
2. 62
0. 25
2. 60
0. 25
3. 06
0. 37
3. 85
0. 51
3. 18
0. 39
3. 74
0. 60
5. 60
0. 51
8. 28
0. 71
11. 27
1. 21
3. 00
0. 36
5. 21
0. 52
4. 06
0. 49
5. 82
0. 82
25. 26
3. 03
9. 91
1. 19
3. 91
0. 63
0.48
2. 15
0. 45
2. 57
0. 23
2. 57
0. 23
3. 05
0. 34
3. 94
0. 52
3. 17
0. 36
3. 80
0. 56
5. 68
0. 51
8. 48
0. 69
11. 51
1. 17
3. 08
0. 31
4. 20
0. 42
4. 09
0. 41
5. 82
0. 70
24. 71
2. 47
10. 16
1. 02
3. 95
0. 60
270 Appendix A: Tables of Radiative Characteristics and Optical Parameters of the Atmosphere
Table A .5. (continued)
Class, No.
λ (µm)12345678 9 101112131414.114.214.3
0.49
2. 15
0. 44
2. 60
0. 23
2. 60
0. 23
3. 10
0. 34
4. 05
0. 54
3. 25
0. 36
3. 98
0. 60
6. 02
0. 54
9. 05
0. 72
12. 30
1. 20
3. 15
0. 28
3. 52
0. 53
4. 30
0. 39
5. 73
0. 61
24. 32
2. 19
10. 25
0. 92
3. 89
0. 57
0.50
2. 14
0. 44
2. 62
0. 23
2. 63
0. 24
3. 14
0. 34
4. 10
0. 56
3. 35
0. 38
4. 17
0. 66
6. 39
0. 57
9. 70
0. 77
13. 21
1. 24
3. 29
0. 25
3. 27
0. 82
4. 52
0. 36
5. 54
0. 60
23. 86
1. 67
10. 11
0. 71
3. 71
0. 53
0.51
2. 13
0. 43
2. 60
0. 23
2. 64
0. 25
3. 17
0. 34
4. 15
0. 57
3. 46
0. 43
4. 33
0. 70
6. 67
0. 61
10. 22
0. 82
14. 05
1. 32
3. 57
0. 25
3. 25
0. 98
4. 71
0. 38
5. 40
0. 66
23. 93
1. 67
10. 01
0. 70
3. 53
0. 50
0.52
2. 11
0. 42
2. 59
0. 22
2. 65
0. 25
3. 18
0. 33
4. 18
0. 57
3. 60
0. 49
4. 51
0. 73
6. 97
0. 64
10. 75
0. 87
14. 92
1. 40
3. 84
0. 27
3. 35
0. 90
4. 99
0. 36
5. 41
0. 73
24. 61
1. 72
10. 21
0. 71
3. 47
0. 50
0.53
2. 09
0. 41
2. 57
0. 21
2. 65
0. 24
3. 17
0. 31
4. 20
0. 59
3. 74
0. 53
4. 68
0. 75
7. 26
0. 66
11. 28
0. 95
15. 80
1. 50
4. 09
0. 30
3. 41
0. 58
5. 26
0. 37
5. 36
0. 74
25. 13
1. 76
10. 40
0. 73
3. 41
0. 49
0.54
2. 07
0. 40
2. 56
0. 22
2. 65
0. 24
3. 18
0. 31
4. 23
0. 61
3. 90
0. 53
4. 78
0. 75
7. 42
0. 69
11. 61
0. 99
16. 37
1. 58
4. 34
0. 34
3. 41
0. 51
5. 48
0. 38
5. 21
0. 70
25. 55
1. 79
10. 40
0. 73
3. 28
0. 46
0.55
2. 05
0. 38
2. 55
0. 24
2. 67
0. 26
3. 21
0. 31
4. 29
0. 63
4. 06
0. 56
4. 76
0. 72
7. 34
0. 68
11. 65
1. 03
16. 58
1. 60
4. 64
0. 41
3. 41
0. 41
5. 71
0. 40
5. 10
0. 69
26. 63
1. 86
10. 40
0. 73
3. 16
0. 44
0.56
2. 04
0. 38
2. 53
0. 24
2. 70
0. 28
3. 25
0. 31
4. 36
0. 65
4. 23
0. 63
4. 64
0. 66
7. 10
0. 66
11. 40
1. 05
16. 42
1. 60
4. 99
0. 46
3. 36
0. 40
5. 95
0. 47
4. 99
0. 68
28. 06
1. 96
10. 35
0. 72
3. 03
0. 42
0.57
2. 01
0. 37
2. 49
0. 23
2. 70
0. 30
3. 24
0. 32
4. 35
0. 67
4. 36
0. 72
4. 40
0. 60
6. 65
0. 63
10. 83
1. 03
15. 83
1. 60
5. 24
0. 48
3. 14
0. 31
6. 20
0. 50
4. 83
0. 66
29. 26
2. 05
10. 25
0. 72
2. 84
0. 40
0.58
1. 98
0. 37
2. 44
0. 21
2. 68
0. 31
3. 23
0. 32
4. 35
0. 68
4. 46
0. 74
3. 99
0. 53
5. 96
0. 56
9. 85
1. 00
14. 70
1. 58
5. 27
0. 43
2. 87
0. 37
6. 48
0. 52
4. 60
0. 62
30. 47
2. 44
10. 11
0. 81
2. 59
0. 38
0.59
1. 93
0. 36
2. 40
0. 21
2. 64
0. 31
3. 21
0. 32
4. 35
0. 69
4. 52
0. 76
3. 43
0. 44
5. 03
0. 47
8. 41
0. 95
12. 94
1. 59
5. 03
0. 40
2. 73
0. 44
6. 75
0. 54
4. 41
0. 60
32. 36
2. 59
10. 01
0. 80
2. 32
0. 39
0.60
1. 86
0. 35
2. 34
0. 21
2. 57
0. 30
3. 16
0. 32
4. 31
0. 69
4. 50
0. 79
2. 83
0. 34
4. 03
0. 38
6. 74
0. 90
10. 78
1. 59
4. 70
0. 38
2. 69
0. 54
4. 14
1. 26
4. 28
0. 60
34. 05
2. 72
10. 06
0. 80
2. 14
0. 40
0.61
1. 78
0. 32
2. 28
0. 21
2. 51
0. 29
3. 09
0. 31
4. 27
0. 69
4. 44
0. 80
2. 40
0. 27
3. 31
0. 32
5. 45
0. 85
9. 05
1. 61
4. 43
0. 35
6. 97
0. 56
3. 18
0. 79
4. 15
0. 59
35. 06
2. 80
10. 11
0. 81
2. 04
0. 39
0.62
1. 71
0. 31
2. 22
0. 21
2. 45
0. 28
3. 04
0. 32
4. 29
0. 71
4. 43
0. 80
2. 17
0. 24
2. 94
0. 29
4. 77
0. 81
8. 10
1. 58
4. 25
0. 37
7. 00
0. 56
2. 63
0. 52
4. 06
0. 58
36. 26
2. 90
10. 35
0. 83
1. 96
0. 39