GIS Methodologies for Developing Conservation Strategies Part 3 potx
Bạn đang xem bản rút gọn của tài liệu. Xem và tải ngay bản đầy đủ của tài liệu tại đây (205.93 KB, 27 trang )
32 Basil G. Savitsky
and to the management of the public resource (Hassan and Hutchinson 1992).
Conservation and resource management is increasingly interdisciplinary and
interdepartmental in nature. Building the capacity to contribute to and receive
from the rapidly growing body of data is a valuable product.
Implementation of Digital Mapping Technologies in Tropical
Developing Countries
It is useful to evaluate the costs and constraints in implementing digital mapping
technologies. Successful applications have been demonstrated in the utilization
of image analysis, GIS, and GPS (table 3.1). The three technologies have been
applied in measurement of deforestation, identification of suitable habitat for
various species, and a variety of protected area wildlife management issues.
However, the initial investment in advanced mapping technologies is high, and
many remote sensing technology transfers have failed to address the unique
T
ABLE
3.1 Examples from the Literature Demonstrating Applications in Image
Analysis, GIS, and GPS
Technology Application Citation
Image analysis Measure deforestation Fearnside (1993)
Tucker, Holben, and Goff (1984)
Identify habitat
Crane Herr and Queen (1993)
Sage grouse Homer et al. (1993)
Snow leopard Prasad et al. (1991)
GIS Protected areas Campbell (1991)
McKay and Kaminski (1991)
Parker et al. (1991)
Pearsall (1991)
Riebau et al. (1991)
Wildlife management
Bear Clark, Dunn, and Smith (1993)
Holt (1991)
Elephant Falconer (1992)
Cougar Gagliuso (1991)
Ecosystem modeling Curran (1994)
Johnson (1993)
Deforestation trends Ludeke, Maggio, and Reid (1990)
GPS Rainforest populations Wilkie (1989)
Forest management Gerlach (1992)
Thee (1992)
Bergstrom (1990)
Park resource inventory Lev (1992)
Fletcher and Sanchez (1994)
Habitat mapping Wurz (1991)
Digital Mapping Technologies 33
conditions of the recipient country (Forster 1990). The reasons for failure in
technology transfer within developed countries are similar to the causes of
failure of technology transfer in tropical developing countries, but the quality of
conditions in tropical developing countries makes technology implementation
more difficult.
The implementation of an information technology such as GIS or image
analysis can be evaluated along the three major components of the information
system—hardware and software, data, and staff (figure 3.1). The concept of the
GIS as a triangle was developed by the author to stress the balance required in
investments and activities in each of the three components in a well-functioning
information system. A successful implementation plan should address all three
components. Excessive focus often is placed upon hardware and software consid-
erations, particularly if competing vendors are involved. Often, agencies are
F
IG.
3.1 Three major components of an information system. Implementa-
tion of an information system should be balanced along each component.
The presence of any two components should produce the third component.
34 Basil G. Savitsky
eager to acquire the hardware and software, and vendors are eager to close the
sale. If the other two system components are not realistically evaluated at this
stage, it is possible that an agency will be left with a powerful computer-
processing capability and insufficient funds to hire skilled staff or to run projects.
The third component will naturally evolve in a system where two of the
components are well-managed and appropriately funded. For example, an
agency can make an investment in hardware and software and then make a
parallel investment in trained staff. Staff who are given a designated time period
to provide a return on the investment of the initial purchase and to cover a
specified percentage of their salaries should be able to leverage their available
hardware and their free time to start profitable projects.
There are alternative combinations of the presence of only two positive
components in the system triangle. Talented staff who have a project or are
handling data which would benefit from the acquisition of hardware and soft-
ware will either purchase additional resources through the project or utilize
existing capabilities under entry-level conditions. Successful project performance
will provide justification for advances in hardware and software in future activi-
ties.
Also, consider the presence of sufficient equipment and a project that needs
to be performed. An agency will be forced to allocate staff for the project if it is
to be completed. The level of importance of the project will determine the level
of staff commitment. It is impossible to achieve successful project implementation
without appropriate staff commitment. If full-time staff cannot be assigned to the
project, then at least 50 percent of a staff person’s time should be designated
for handling all of the issues associated with data manipulation and system
maintenance. Part-time staff cannot devote sufficient attention to the complexities
of managing an information system or to the data requirements of a successful
project. An agency that cannot assign someone at least half-time to the system
should contract the work to an outside party in order to accomplish the objectives
of the project.
When systems only exhibit one strong component, then it is unlikely that
they will succeed. An example of this condition resides in an administrative unit
which invests in the hardware and software or receives a grant that provides the
same. Insufficient allocation of trained staff to use the system will result in poor
quality of data or inferior project performance. Typically, a project that includes
a set of application objectives in addition to system implementation does not
allocate sufficient time for the system implementation. It is unrealistic to expect
even a trained staff to garner funds for the start-up costs of hardware and
software as well as salary costs. If it were necessary to invest initially in only one
of the three system components, then an investment in the best available staff
would have the most probable success.
The balance of this section will address current trends and developments in
Digital Mapping Technologies 35
each of the system components and particular conditions of the three compo-
nents in relation to tropical developing countries.
Hardwar e a nd Software
Hardware costs for both personal computers and workstations have been declin-
ing steadily during recent years. This trend, combined with the rapid increases
in computer processing speed, has dramatically benefited the GIS market. Geo-
graphic data are voluminous and require several unique hardware and software
adaptations for data entry, processing, and output. These adaptations are referred
to as hardware peripherals and include digitizers, scanners, and plotters. With a
healthy GIS market, these peripherals have become more sophisticated, easier to
use, and less expensive. The GIS market also has supplied a variety of hardware
and software configurations from which to choose. Although increased choices
provide more opportunities for the end user, the choices are often overwhelming
for those entering the digital mapping arena.
Three guidelines facilitate the decision processes associated with selecting
hardware and software. First, a low-cost information system, such as one based
upon a personal computer (PC), has low risk in terms of investment and high
returns in staff training. Software such as IDRISI is PC-based and has a short
learning curve which enables the generation of faster output from a project.
Networked and stand-alone workstations have more sophisticated requirements
for implementation than PCs. Software such as ARC/INFO which operates on
the more advanced hardware systems tends to have a steep and long learning
curve. A successful PC implementation may develop into needing more ad-
vanced hardware, but the growth should be balanced along the three system
components.
The second guideline in the selection of hardware and software is to evaluate
the quality of support. If a hardware or software company is a leader in its field,
then its technical support infrastructure is likely to be more accessible and
informative than that of a small company. This consideration is particularly
significant if the unit is geographically remote. Hardware support and mainte-
nance are critical. One dysfunctional element in the system can severely impair
the entire system. If assurance cannot be obtained that hardware will be serviced
or replaced rapidly, then an alternative hardware selection should be considered.
Third, a wide variety of peripheral hardware devices should be considered
with full awareness of the temporal limitations of all the devices. Whichever data
entry, storage, display, or output device is selected, it is likely to become outdated
technology or insufficient for growing needs in a short period of time. It is
advisable for management staff to accept this fact at the outset and solicit the
recommendations of staff rather than limiting the ability of the technical staff to
keep the system current. One benefit of this phenomenon in information systems
is that a unit can start out small, knowing that it will be upgrading almost
36 Basil G. Savitsky
continuously. Another benefit is that outgrown technology can be maintained as
backup equipment or it can be used by entry-level personnel or students.
Data
GIS databases are increasing in availability. The United States has benefited from
the government publication of 1990 census data which have been distributed
along with 1:100,000 scale road and stream data for the continental United
States (Sobel 1990). The provision of a consistent national digital framework has
allowed GIS users to have a readily available base map upon which to build.
Numerous digital geographic databases have been published in recent years and
are available over the Internet. The availability of high-quality satellite data also
has facilitated numerous environmental mapping applications. Satellite imagery
is a particularly rich data source because the availability of historic data from the
1970s enables the creation of a consistent baseline from which to perform change
detection.
Although there are more data available in the public domain or at a nominal
cost, satellite data prices have increased over the last twenty years. Further, the
need to add specific information layers to existing data sources adds to the data
costs of a given project in salary time for data entry. Also, field efforts are
typically required in conjunction with digital mapping applications. Walklet
(1991) suggests that data costs can account for as much as 80 percent of total
information system costs over the life of the system.
Collection of traditional and digital data in the tropics has been constrained
by the number of scientists working there, the economic realities associated with
the fact that many tropical countries are developing countries and thus less
equipped to fund database construction, and the physical difficulty of collecting
data for remote areas. The first two constraints are beyond the arena of digital
mapping technologies, but the third constraint has been addressed by the utiliza-
tion of satellite data in mapping remote areas (Sader, Stone, and Joyce 1990;
Malingreau 1994).
Satellite image processing or remote sensing has provided the capability to
map some areas of the world that were difficult and more expensive to chart
using traditional techniques. Unfortunately, there is not as much satellite imagery
available for the tropical regions of the world as is available for the temperate
zones because there is more cloud cover present in the tropics. In most cases,
cloud-free images can be pieced together, but the process requires use of multiple
images often temporally distinct by as much as two to three years. Even if the
cost of data acquisition can be reduced through data grants or data-sharing
mechanisms, the processing time remains high because of the need to handle
more images. In many final image analysis products, areas under cloud cover
remain unmapped, and reliance is placed upon combining aerial photographic
data sources or other previously mapped data with the output from the image
analysis to map these areas.
Digital Mapping Technologies 37
The use of radar imagery has long held promise for use in the tropics since it
can be collected day or night and has the ability to penetrate cloud cover
(Lillesand and Kiefer 1994). However, radar data are less readily available than
other satellite data sources. Further, radar has unique processing requirements
for which many image analysts are not trained. The advent of radar sensors in
the planned EOS platforms should alleviate the data availability and cost con-
straints, but the international community must allocate resources to training in
radar data processing.
Staff
The high demand for professionals trained in GIS and image analysis has been
constant as the digital mapping industries have grown. The supply of skilled
analysts is more acute in the tropical developing countries. The phenomenon of
“brain drain,” where individuals who gain advanced training pursue opportuni-
ties outside their home countries, often limits the ability of a country to increase
its technical capacity. In a GIS workshop held in San Jose
´
, Costa Rica, for natural
resource managers (March 6–7, 1995), the most commonly listed weakness in
current GIS operations were staff shortages and inadequacies in training pro-
grams.
The issue of staff may be better understood in the tropics as an issue of
training because it is likely that a resource professional already on staff will be
given additional digital mapping responsibilities. In this case it is important to
realize that in order for the individual to perform digital mapping functions well,
several conditions should be met. The percentage of time allocated for digital
mapping functions should be clearly specified if it is necessary for it to be less
than 100 percent. The tasks associated with mapping technologies are so varied
that it is difficult for an individual to be productive if he or she also is assigned a
variety of unrelated functions.
The digital mapping staff should not be perceived as the hardware experts
for the agency simply because they are proficient in hardware concerns. The
digital mapping staff should have expertise in hardware, software, and the
specific set of applications (forestry, soils, etc.). It is rare that one individual is
skilled in all three areas. The software expertise may reside with a hardware
expert or with an applications expert or be shared by both. It is difficult for an
applications professional to remain current in a suite of hardware concerns, and
it is unrealistic to expect a hardware professional to be skilled in an applications
area. If possible, two people should fill complementary roles.
Ample support should be provided to the staff. The support may be in the
form of additional compensation, discretionary budget to acquire the resources
they deem necessary to perform their job, or in permission to travel to attend
conferences or training courses. The frustration level of digital mapping staff can
be high, and any effort directed to making their job easier will increase the chance
of retaining valuable staff. The significance of the role of the staff component in
38 Basil G. Savitsky
computer systems should not be underestimated, particularly in computer map-
ping where the demand for trained professionals exceeds the supply.
One approach to maximizing investment in training the applications staff in
digital mapping technologies is to select a familiar development path and build
around that technology. For example, staff who are already performing aerial
photo interpretation may be able to gain the necessary skills in image analysis in
a time period shorter than the two semesters which would normally be required.
Likewise, staff who are already collecting field data will be able to be trained in
the use of GPS receivers more effectively than office staff. GPS training can be
obtained in less than a week. An agency that develops either image analysis or
GPS capability can then invest in building GIS capacity. Also, it is possible for an
agency to contribute to collaborative project efforts between agencies and allow
other parties to address the more complex issues associated with GIS. The
collaborative approach allows staff in the agency developing GIS capacity to
gain exposure to issues of database design, data integration and analysis, and
cartographic output. Development of staff abilities through partnerships with
other agencies will enable those staff to make recommendations on GIS develop-
ment based upon their direct experience.
If agencies are able to accept their constraints and to identify where areas of
interagency cooperation could help all parties to maximize limited resources,
then there is a possibility that data sharing and collaborative training programs
will enable those agencies to balance their investments along all three compo-
nents of information systems.
References
Bergstrom, G. C. 1990. GPS in forest management. GPS World 1(5): 46–49.
Campbell, K. L. I. 1991. Using GIS for wildlife conservation in Tanzania: Prospects and
possibilities. Proceedings, Resource Technology ’90, 2nd International Symposium on Ad-
vanced Technology in Natural Resource Management, 265–74. Washington, D.C.: American
Society for Photogrammetry and Remote Sensing.
Clark, J. D., J. E. Dunn, and K. G. Smith. 1993. A multivariate model of female black bear
habitat at use for a GIS. Journal of Wildlife Management 57: 519–26.
Cowen, D. J. 1988. GIS versus CAD versus DBMS: What are the differences? Photogrammet-
ric Engineering and Remote Sensing 54: 1551–54.
Curran, P. J. 1994. Attempts to drive ecosystem simulation models at local to regional
scales. In G. Foody and P. Curran, eds., Environmental remote sensing from regional to
global scales, 149–66. Chichester, Eng.: Wiley.
Environmental Systems Research Institute (ESRI). 1993. Digital chart of the world (CD-ROM
Cartographic Database). Redlands, Calif.: ESRI.
Falconer, A. 1992. Geographic information technology fulfills need for timely data. GIS
World 5(7): 37–41.
Digital Mapping Technologies 39
Fearnside, P. M. 1993. Deforestation in Brazilian Amazonia: The effect of population and
land tenure. Ambio 22: 537–45.
Fedra, K. 1993. GIS and environmental modeling. In M. F. Goodchild, B. O. Parks, and L.
T. Steyaert, eds., Environmental modeling with GIS, 35–50. New York: Oxford University
Press.
Fletcher, M. and D. Sanchez. 1994. Etched in stone: Recovering Native American rock art.
GPS World 5(10): 20–29.
Forster, B. 1990. Remote sensing technology transfer: Problems and solutions. Proceedings
of the Twenty-third International Symposium on Remote Sensing of the Environment 1:209–
17. Ann Arbor, Mich.: Environmental Research Institute of Michigan.
Gagliuso, R. A. 1991. Remote sensing and GIS technologies—an example of integration in
the analysis of cougar habitat utilization in Southwest Oregon. In M. Heit and A.
Shortreid, eds., GIS applications in natural resources, 323–30. Fort Collins, Colo.: GIS
World.
Gerlach, F. L. 1992. “GPS/GIS in forestry.” Paper presented at the Second International
Conference on GPS/GIS. Newport Beach, Calif.
Goodchild, M. F. 1993. The state of GIS for environmental problem-solving. In M. F.
Goodchild, B. O. Parks, and L. T. Steyaert, eds., Environmental modeling with GIS, 8–15.
New York: Oxford University Press.
Hassan, H. M. and C. Hutchinson. 1992. Natural resource and environmental information for
decisionmaking. Washington, D.C.: The World Bank.
Herr, A. M. and L. P. Queen. 1993. Crane habitat evaluation using GIS and remote sensing.
Photogrammetric Engineering and Remote Sensing 29(10): 1531–38.
Holt, S. 1991. Human encroachment on bear habitat. In M. Heit and A. Shortreid, eds., GIS
applications in natural resources, 319–22. Fort Collins, Colo.: GIS World.
Homer, C. G., T. C. Edwards Jr., R. D. Ramsey, and K. P. Price. 1993. Use of remote sensing
methods in modelling sage grouse winter habitat. Journal of Wildlife Management 57:
78–84.
James, P. E. and G. J. Martin. 1981. All possible worlds: A history of geographical ideas. New
York: Wiley.
Jensen, J. R. 1995 (2d ed.). Introductory digital image processing: A remote sensing perspective.
Englewood Cliffs, N.J.: Prentice-Hall.
Johnson, L. 1993. Ecological analyses using GIS. In S. B. McLaren and J. K. Braun, eds.,
GIS applications in mammalogy, 27–38. Norman: Oklahoma Museum of Natural History.
Lev, D. 1992. Park management and GPS. GPS World 3(5): 35.
Lillesand, T. M. and R. W. Kiefer. 1994. Remote sensing and image interpretation. New York:
Wiley.
Ludeke, A. K., R. C. Maggio, and L. M. Reid. 1990. An analysis of anthropogenic deforesta-
tion using logistic regression and GIS. Journal of Environmental Management 31: 247–59.
Malingreau, J. P. 1994. Satellite-based forest monitoring: A review of current issues. In
Tropical forest mapping and monitoring through satellite imagery: The status of current
international efforts. Arlington, Va.: USAID Environment and Natural Resources Infor-
mation Center.
McKay, G. W. and E. Kaminski. 1991. The GIS at Yellowstone National Park—develop-
ment, acquisition, and applications for resource management. Proceedings, Resource
Technology ’90, 2nd International Symposium on Advanced Technology in Natural Resource
Management, 400–407. Bethesda, Md.: American Society for Photogrammetry and Re-
mote Sensing.
40 Basil G. Savitsky
Parker, C. R., K. Langdon, J. Carter, S. Nodvin, and H. Barrett. 1991. Natural resources
management and research in Great Smoky Mountains National Park. Proceedings,
Resource Technology ’90, 2nd International Symposium on Advanced Technology in Natural
Resource Management, 254–64. Bethesda, Md.: American Society for Photogrammetry
and Remote Sensing.
Pearsall, S. 1991. Advanced technologies and nature reserves in western Samoa. Proceed-
ings, Resource Technology ’90, 2nd International Symposium on Advanced Technology in
Natural Resource Management, 221–30. Bethesda, Md.: American Society for Photog-
rammetry and Remote Sensing.
Prasad, S. N., R. S. Chundawat, D. O. Hunter, H. S. Panwar, and G. S. Rawat. 1991. Remote
sensing snow leopard habitat in the trans-Himalaya of India using spatial models
and satellite imagery—preliminary results. Proceedings, Resource Technology ’90, 2nd
International Symposium on Advanced Technology in Natural Resources Management, 519–
23. Bethesda, Md.: American Society for Photogrammetry and Remote Sensing.
Riebau, A. R., W. E. Marlatt, S. Coloff, M. L. Sestak. 1991. Using microcomputers for
wilderness management: The wildland resources information data system (WRIDS).
Proceedings, Resource Technology ’90, 2nd International Symposium on Advanced Technology
in Natural Resource Management, 231–43. Bethesda, Md.: American Society for Photog-
rammetry and Remote Sensing.
Robinson, A., R. Sale, and J. Morris. 1978. Elements of cartography. New York: Wiley.
Sader, S. A., T. A. Stone, and A. T. Joyce. 1990. Remote sensing of tropical forests: An
overview of research and applications using non-photographic sensors. Photogrammet-
ric Engineering and Remote Sensing 56: 1343–51.
Sieber, R. and L. L. Wiggins. 1995. Tour the World Wide Web: A look at three GIS sites.
GIS World 8(6): 70–75.
Sobel, J. 1990. Principal components of the Census Bureau’s TIGER file. In D. J. Peuquet
and D. F. Marble, eds., Introductory readings in geographic information systems, 112–19.
Bristol, Penn.: Taylor and Francis.
Star, J. and J. Estes. 1990. Geographic information systems: An introduction. Englewood Cliffs,
N.J.: Prentice-Hall.
Steyaert, L. T. 1993. A perspective on the state of environmental simulation modeling. In
M. F. Goodchild, B. O. Parks, and L. T. Steyaert, eds., Environmental modeling with GIS,
16–30. New York: Oxford University Press.
Thee, J. R. 1992. GPS tames the jungle. GPS World 3(5): 34.
Thoen, B. 1994. Access the electronic highway for a world of data. GIS World 7(2): 46–49.
Tucker, C. J., B. N. Holben, and T. E. Goff. 1984. Intensive forest clearing in Rondonia,
Brazil, as detected by satellite remote sensing. Remote Sensing of Environment 15:
255–61.
Walklet, D. C. 1991. The economics of GIS: Understanding the economic motivation and
requirements which justify the use of GIS as a practical solution for environmental
and resource planners. Proceedings, GIS/LIS, 643–47. Atlanta, Ga.
Wilkie, D. S. 1989. Performance of a backpack GPS in a tropical rain forest. Photogrammetric
Engineering and Remote Sensing 55: 1747–49.
Wurz, B. E. 1991. National treasures: GPS helps preserve a bald eagle habitat. GPS World
2(3): 28–33.
4
GIS
Basil G. Savitsky
There are numerous definitions of GIS. Maguire (1991) lists eleven different
definitions. Some place emphasis on the computer processing or analytical proce-
dures, such as Burrough (1986:6), who defines GIS as a “set of tools for collecting,
storing, retrieving at will, transforming, and displaying spatial data from the
real world for a particular set of purposes.” Other definitions emphasize the
institutional and project context in which the GIS hardware and software reside
(Dickinson and Calkins 1988). The discussion in chapter 3 revolving around the
information system triangle (figure 3.1) uses this broader approach to defining
GIS.
As sufficient attention has been allocated to the system components of GIS in
the previous chapter, this chapter will focus on the extraction of information
from geographic data. Emphasis is given to the type of information produced
through GIS and to the types of data stuctures which are commonly employed.
Information Extraction and Synthesis
There is a decision-making continuum which ranges from data to information to
knowledge (figure 4.1). The policy community is dependent upon the scientific
community to provide meaningful information so that those in power can make
intelligent decisions. The ability of the decision-maker to link various pieces of
information with his or her own personal and political experience regarding an
issue defines the level of knowledge achieved about the issue. There is often
frustration on the part of scientists who feel that they have successfully provided
a governing body with information only to see that information mixed with
political pressures, media presentation of anecdotal cases, and the opinions of
42 Basil G. Savitsky
“uninformed” individuals. Nevertheless, underpinning the motivation of scien-
tists in conservation, resource management, and environmental protection disci-
plines is the belief that the provision of information to the policy community is
critical to the future of our natural resources.
There are numerous types of information used in bridging science and policy,
such as statistics and tabular or graphic presentations of data, but the utility of
the map is particularly powerful in its ability to convey concurrently a variety of
spatial relationships. The spatial nature of information required to make deci-
sions in resource management makes GIS a tool that is commonly utilized. It
should be noted that just as policymakers synthesize a variety of information
sources to develop knowledge, information is based upon the synthesis of data.
In fact, one distinction between data and information is the role that communica-
tion plays. Data need to be interpreted before they can be made useful. Once a
pattern within the data is identified and summarized, then information is ex-
tracted from the data, and that information can be conveyed.
It also should be noted that the scientific community is often unable to supply
the policy community with information because critical data are missing or of
insufficient quality. Often data collection programs are funded as a result of this
recognition. One current example is the advent of increased satellite monitoring
programs to supply researchers with data on global environmental changes such
as biodiversity loss and global warming.
The manner in which GIS has been used in support of natural resource
management and other spatial applications has evolved over three phases (Ma-
guire 1991, citing Crain and MacDonald 1984). The primary focus in the first
F
IG.
4.1 A decision-making continuum
GIS 43
phase is inventory, and spatial query typically is limited to simple operations,
mainly retrieval. Complex analytical operations, such as suitability analyses,
develop during the second phase. The hallmark of the third phase is the capabil-
ity to perform decision support. Maguire (1991) suggests that new GIS implemen-
tations should allow three to five years for each of the first two phases before
expecting an institutional system to have the GIS experience necessary to fully
utilize the management potential of GIS. Eastman et al. (1995) describe a series of
tools which have been developed to enhance the decision-making role of GIS,
thus, holding potential to shorten the length of the GIS implementation cycle.
It is useful to distinguish between the various levels of analytical capacity in
the constantly growing body of GIS and related software packages. The simplest
packages in the family of GIS software perform computer mapping. At this level,
maps are entered, stored, retrieved, displayed, and output, but they are not used
analytically. An example of the computer mapping level is the digital atlas or the
electronic map file. A more sophisticated level of mapping is achieved when a
linkage is present in the software between the geographic data elements and a
separate database. At this level, specific points, lines, or polygons can be selected
according to criteria defined in the database. Demographic analysis and tax
parcel mapping can be done with this level of software. The industry of facilities
management (e.g., telephone, cable, electric, and gas) realizes significant savings
by using computer-assisted drafting / computer-assisted mapping (CAD /CAM)
software. However, because they are not used to create new information, none of
these digital mapping software packages can be said to be a GIS. A GIS is able to
perform a variety of spatial operations that are useful to identify relationships
between the geographic elements within the computer map. Likewise, a GIS can
be used to combine data from two or more maps to generate a new map or set of
maps. The types of spatial modeling or decision support functions included
varies from one GIS software package to another. Some GIS packages include
image processing capability, just as some image analysis packages include vari-
ous GIS functions. Careful examination of the functions present in a suite of
software packages is recommended prior to selecting a specific package. This
process is greatly facilitated by a clear definition of the user’s needs. The more
effort that is placed in the design of a GIS, the greater the probability of a
successful implementation.
The growing popularity of GIS in recent years is due to the numerous benefits
that it offers. Even at the simplest level of computer mapping implementation,
mapped data are archived and retrieved more efficiently than their paper coun-
terparts. Paper maps are subject to damage and wear, and digital storage offers
historic data virtually eternal life. A digital map can be updated by changing
only the features that have changed.
The more sophisticated levels of GIS software offer additional benefits. At a
very basic level, tabulation by area of individual classes within a file is inherent
to the data structure and thus can be performed almost instantaneously. Like-
44 Basil G. Savitsky
wise, the ability to integrate data from variable source scales is not a trivial
contribution. GIS has been used as a tool to facilitate interdisciplinary research
because various types of maps from disparate disciplines can be synthesized
through map overlay. The superimposition of map files from two or more dates
for the same area can be used to identify and quantify change. Numerous
geographic models have been developed to forecast demands, project change,
identify optimal locations, and otherwise enhance planning and management
activities.
Data Structures
The major categorization of GIS software is in the data structure utilized by the
software for spatial analysis. Raster data are stored in an array of rows and
columns of cells with each cell holding a single value characterizing all of the
area within that cell. Image data collected by satellites are a special type of raster
data. Vector data are stored as a series of points, lines, and polygons with each
element having unique identifiers that serve to link the geographic elements to
attribute data.
In a raster database the geographic coordinate of every cell is inherently
stored as a distance function, calculated by multiplying the spatial resolution of
the cell (e.g., 100 meters) by the x and y distance between the origin (1,1) and the
row and column position of the cell (e.g., 2003,45). By storing only the coordinate
of position 1,1, the position of 2003,45 is known to be 200,300 meters east of 1,1
and 4,500 meters south of 1,1. In a vector database, x,y geographic coordinates
are stored for every point element, for every point in a line segment where
direction changes, and for a labeling point within every polygon.
Data entry techniques for vector-based GIS include drafting maps electroni-
cally on digitizing tablets and the collection of field coordinates using a GPS
receiver. Data entry techniques for raster-based systems include scanners (of
which facsimile machines and satellites are both a type) and transfer of vector
data to a raster format. The output of both raster and vector maps can be sent to
most devices including laser writers, ink-jet printers, sublimation dye printers,
and electrostatic plotters. Pen plotters are conducive for use with vector data.
Eastman (1995) contrasts the strengths and weaknesses of vector and raster
structures along six factors. These are summarized in table 4.1. Users requiring
maplike output, network analysis, or repeated database query will be inclined to
utilize a GIS with a vector data structure. Users who utilize continuous data
sources such as elevation data or satellite imagery or users who regularly per-
form context analysis will require a GIS with a raster data structure. Most users
need to utilize vector-based systems at some times and raster-based systems in
other instances. Many software packages offer a blend of capabilities, but the
GIS 45
T
ABLE
4.1 Strengths and Weaknesses of Vector and Raster Data Structures
Vector Raster
Feature-oriented Space-oriented
Efficient storage of boundaries only Data-intensive
“Maplike” “Image-like”
Geometry of spatial relationships is complex Simple relational geometry
Network analysis Numerous spatial analyses
Strong in database query Strong in analysis of continuous data
(source: Eastman 1995)
data strucure and analytical capabilities are either raster or vector. A GIS that
includes both raster and vector capabilities usually maintains its secondary capa-
bility in the display mode as opposed to the analytical mode.
GIS as a Decision-making Tool in Developing Countries
Regardless of the data structure employed, GIS offers the resource manager the
ability to bring together a variety of types of maps into one system to facilitate
the processes of decision making about the resource base. The logic present in
almost all GIS analyses is the logic of map overlay. New information, such as
suitability ranking, is created through the intersection of certain features when
two or more maps that are geographically referenced are digitally superimposed.
It also is possible to weigh more heavily the factors associated with some map
layers than others, thus creating different outcomes based upon the selection of
the weighting scheme. The objectivity associated with the GIS instrument has
potential in providing rational information to the often politicized arena of
planning, but caution needs to be exercised in documenting the subjective deci-
sions made in selecting the weights. An example of a weighted GIS analysis is
provided in chapter 9 of this text.
Examples of such weighted linear combinations abound in the GIS literature.
However, research on the selection and effectiveness of various weighting
schemes is young. Eastman et al. (1993) describe several cases and a variety of
decision operations using a raster GIS. They contrast the simple process of
identifying geographic areas having the highest suitability to maximize a single
objective (conservation as an example) with the more complex process of allocat-
ing spatial resources to meet multiple objectives (i.e., forest reserve use for
conservation, recreation, and timber harvesting). When multiple objectives are
in conflict with each other rather than complementary (i.e., conservation and
development), then four possible outcomes are possible: areas of high suitability
to both objectives, areas of low suitability for both objectives, and areas of high
suitability for only one of the objectives (Eastman et al. 1993). The conflict areas
46 Basil G. Savitsky
when spatially indicated on a map depicting areas of all four decision outcomes
can be helpful in informing what must ultimately be a political decision. Know-
ing the contextual information, specifically where the conflict areas are in relation
to both of the regions of high suitability, is a first step in providing an objective
and consistent framework for communication toward compromise or conflict
resolution. Additionally, specific data regarding the number of hectares in each
of the four categories may facilitate determination of areal thresholds to be
attained in the division of the conflict areas.
Another area of GIS research which requires attention is the feasibility of
the technology in international development. Toledano (1997) and Auble (1994)
demonstrate some of the complexities in such development issues as local (com-
munity) participation, translation of community knowledge into a GIS, and
building GIS capacity from the bottom up. Taylor (1991) provides a review and
critique of GIS technology transfer from developed to developing countries.
Although GIS is perceived as having potential in being successfully employed in
resolving development issues, too much of the international GIS work is being
done by North American and European professionals rather than by the nation-
als in the developing countries.
It is argued that current developments in GIS are primarily technology-
driven and that such an approach has limited relevance to the problems of
development in the countries of Africa, Asia, and Latin America. GIS technol-
ogy is not scientifically objective and value free. It is an artifact of industrial
and post-industrial society. Its structures, technologies and applications are
products of the needs of these societies. If it is to be used in the context of
development then it must be introduced, developed, modified and controlled
by indigenous people who understand the social, economic and political
context of the situation as well as the technical capabilities of GIS. This may
involve some quite different GIS configurations and solutions from those
already successful in the developed nations. It poses special problems of
technology transfer and education and training. (Taylor 1991:71)
Although development problems are different in many ways from conserva-
tion issues, most of the issues related to technology transfer remain the same.
Further, it is becoming more and more difficult to deal with environmental and
development issues independently. The extent to which the potential of GIS is
actualized by the scientific communities in developing tropical nations may very
well be an indicator of the extent to which those nations are able to conserve
their environmental resources and manage their economic development.
References
Auble, J. 1994. Leveling the GIS playing field: Plugging in non-governmental organiza-
tions. Proceedings, AURISA, Sydney, Australia.
GIS 47
Burrough, P. A. 1986. Principles of geographical information systems for land resources assess-
ment. Oxford: Clarendon Press.
Crain, I. K. and C. L. MacDonald. 1984. From land inventory to land management.
Cartographica 21: 40–46.
Dickinson, H. and H. W. Calkins. 1988. The economic evaluation of implementing a GIS.
International Journal of Geographical Information Systems 2: 307–27.
Eastman, J. R. 1995. IDRISI for Windows student manual. Clark Labs for Cartographic
Technology and Geographic Analysis. Worcester, Mass.: Clark University.
Eastman, J. R., J. P. Weigen, A. K. Kyem, and J. Toledano. 1995. Raster procedures for
multi-criteria / multi-objective decisions. Photogrammetric Engineering and Remote Sens-
ing 41: 539–47.
Eastman, J. R., P. A. K. Kyem, J. Toledano, and W. Jin. 1993. GIS and decision making. Vol. 4,
UNITAR explorations in GIS technology. Geneva, Switzerland: UN Institute for Training
and Research.
Maguire, D. J. 1991. An overview and definition of GIS. In D. J. Maguire, M. F. Goodchild,
and D. W. Rhind, eds., Geographical information systems: Principles and applications, 9–20.
New York: Longman Scientific and Technical.
Taylor, D. R. F. 1991. GIS and developing nations. In D. J. Maguire, M. F. Goodchild, and
D. W. Rhind, eds., Geographical information systems: Principles and applications, 71–84.
New York: Longman Scientific and Technical.
Toledano, J. 1997. The ecological approach: An alternative strategy for GIS implementa-
tion. Ph.D. diss., Clark University, Worcester, Mass.
5
Image Analysis
Basil G. Savitsky
This chapter provides a general background on the utilization of satellite imag-
ery in tropical habitat mapping. The introductory section covers basic concepts
in image analysis that are prerequisite to the content covered in the balance of
the chapter. The second section provides a review of the literature on the habitat
mapping capability of a variety of sensor systems. The third section covers the
utility of satellite imagery in national and regional conservation mapping efforts
in the tropics.
Basic Concepts in Image Analysis
Remotely sensed data include a variety of data sources that are defined from the
range of the spectrum of electromagnetic radiation. Aerial photography is used
to capture reflective signals from the visible and near-infrared portion of the
spectrum. Most digital scanners operate in similar portions of the spectrum.
Thermal and radar sensor systems are sensitive to a different portion of the
energy spectrum.
Remotely sensed data provide an operational GIS with timely and synoptic
data. Image analysis techniques are commonly utilized to perform regional vege-
tation mapping and to update existing vegetation maps.
The utility of a sensor system for the detection of surface phenomena must
be assessed along four dimensions: spatial resolution (area or size of feature that
can be identified), spectral resolution (number and width of electromagnetic
bands for which data are collected), radiometric resolution (detector sensitivity
to various levels of incoming energy), and temporal resolution (frequency of
satellite overpass) (Jensen 1995). The four satellite sensors that are addressed in
Image Analysis 49
this chapter are (in decreasing order of spatial resolution) Advanced Very High
Resolution Radiometer (AVHRR), Landsat Multispectral Scanner (MSS), Landsat
Thematic Mapper (TM), and Satellite pour l’Observation de la Terre (SPOT). The
spatial, spectral, temporal, and radiometric resolution of each sensor are listed in
table 5.1.
Airborne and satellite digital sensors collect and store data values for discrete
units of the surface of the earth. A scene is composed of a large matrix of these
cells. Each cell is referred to as a picture element, or pixel, and may correspond
to a square meter, hectare, or square kilometer, depending on the sensor. The
spatial resolution of the sensor is usually expressed as the length of one side of
the cell. AVHRR has a spatial resolution of 1.1 kilometer (Kidwell 1988); MSS
resolution is 79 meters; TM is 30 meters; and multispectral SPOT is 20 meters
(Jensen 1995).
The spectral resolution of a sensor refers to its ability to capture data in a
certain portion or band of the electromagnetic spectrum. The spectral resolution
of AVHRR is five bands; MSS has four bands; SPOT has three bands; and TM has
T
ABLE
5.1 Spatial, Spectral, Temporal, and Radiometric Resolution of Four Sensors
Resolution
Spectral Radiometric
Sensor System Spatial (bandwidth in micrometers) Temporal (brightness values)
SPOT
Panchromatic 10 m 0.51–0.73 11–26 days 0–255
Multispectral 20 m Three bands
0.50–0.59
0.61–0.68
0.79–0.89
TM 30 m Seven bands 16 days 0–255
0.45–0.52
0.52–0.60
0.63–0.69
0.76–0.90
1.55–1.75
2.08–2.35
120 m 10.4–12.5
MSS 79 m Four bands 16–18 days 0–63
0.5–0.6
0.6–0.7
0.7–0.8
0.8–1.1
AVHRR 1.1 km Five bands daily 0–255
0.58–0.68
0.725–1.10
3.55–3.93
10.5–11.3
11.5–12.5
sources: Kidwell (1988) for AVHRR; Jensen (1995) for SPOT, TM, and MSS.
50 Basil G. Savitsky
seven bands. Sensor bandwidth refers to the range of energy units recorded by a
sensor. Most sensor systems have several sensors on board, which results in
concurrent data collection across multiple bands. For example, all Landsat sen-
sors have had a green and a red band and at least two infrared bands. The
Landsat TM sensors have a blue band and infrared bands additional to the MSS
sensors. Visible energy has wavelengths of 0.4 to 0.7 micrometers, near-infrared
energy has wavelengths of 0.7 to 1.3 micrometers, mid-infrared energy has wave-
lengths of 1.3 to 3.0 micrometers, and thermal infrared energy has wavelengths
of 3 to 14 micrometers.
False color composite prints that are similar to color infrared photographs
can be generated from these satellite data, but the true power of the digital data
lies in the ability to statistically assess each band of the spectrum independently
or in combination with any or all of the other bands. For example, a body of
water and a patch of forest may both have high brightness values in the green
band, but the forest emits infrared energy in contrast to the water, which absorbs
infrared energy. Thus, water and forest are readily discriminated using only one
band of data. It may be necessary to use several bands of data to classify different
types of forest, in which case probabilities are assigned to each pixel as to its
membership within a given cluster of spectrally similar pixels. Digital image
analysis is a process that was built around the statistical techniques of such
information extraction (Jensen 1995). Land use and land cover maps are one type
of map generated from the image analysis process.
The radiometric resolution of the MSS sensor is lower than the other three
sensors. The MSS sensor records brightness values between 0 and 63 for a given
pixel in each of its bands. The other sensors are sensitive to a range of 0 to 255.
Thus very subtle differences in the spectral properties of a material may not be
discriminated as well using MSS data. For example, if the brightness values
associated with a material were exactly 50 percent of the maximum reflectance in
all bands, then MSS would record 32 and TM would record 127 for each band. A
difference in a TM band for two materials might result in brightness values of
126 and 129, but the MSS sensor could only record a value of 32 for both
materials.
The temporal resolution of the sensor refers to the frequency with which
imagery is obtained for the same geographic area. AVHRR provides daily cover-
age of the earth (Kidwell 1988), whereas TM collects at most twenty-three images
of an area per year. MSS temporal resolution is eighteen days for Landsat 3 data
and sixteen days for Landsat 4 and 5 data (Jensen 1995). The temporal resolution
of SPOT data is variable, eleven to twenty-six days, depending on whether side-
look data are desired. The SPOT satellite has the capability of collecting side-look
imagery at an angle of up to 27 degrees, thus improving the probability of
collecting cloud-free data.
The two major classification techniques in image analysis are unsupervised
and supervised (Lillesand and Kiefer 1994). The unsupervised classification ap-
Image Analysis 51
proach statistically assigns each pixel to a cluster or class based upon the proba-
bility distance of the pixel to similar clusters when considering all the various
bands of data. The unsupervised approach requires the user to label the classes
according to the best understanding of the spatial distribution of all the members
of a given class after the processing is complete. A supervised approach is
different from the unsupervised technique in that it requires “training” data
upon which to initiate the statistical classification program. The algorithms assign
each pixel in the remainder of the image to a class based upon the statistics
associated with the training data. Both approaches require ground truth data
from other maps, aerial photography, or from field observation. In the supervised
approach the ground truth data are used first, and in the unsupervised approach
they are used last.
Although the use of remotely sensed data is becoming common, it is an
expensive technique because of the cost of satellite imagery acquisition and
processing. Staff specialists and image interpretation software and hardware are
required. As a result, few areas within Central America have existing satellite
classification maps. AVHRR analysis of all of Mexico has been completed (Evans
et al. 1992b), Landsat scenes have been analyzed in the Yucata
´
n (Green et al.
1987), and NASA airborne sensors have been utilized in Belize (O’Neill 1993).
Extensive analysis has been performed in Costa Rica (Sader and Joyce 1988;
Powell et al. 1989; and Mulders et al. 1992).
Review of Habitat-Mapping Capability of Four Sensors
The four sensors have been assessed for the purpose of mapping habitat as an
input to gap analysis (Scott et al. 1993). AVHRR has utility in monitoring green-
ness, but has limited utility in mapping vegetation types because of its coarse
spatial resolution. SPOT has several advantages over other sensors, but it is
limited by its spectral resolution, notably missing the mid-infrared band. Sensors
with bandwidths recording mid-infrared energy are useful in vegetation analysis
because of the water absorption characteristics of leaves, which are spectrally
detectable.
The tendency to misclassify areas because of too fine a spatial resolution is
another weakness of SPOT (also present in TM but to a lesser degree). For
example, patches of trees within a pasture can be classified accurately as isolated
pixels of the forest land cover. However, the land use of the area is pasture, so
the ability to convert land cover data to land use data must be considered in the
image analysis process.
TM is the sensor of choice for gap analysis, primarily because of its high
spectral resolution and its adequate spatial resolution (Scott et al. 1993). MSS is a
second choice to TM, primarily because of its reduced spectral resolution. MSS
52 Basil G. Savitsky
has only four bands with the two infrared bands in the near-infrared rather than
the mid-infrared.
The conclusions of Scott et al. (1993) are valid, but cost considerations require
an evaluation of MSS and AVHRR in addition to TM. International conservation
mapping should utilize satellite data that cost the least and are able to be
integrated meaningfully with wildlife and protected area data sets. It is useful to
distinguish between three levels of vegetation mapping and the satellite systems
that can support each level: AVHRR for global surveys with scale ranging around
1:2,000,000 and with discrimination between forest and nonforest; MSS for na-
tional surveys with scale ranging from 1:250,000 to 1:1,000,000; and TM or SPOT
for local surveys with scale ranging from 1:50,000 to 1:100,000 (Blasco and Achard
1990).
Successes and limitations of the various sensors utilized in tropical forestry
applications have been reviewed (Sader, Stone, and Joyce 1990). It was found
that AVHRR has its highest value as a tool for identifying the geographic areas
most suitable for more detailed imagery analysis. Various biophysical parameters
such as net primary productivity have been generated for global studies using
AVHRR, but they are least accurate in the complex ecosystems of the tropics.
MSS has proven successful in numerous cases of change detection, particularly
in the identification of areas of deforestation (Sader, Stone, and Joyce 1990).
However, MSS studies have had mixed results in identifying secondary growth
other than young secondary growth and in discriminating forest species consis-
tently. Published results of TM analyses are relatively few, and very little has
been published on SPOT investigations in the tropics (Sader, Stone, and Joyce
1990). TM has been utilized successfully in the identification of relatively undis-
turbed primary forest. However, old secondary forest and disturbed primary
forest were indistinguishable, and confusion occurred between secondary forest
and regions of mixed crops (Sader, Stone, and Joyce 1990). The four sensors
clearly vary in their utility in habitat mapping applications.
AVHRR
AVHRR applications have been reviewed by Hastings and Emery (1992). Most of
the examples of terrestrial surface mapping address general trends associated
with vegetation indices or thermal aspects of the sensor such as snow cover
mapping or forest fire monitoring. In terms of change detection, AVHRR has
been shown to have utility in detecting forest clearing in Amazonia (Tucker,
Holben, and Goff 1984). Early work done in Africa with AVHRR by Townshend
and Justice (1986) and by Justice, Holben, and Gwynne (1986) indicated that
vegetation indices had potential in vegetation monitoring, particularly if a strong
seasonal component can be measured.
More recent efforts in North America indicate the utility of AVHRR in pro-
ducing regional vegetation maps. A multitemporal analysis made use of various
Image Analysis 53
ancillary databases to produce a land cover characteristics database for the
conterminous United States (Loveland et al. 1991). A similar project was per-
formed for Mexico (Evans et al. 1992b). The level of detail associated with
Mexico’s classes of natural vegetation are temperate forest, tropical dry forest,
tropical high and medium forest, and scrub vegetation.
A combination of the thermal data of AVHRR with the visible data may
prove useful in discriminating finer levels of vegetation information than has
been achieved previously using AVHRR (Achard and Blasco 1990; Li et al. 1992).
Because of the strong commitment to global change programs and the growing
attempts to more fully exploit AVHRR data as a regional mapping tool, it is
likely that further advances in its application will be achieved in the near future.
The level of vegetation mapping done for North America and Mexico using
AVHRR is currently being extended to Central America.
MSS
MSS data have been utilized in assessing deforestation trends in Costa Rica
(Sader and Joyce 1988). The study targeted identification of primary forest,
disturbed forest, and cleared lands, but relied on several ancillary data sources
to accomplish its objectives. These data sources included digitized versions of
previously prepared forest inventories, life zone maps, and elevation data.
MSS was utilized also in a deforestation study in Guinea, West Africa (Gil-
ruth, Hutchinson, and Berry 1990). This study was similar in approach to the
Costa Rican MSS analysis in that a variety of additional data sources were
utilized in conjunction with MSS. The Guinea study produced more detailed
information about patterns of shifting agriculture and degradation by erosion
because it utilized aerial photography and videography.
In both studies MSS was found to be useful, but only because it was able to
be utilized with other previously existing data sources or more powerful sensor
data. The level of vegetation mapping that was expected from the MSS data was
also relatively low. In an ongoing attempt to monitor regional trends of global
change, MSS is being used as a historical baseline data source (Chomentowski,
Salas, and Skole 1994). The Landsat Pathfinder project is comparing historical
MSS data to recent TM data, but the resulting change detection classes are
constrained to the level which MSS can consistently produce: forest, deforesta-
tion, regrowing forest, water, grasslands, and clouds/cloud shadows (Chomen-
towski, Salas, and Skole 1994).
TM
The increased information content associated with TM imagery was demon-
strated in a project in which six forest and five nonforest classes were mapped in
Minnesota (Bauer at al. 1994). The level of analysis that can be achieved using
TM data is supported further by the work of Moran et al. (1994) in the Amazon.
54 Basil G. Savitsky
The classes produced in their vegetation maps included not only forest, pasture,
crop, bare, wetland, and water but also various stages of secondary growth:
initial, intermediate, and advanced. A two-pass image analysis was performed
that combined unsupervised and supervised classification techniques (Moran et
al. 1994).
Evans, Schoelerman, and Melvin (1992a) also report advances in level of
information extraction utilizing similar logic in the design of a TM analysis in
Louisiana. A supervised classification was made of the TM image producing a
six-class map of open/harvest areas, pine regeneration, pine, hardwoods, mixed,
and water. A second pass was made over the pine class to break out low- and
high-crown density subclasses. Congalton, Green, and Teply (1993) describe an
elaborate methodology to map the distribution of old growth forests in the Pacific
Northwest using TM imagery. Both supervised and unsupervised classification
methods were employed. Extensive field data were available, and ancillary data
were often used to differentiate vegetation classes that were spectrally indistin-
guishable but were located at distinct positions of elevation. Remote sensing was
utilized to identify crown closure, size class, and structure to build species-level
identification.
Each of these projects utilized detailed data for training statistics and applied
a second or third level of analysis to achieve higher information content. Such
effort is necessary to link local change detection analyses with regional and
global mapping efforts. A similar theme is evidenced at an institutional level in
the call by Justice (1994) to increase partnerships between international agencies
and local experts. The question of scale is applicable both in bridging global and
national inventories and in creating more collaboration between international
and national scientists and resource managers.
SPOT
Very little has been published on the efficacy of SPOT data in habitat mapping,
particularly in the tropics. A five-class habitat map was successfully produced
using SPOT data in India (Prasad et al. 1991). Rasch (1994) describes a project in
the Philippines that produced twenty-two habitat classes, comparable to the level
achieved with TM (previously described). The unique benefit of SPOT in the
Philippines project was the ability to produce cloud-free imagery in a shorter
time span than could have been generated through TM data acquisition because
SPOT has a market-driven schedule for data acquisition. Pohl (1995) describes an
Indonesian mapping project that merged SPOT wth ERS radar. The combined
strength of the SPOT sensor in spectral and spatial resolution with the cloud-
penetrating capability of radar resulted in the production of a 1:100,000 scale
image useful for updating existing maps.
The trade-off between the increased spatial resolution offered by SPOT and
the lower spectral content has not been fully evaluated, in particular regarding
forestry applications. A comparison of SPOT and TM in detection of gypsy moth
Image Analysis 55
defoliation in Michigan indicated that the performance of SPOT was 4 to 8
percent worse than TM in generating maps of defoliation and nondefoliation
(Joria, Ahearn, and Connor 1991).
Most of the identified literature on SPOT is similar to Ehlers et al. (1990) and
Johnson (1994)—emphasis is on the advanced spatial resolution and the associ-
ated ability of performing more effective urban mapping. Additional information
on SPOT applications in the tropics could probably be obtained in the French
remote-sensing literature. Further, because of the commercial interests of many
of the SPOT users, fewer results might get published in the technical literature
(personal communication, C. Hanley, marketing and communication specialist,
SPOT Image Corp., Reston, Va., 1996). A recent SPOT newsletter indicated that
SPOT data are being utilized extensively in Brazil and Bolivia, but the level of
success of projects on the mapping of tropical habitats in these countries has not
been assessed.
The Utility of Satellite Imagery in National and Regional
Conservation Mapping Efforts
Other variables must be considered in planning the image analysis component of
conservation mapping efforts in addition to an assessment of the efficacy of a
given sensor in habitat mapping. Data costs, data volume, data availability, and
the probability of alternative sensor solutions all have advantages and disadvan-
tages which need to be evaluated independently for each country or region
where habitat is mapped.
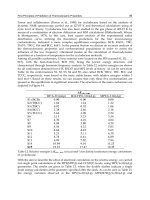
Data Costs
The most obvious factor in weighing the trade-offs between high spatial resolu-
tion sensors such as TM and SPOT and the lower spatial resolution sensors such
as MSS and AVHRR data is cost. The higher spatial resolution data are much
more expensive and cost $4,400 per TM scene and $2,600 per SPOT scene (1995
prices). Historical MSS scenes (older than two years) are available for $200, and
AVHRR data costs $80 per scene. It also requires more SPOT scenes than Landsat
and more Landsat scenes than AVHRR to cover the same geographic region.
Thus, coverage for Costa Rica using one AVHRR scene costs $80, while five MSS
scenes cost $1,000, five TM scenes cost $22,000, and twenty-two SPOT scenes cost
$57,200. There are numerous cooperative data acquisition programs in place
which help to defray the costs of national or regional mapping programs. The
existence of such cooperative agreements is variable geographically, depending
upon the initiative of the natural resource agencies in a state or country to pool
their investments in data.
56 Basil G. Savitsky
Data Volum e
Differences in the spatial resolution of various sensors can translate to consider-
able differences in data volume, especially if compounded by a greater frequency
of bands. For example, a geographic area measuring 240 meters on each of four
sides would require a three-by-three array of MSS data, or nine pixels. Each pixel
has four bands; thus the image would require 36 data values. The same geo-
graphic area covered by TM (which has 30-meter spatial resolution rather than
the 80-meter resolution of MSS) would require an eight-by-eight array, or sixty-
four pixels. Six of the seven bands of TM data are typically used, thus there is a
total of 384 data values. The TM data have over ten times the volume as the MSS,
and this has repercussions in terms of the time required to process data as well
as in the requirements for data storage.
The size of an AVHRR dataset is approximately 1 percent of the size of an
MSS dataset for the same area (Hastings, Matson, and Horbitz 1989). A country
the size of Costa Rica (51,100 square kilometers) generates a habitat database
with approximately 50,000 points if the 1-kilometer AVHRR sensor is employed.
AVHRR may provide a good data volume alternative to both Landsat systems,
particularly if the region being mapped is as large as the entirety of Central
America.
There are advantages to using general sensor systems such as AVHRR. In
assessing the utility of coarse resolution satellite data, Roller and Colwell (1986)
list several benefits of synoptic sensors such as AVHRR. These benefits have
immediate savings if certain compromises in spatial resolution can be accepted.
The acquisition of a single database obtained at a single time eliminates the need
to merge numerous adjacent images. It may be easier to acquire cloud-free or
cloud-reduced imagery in certain areas with the higher temporal repetition
(daily) available with coarse resolution sensors. It is possible that multitemporal
analysis might compensate for some of the information loss associated with
decreased spatial resolution.
Data Availabil ity
Most imagery of the tropics has limited data availability due to extensive cloud
cover. For many areas, a computer search of all available imagery may result in
only one or two dates of imagery having less than 20 percent cloud cover. One
can acquire multiple dates and use the cloud-free areas in both images, but this
is expensive and may not solve the problem. Further, there are possible temporal
complications which could affect classification results. For example, it may be
difficult to discriminate between different vegetation classes unless imagery is
collected during an optimal season of the year. Analysis of imagery from two
distinct seasons of the year may result in different classification results.
If cloud cover is a severely limiting constraint, it may be necessary to employ
a multiple-sensor approach. The additional platform could be any of the higher-