- Trang chủ >>
- Khoa Học Tự Nhiên >>
- Vật lý
Green Energy Technology, Economics and Policy Part 2 docx
Bạn đang xem bản rút gọn của tài liệu. Xem và tải ngay bản đầy đủ của tài liệu tại đây (297.92 KB, 37 trang )
8 Green Energy Technology, Economics and Policy
2000
70
60
50
40
30
20
10
0
2010
385
455
550
445
485
445
450–520
Note: Figures refer to CO
2
concentrations by volume (ppm CO
2
).
Emissions (G† CO
2
)
425
2020 2030 2040 2050 2060 2070 2080 2090 2100
Baseline
ACT Map
BLUE Map
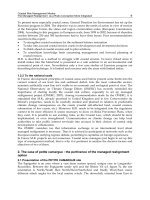
Figure 1.1 CO
2
concentration profiles for the Baseline,ACT and BLUE Map scenarios
(Source: ETP, 2008, p. 51, © OECD-IEA)
20 000
Renewable power generation
(TWh/yr)
18 000
16 000
14 000
12 000
10 000
8 000
6 000
4 000
2 000
2000 2005 2010 2015 2020 2025 2030 2035 2040 2045 2050
0
Other
Tidal
Geothermal
Biomass, waste
Solar CSP
Solar PV
Wind
Hydro
Figure 1.2 Growth of renewable power generation in the BLUE Map scenario, 2000–2050
Product shares in the world renewable energy supply, 2005: Renewables com-
bustibles and waste: 78.6% (comprising liquid biomass: 1.6%, renewable municipal
waste: 0.7%, solid biomass/charcoal: 75.6%, gas from biomass: 0.9%); Wind: 0.6%,
hydro: 17.4%, solar/tide: 0.3%, geothermal: 3.2%.
The contribution of renewables to electricity generation increases from 18% in 2005
to 35% in 2050 in the ACT Map scenario, and 46% in the BLUE Map scenario. In
the BLUE Map scenario, electricity generation from renewables (wind, photovoltaics
and marine) is projected to rise to 20.6% (about 3 500 GW) by 2050.
Up to 2020, bulk of renewable energy production will come from biomass and
wind. After 2020, solar power production will become significant. Hydro will grow
continuously up to 2050, but this growth will achieve a plateau around 2030 to 2050,
because of the constraints of finding suitable sites. The contribution of hydro, wind
and solar will be roughly equivalent in 2050.
About two-thirds of solar power will be provided by solar PV, with the balance one-
third coming from Concentrating Solar Power (CSP). As the capacity factor of CSP is
higher than PV, CSP may account for 40% of the solar power generation.
Renewables and climate change 9
The intermittency of solar power is not a problem as its peak coincides with the
demand for air-conditioning. Electricity storage capacity is sought to be increased
from 100 GW today to 500 GW by 2050 (in the form of pumped hydro storage,
underground compressed air energy, etc.) to cover the variability in the case of systems
like wind.
The BLUE Map scenario envisages a strong growth of renewables to achieve the
target of 450 ppm CO
2
(Fig. 1.2; source: ETP, 2008, p. 88, © OECD-IEA).
Currently about 50% of the global population lives in urban areas, and this trend
is likely to continue in the future. Consequently, urban authorities have to figure out
ways of providing renewable energy services to the urban residents. Cities located on
the coast could tap the offshore wind energy and ocean energy. Building-integrated
solar PV (such as, solar shingles) would be most suitable to cities in low latitudes, with
good sunshine. Geothermal power could be developed for the use of cities located
near high heat-flow areas. Bioenergy is not usually suitable for the cities, except those,
which have forests nearby.
Chapter 2
Wind power
U. Aswathanarayana
2.1 INTRODUCTION
Wind energy is believed to be the most advanced of the “new’’ renewable energy
technologies. Since 2001, wind power has been growing at a phenomenal rate of 20%
to 30% per annum. Wind power (2 016 GW) is expected to provide 12% of the global
electricity by 2050, thereby avoiding annually 2.8 gigatonnes of emissions of CO
2
equivalent. This would need an investment of USD 3.2 trillion during 2010–2050.
Atmospheric scientists are developing highly localized weather forecasts to enable the
utility companies to know when to power up the wind turbines.
Wind turbines do not need gusty winds; they need only moderate but steady winds.
Wind turbines start producing electricity when the wind speed reaches 18–25 km/hr
(5 to 7 m/s), reaching their rated output when the wind speed reaches about 47 km/hr
(13 m/s). So any area where the wind speeds are greater than about 18 km/hr (5 m/s)
is suitable for generating wind electricity, and such areas are plentiful. When the wind
speeds exceed 22 to 26 m/s, the turbine is shut off to avoid damage to the structure.
Availability of wind turbine is defined as the proportion of the time that it is ready
for use. Operation and maintenance costs are determined by this factor. Availability
varies from 97% onshore to 80–95% offshore.
Improved turbine design is aimed at extracting more energy from the wind, more of
the time, and over longer period of time. Affordable materials with higher strength-
to-mass ratio are needed for the purpose. More power is captured by having a
larger area through which the turbine can extract energy (the swept area of the
rotor), and installing the rotor at a greater height (to take advantage of the rapidly
moving air).
12 Green Energy Technology, Economics and Policy
Table 2.1 Cost structure of wind energy
Onshore wind Offshore wind
Investment cost USD 1.6–2.6 M/MW USD 3.1–4.7 M/MW
Operation & Maintenance USD 8–22/MWh USD 21–48/MWh
Life-cycle cost USD 70–130/MWh USD 110–131/MWh
2010
USD million/MW
3.5
3.0
2.5
2.0
1.5
1.0
0.5
0
2015 2020 2025 2030 2035
Onshore
Offshore
2040 2045 2050
Figure 2.1 Investment costs for the development of onshore and offshore wind
(Source: “Technology Roadmap: Wind Energy’’, 2009, p. 17, © OECD – IEA)
A typical 2 MW wind turbine has two or three blades, each about 40 m long, and
made of fiberglass or composite material. The nacelle, which is the housing on the top
of the tower, contains the generator and gearbox to convert the rotational energy into
electricity. The tower height is ∼80 m. The largest wind turbines presently in operation
in the world, has a capacity of 5–6MW each, with rotor diameter up to 126 m.
Table 2.1 (source: Technology Roadmap: Wind Energy, 2009, p. 12) gives the cost
structure of wind energy.
The investment costs of onshore and offshore wind energy are depicted in Fig. 2.1
2.2 ENVIRONMENTAL FACTORS
The plus point of the wind power is that it has no carbon dioxide emissions. Wind
power has three environmental impacts: visual impact, noise, risk of bird collisions
and disruption of wild life. Wind power growth has to reckon with two impediments:
siting and intermittency. Improved designs of wind turbines have reduced the noise
pollution from wind farms. The best places for siting wind farms are tops of hills,
bluffs along the open ocean and areas, which are not obstructed by topography. But
these happen to be the very places, which people cherish for their scenic beauty.
Two kinds of noises are associated with wind turbines: aerodynamic noise from the
blades, and mechanical noise from the rotating machinery. Design improvements are
Wind power 13
Table 2.2 Cost estimates of wind power
Type of cost Capital Cost Cost (US cents/kWh)
Turbine USD 650–700/kW 2.5–2.7*
Rest of the plant USD 270/kW 1.0
Operating 0.5–0.9
Total USD 920–970/kW 4.0–4.6
*Assuming capacity factor of 28%, discount rate of 7%, a lifetime of 20 years, and no
decommissioning costs.
bringing about a sharp reduction in the noise. The risk to migratory birds could be
avoided by siting the wind farms where the routes of the migratory birds do not cross.
2.3 COSTS
The cost of the turbine constitutes 74–82% of the capital costs of the medium-sized
onshore power stations (i.e. 850 kW to 1 500kW). Other costs are as follows: Foun-
dations: 1–6%; Electric installation: 1–9%; Grid connection: 2–9%; Consultancy:
1–3%; Land: 1–3%; Financial costs: 1–5%; Road construction: 1–5%.
The onshore wind power production costs depend upon the wind conditions.
Operation & Maintenance costs average 20–25% of the total cost per kWh pro-
duced. They tend to be low (10–15%) in the early years of the turbine, and may rise to
20–35% in the later years. To bring down O&M costs, manufacturers are developing
new turbine designs that have less down time and require fewer service visits. Experi-
ence in Europe suggests O&M costs of US cents 1.5/kWh to 1.9/kWh of the produced
wind power over the lifetime of the turbine.
Wind power is capital intensive with capital costs accounting for 75–80% of the
production costs – the corresponding figure for fossil fuel power stations is 40–60%.
The onshore wind power production costs depend upon the wind conditions – they
are low in areas of high wind speeds (such as, coastal areas) and high in areas of low
wind speeds (such as, inland areas).
The cost estimates are given in Table 2.2 (source: Komor, 2004, p. 37).
That the calculated levelized price of US cents 4.0–4.6/kWh may not be off the
market price is indicated by the fact that in 2001, California signed for a contract for
1 800 MW of wind power at an average price of US cents 4.5/kWh. Earlier, in 1998,
U.K. contracted for 368 MW of wind capacity at an average price of US cents 4.2/kWh.
2.4 WIND POWER MAR KETS
There are wind farms in about 40 countries in the world, with thirteen of them having
a capacity of 1 000 MW of installed capacity. The top ten countries in the world in
terms of installed wind power capacity are listed in Table 2.3.
In 1980, Denmark and California were virtually the only markets in the world for
wind turbines. The market collapsed in California when the financial incentives were
14 Green Energy Technology, Economics and Policy
Table 2.3 Top ten countries in installed wind power capacity
Country MW %
Germany 22 247 23.6
United States 16 818 17.9
Spain 15 145 16.1
India 8 000 8.5
China 6 050 6.4
Denmark 3 125 3.3
Italy 2 726 2.9
France 2 454 2.6
United Kingdom 2 389 2.5
Portugal 2 150 2.3
Rest of the world 13 018 13.8
Total top ten 81 104 86.2
Global total 94 122
(Source: EnergyTechnology Perspectives, 2008, p. 342)
Table 2.4 Global top ten wind-turbine manufacturers
Manufacturer Capacity supplied in 2006 (MW) Market share (%)
VESTAS (Denmark)* 4 329 28.2
GAMESA (Spain) 2 346 15.6
GE WIND (USA) 2 326 15.5
ENERCON (Germany) 2 316 15.4
SUZLON (India) 1 157 7.7
SIEMENS (Denmark) 1 103 7.3
NORDEX (Germany) 505 3.4
REPOWER (Germany) 480 3.2
ACCIONA (Spain) 426 2.8
GOLDWIND (China) 416 2.8
Others 689 2.6
Total 16 003
*Country designation refers to the corporate base
(Source: BTM Consult, 2007)
withdrawn. Denmark survived by falling on the stable domestic market. In mid-1990’s,
Germany entered the market, followed by Spain. There has been a great boom in the
wind power industry. Six leading turbine manufacturers account for 90% of the global
market. The global top ten wind turbine manufacturers are listed in Table 2.4.
Three parameters determine the amount of power from wind turbine: wind condi-
tions, turbine height, and efficiency of the turbine. While the wind regime of a site is a
given, higher output of power can be realized by making the turbines larger and taller.
Germany and Denmark increased the productivity of their prime sites by replacing the
earlier-installed smaller and shorter turbines by larger andtaller turbines. The efficiency
of energy production is measured on the basis of annual energy production per unit of
swept rotor area (kWh/m
2
). The same parameter determines the manufacturing costs.
The trend is therefore towards larger and taller and more efficient wind turbines. The
Wind power 15
Past and present
wind turbines
15 m
1980 1985 1990 1995 2000 2005 2010
2008
2015 2020
20 m
40 m
50 m
112 m
124 m 126 m
150 m
178 m
7.5 MW
Airborne turbines
300 m
Future wind turbines?
10 and 20 MW
252 m
Figure 2.2 Growth in the size of the wind turbines
(Source: Technology Roadmap: Wind Power, p. 22, © OECD – IEA)
efficiency of the wind power sector has increased by 2–3% annually during the last 15
years through better turbine siting, more efficient equipment and higher hub heights.
2.5 PROJECTED GROWTH OF WIND POWER
ACT scenario
From its current capacity of 94 GW, the global wind power capacity is projected to
grow to 1 360 GW by 2050 under the ACT scenario. Electricity production from wind
power is projected to contribute 2 712 TWh/yr by 2030 and 3 607 TWh/yr by 2050.
BLUE scenario
The BLUE scenario assumes profound technoeconomic improvements, in the form
of higher CO
2
incentives, greater cost reductions, extensive offshore wind power
development and improvements in innovative storage, grid design and management.
It envisages the installation of 700 000 turbines of 4 MW size by 2050. Wind power
installed capacity will go up to 2010 GW by 2050, with wind electricity generation of
2 663 TWh/yr in 2030, and 5 174 TWh/yr in 2050. Wind power contribution to global
energy production will reach 12% by 2050, thereby reducing the CO
2
emissions by
2.14 Gt CO
2
/yr. By 2050, China will be the world leader in wind power, with electricity
from wind power accounting for 31% of the world production
2.6 OFFSHORE WIND POWER
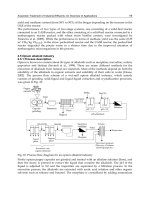
General considerations Till now, offshore wind turbine designs have been essentially
“marinised’’ forms of onshore turbines. It is realized that future designs of offshore
16 Green Energy Technology, Economics and Policy
Low-level
Jet
Wake
turbulence
Turbulent
wind
Lightning
Extreme
wave
Tidal and Storm surge
depth variation
Gravity
Ship and Ice
impact
Buoyancy
Marine
growth
Waves
Currents
and tides
Icing
Figure 2.3 Offshore operating conditions
wind turbines should take into account the special characteristics of the marine envi-
ronment (vide Fig. 2.3, Offshore operating conditions, Source: Technology Roadmap:
Wind Energy, 2009, p. 24, ©OECD – IEA).
New designs of offshore wind turbines will have two blades rotating downwind of
the tower, with a direct-drive generator. There will be no gearbox. The rotor will be
150 m in diameter. The turbine capacity could be 10 MW. It will have a self-diagnostic
system, which is capable of taking care of any operational problems on its own. Such
an arrangement will reduce the requirement of maintenance visits to the minimum.
Foundations will be a major area of technological development. Instead of the cur-
rent monopile foundations which account for 25% of the installation cost, new types
of foundations based on improved knowledge of the geotechnical characteristics of
the subsurface, are being developed to reduce costs. Currently, offshore wind farms
operate at depths of less than 30 m. New designs of tripod, lattice, gravity-based and
suction bucket technologies are being developed for use in depths of 40 m. Technolo-
gies used by offshore oil and gas industry are being adapted by Italy and Norway to
develop floating designs for offshore wind turbines.
Offshore turbines are the next future. Europe expects to obtain 30% of the energy
from offshore wind.
Wind power 17
Presently, most of the wind power is generated by land-based wind turbines. Off-
shore wind installations are 50% more expensive than land-based wind installations.
Still companies are going in for offshore wind power because the output of offshore
installations is 50% more than onshore installations, due to better wind conditions.
Offshore wind power installations have to operate “under harsh conditions, shortage
of installation vessels, competition with other marine users, environmental impacts
and grid interconnection’’ (Energy Technology Perspectives, 2008, p. 352).
Five countries (Denmark, Ireland, Netherlands, Sweden, and U.K) have established
offshore wind power stations with a total capacity of 1 100 MW. Most of these installa-
tions (typically 2 MW capacity) are sited in relatively shallow water (<20 m deep) and
close to the coast (<20 km). U.K. is establishing a large (∼1 000 MW) facility situated
more than 20 km offshore. When completed, it will be capable of providing power to
one-quarter of the households in London.
Denmark which made extensive studies on the behavioral response of the marine
mammals and birds to offshore wind farms, has developed guide-lines for minimizing
impact of offshore wind farms on marine biota. These could be applied to estuarine
and open sea sites of offshore wind stations.
Investment costs
As should be expected, the capital costs of the offshore power stations are dependent
upon wind speeds, water depth, wave conditions and distance from the coast. The
experience in U.K. is that the costs range from USD 2 225–2 970/kW. The higher capital
cost of the offshore wind installations is partly offset by the lower costs of production
of the offshore wind electricity. This is so because the offshore installations are exposed
to higher wind speeds for longer periods (i.e., 3 000–3 300 full load-hours per year,
or ∼34% capacity factor) relative to the onshore installations (2 000–2 300 full load
hours per year, or ∼25% capacity factor). Danish wind farms have recorded high load
hours of 3 500–4 000 hours per year.
Investment costs vary from USD 1.5 million to 3.4 million/MW, depending upon
water depth and distance from the coast. Foundations and grid connections account
for the difference in costs between onshore and offshore wind power.
Water depth and distance from the coast determine the offshore wind power costs.
United Kingdom established a 90 MW offshore wind turbines in 2006. The costs
ranged from USD 2 226/kW to USD 2 969/kW. Offshore turbines cost about 20%
more than the onshore turbines. Also, offshore towers and foundations cost 2.5 times
more than similar structures on land.
The breakdown in the offshore wind power investments costs is given in Table 2.5.
Annual Operation & Maintenance costs are in the region of USD 20/MWh, averaged
over the lifetime of the turbine, normal operating conditions and discount rate of 7.5%.
Steel which is used for the construction of the turbine, accounts for 90 % of the cost
of the turbine. Turbine fabrication costs are being brought down by replacing steel
with lighter and more reliable material, and by improving the fatigue resistance of the
gear boxes. During the last five years, there has been a phenomenal growth in the
use of rare-earth elements in the energy industries. Tiny quantities of dysprosium can
make magnets in electrical motors lighter by 90%, thereby allowing larger and more
powerful wind turbines to be mounted. Use of terbium can help cut the electricity use of
18 Green Energy Technology, Economics and Policy
Table 2.5 Offshore wind power investment costs
Investment costs
USD 1 000/MW Share%
Turbines, ex-works, including transport and erection 1 020 49
Transformer station and main cable to coast 340 16
Internal grid between turbines 105 5
Foundations 440 21
Design, project management 125 6
Environmental analysis 75 3
Miscellaneous 12 <1
Total 2 117
(Source: Lemming et al., 2007)
Table 2.6 Estimated offshore wind turbine costs during 2006–2050
Average investment costs O&M
Year (million USD/MW) (USD/MWh) Capacity factor (%)
2006 2.6 20 37.5
2015 2.3 16 37.5
2020 2.0 15 37.5
2030 1.8 15 37.5
2050 1.7 15 37.5
lights by 80%. Dysprosium prices have gone up sevenfold since 2003, with the current
market price being USD 116/kg. Terbium prices have quadrupled during the period
2003–2008 to USD 895/kg. The recession brought down the price to USD 451/kg.
Estimated offshore wind turbine costs during 2006–2050 are given in Table 2.6
(source: Lemming et al., 2007).
Offshore wind power will be progressively cheaper in future.
Further technology development
The European Union has launched an impressive wind energy R&D initiative, code
named UpWind, aimed at developing very large turbines (8 to 10 MW) and large wind
farms of several hundred megawatt capacity. The programme would involve better
understanding of wind conditions, development of materials with high strength to
mass ratios, and improved control and measuring systems.
Some innovative approaches in this regard are described below:
Superconducting generators: Denmark Technical University, Ris?, is developing a
10 MW generator which achieves 50–60% reduction in weight through the use of high-
temperature, superconducting materials. By making direct drive possible, it avoids the
use of gear-boxes, and thus brings down O&M costs.
Compressed air energy storage (CAES): When the demand is low, wind electricity is
used to compress air, which is then stored in a geological formation, say, salt domes.
When the demand rises, the flow is reversed. The compressed gas is fed into natural
gas-fired turbine, thereby enhancing its efficiency by more than 60%.
Wind power 19
Table 2.7 Activities, milestones and actors to develop wind power
Activity Milestones and Actors
Resource
1. Refine and set standards for wind resource Ongoing. Complete by 2015.
modelling techniques, and site-based data Wind industry and research institutions,
measurement with remote sensing technology; climate and meteorological institutions.
improve understanding of complex terrain,
offshore conditions and icy climates.
2. Develop publicly accessible database Complete by 2015. Industry and
of onshore and offshore wind resources research institutions.
and conditions, with the greatest possible
coverage taking into account
commercial sensitivities.
3. Develop more accurate, longer-horizon forecast Ongoing. Complete by 2015. Industry,
models, for use in power system operation. research institutions and system operators.
Technology
4. Develop stronger, lighter materials to enable Ongoing. Continue over 2010–2050 period.
larger rotors, lighter nacelles, and to reduce Industry and research institutions.
dependence on steel for towers; develop
super-conductor technology for lighter,
more electrically efficient generators;
deepen understanding of behaviour of very
large, more flexible rotors.
5. Build shared database of offshore operating Complete by 2015.Wind power plant
experiences, taking into account commercial developers, owners and operators, industry
sensitivity issues; target increase of availability associations.
of offshore turbines to current best-in-class of 95%.
6. Develop competitive, alternative foundation types Ongoing. Complete by 2015.
for use in water depths up to 40 m. Industry and research institutions
7. Fundamentally design new generation Commercial scale prototypes by 2020.
of turbines for offshore application, with minimum Industry and research institutions.
O&M requirement.
8. Develop deep-water foundations/sub-surface Ongoing. Complete by 2025. Industry and
structures for use in depths up to 200m. research institutions.
Supply Chains
9. Accelerate automated, localised, large-scale Ongoing. Continue over 2010–2050 period.
manufacturing for economies of scale, with an Industry.
increased number of recyclable components.
10. For offshore deployment, make available Sufficient capacity by 2015.Wind industry,
sufficient purpose-designed vessels; improve shipping industry, and local governments.
installation strategies to minimise work at sea;
make available sufficient and suitably equipped
large harbour space.
Environment
11. Improve techniques for assessing, minimising Complete by 2015. Industry, research
and mitigating social and environmental institutions, governments, and NGOs.
impacts and risks.
20 Green Energy Technology, Economics and Policy
Floating platforms: As in the case of oil industry, platforms are built on land and
towed to sea. Wind turbines are mounted on these platforms.
Hybrid systems: In the Poseidon’s Organ arrangement, a floating offshore wave
power plant also serves as a foundation for wind turbine.
System aspects: Traditionally, electricity grids and power markets link large-scale
electricity producers with consumers. Wind power does not conform to this pattern. In
2006, wind energy provided 17% of Denmark’s electricity demand. This was possible
because the Danish wind power could export surplus power to, and import electricity
from, the Nordic Power market. The moral of the story is that dispersed wind power
plants needs to be aggregated, and linked to power markets in such a way that short
falls cost the least.
2.7 PROGNOSIS
The actions needed to reduce the life cycle cost of wind energy production are listed
in Table 2.7 (source: Technology Roadmap: Wind Energy, 2009, p. 42).
Atmospheric scientists are developing highly detailed, localised weather forecasts to
enable utility companies when to power up the wind turbine and when to power down
the fossil fuel electricity generation.
The juggernaut of wind power is unstoppable. China has emerged as the largest
market for wind energy. It is now building six wind farms with a capacity of 10 000
to 20 000 MW each. By 2020, Britain is planning to obtain a quarter of its electricity
needs from offshore wind energy system. US plans to meet 20% of electricity demand
through onshore and offshore wind power by 2030 (as against 2% today), by building
100 000 wind turbines at a cost of USD 100 billion. This would create 140 000 new
jobs, and reduce the CO
2
emissions by 800 million tonnes.
Chapter 3
Solar energy
U. Aswathanarayana
3.1 INTRODUCTION
Solar PV has many strong points – (i) PVs will work any where the sun shines – the
sunnier it is, the more the electricity produced, and the lower the per kWh cost. Some
electricity is produced even when it is cloudy, (ii) unlike the wind turbines which needs
to have winds with speeds of more than 18 km/hr to start producing power, PVs have
no such constraints – they work any where the sun shines, (iii) it is quiet, has no moving
parts, can be installed easily, and can be sized at any scale, ranging from a single bulb,
to powering the entire community. It has two serious drawbacks : (i) it is expensive –
its levelized cost ( US cents 20–40/kWh) is several times more than that of electricity
from the fossil fuels (US cents 3 to 5/kWh). The PV costs are coming down all the
time, but they are a long way from being competitive. (ii) It is intermittent – no power
is generated during nights when there is no sun.
Solar energy can be used in the following ways: (i) Direct supply of solar heat to
buildings and industrial processes – provision of heat accounts for about 40% of the
global energy needs, (ii) electricity can be produced through the photovoltaic cells,
or through steam turbines by the concentration of solar rays, and (iii) production
of hydrogen which can be used as fuel. Among all the energy systems, solar energy is
projected to grow the fastest. Between now and 2050, solar energy is expected to grow
thousand-fold, to 2 319 TWh/yr in the ACT scenario, and 4 754 TWh/yr in the BLUE
scenario. It is assumed that during the next ten years, there will be sustained support to
the solar energy sector to enable it to become competitive. Under both ACT and BLUE
scenarios, major growth is likely to occur after 2030. PV is expected to grow fast in
the solar-rich OECD countries (e.g. North America) and the emerging economies of
22 Green Energy Technology, Economics and Policy
China and India. CSP (Concentrated Solar Power) will grow strongly not only in these
countries, but also in the sun belts of Africa and Latin America.
A photovoltaic cell (PV cell) is a semiconductor device that is capable of converting
solar energy into direct current (DC) electrical energy. A PV cell is typically a low
voltage (∼0.5 V) and high current (∼3A) device. PV modules are built by combining a
number of PV cells in series. A commercial module with an area of 0.4 m
2
to 1.0 m
2
can
produce peak power of 50 Wp (peak Watts) to 150 Wp. By linking together appropri-
ately large number of PV cells, it is possible to build huge power units with a capacity
of tens of MWs.
In mid-1990s, stand-alone, off-grid PV systems were common, as they are most
economically viable for use in rural areas. Water pumping and rural electrification
continue to account for about 10% of the PV market. Subsequently, grid-connected
systems, particularly those that are integrated into building design, have come into
vogue in a big way. Since 2000, the total cumulative PV capacity in the world has
grown eight-fold to 6.6 GW, 90% of which is composed of grid-connected systems.
Distributed generation in buildings accounts for 93% of the grid-connected systems.
Germany, Japan and USA account for 63% of the global PV production. China,
India, Australia, Korea and Spain are expanding their PV installed capacity and man-
ufacturing capability. China already accounts for 15% of the global production of
PV cells. Japanese companies – Sharp (17.1%), Kyocera (7.1%), Sanyo (6.1%) – lead
the world in PV manufacturing capacity, followed by Q-Cells (10%) of Germany and
Suntech (6.3%) of China. The shortage of purified silicon is expected to ease soon.
Several plants are fabricating hundreds of megawatts of PV modules yearly. Japan
is planning to build one GW manufacturing plant.
By 2010, ACT map scenario projects a market of 6 GW/yr and the BLUE map
scenario projects a market of 10 GW/yr. The industry envisages a much higher annual
production of 23 GW/yr of PV cells/modules by 2011. By 2050, the annual power gen-
eration from PV is expected to reach 1 383 TWh/yr as per ACT scenario and 2584 as
per BLUE scenario (the latter figure would correspond to 6% of the global production
of electricity in 2050).
3.2 PV TECHNOLOGY
Wafer-based crystalline silicon (c-Si) is the basic material for the fabrication of most
(∼90%) of the PV modules. After oxygen, silicon is the most abundant element in the
earth’s crust, but because of its great affinity for oxygen, silicon always occurs as silica
(SiO
2
). The value of one kg. of quartzite gets increased 65 million times when it is
made into computer chips, through the following steps:
1. Quartzite ($0.02/kg ) to metallic silicon ($2/kg) – 100 times increase in value
2. Metallic silica ($2/kg) to polysilicon ($40/kg) – 20 times increase in value
3. Polysilicon ($40/kg) to silicon wafer ($1500/kg) – 37 times increase in value
4. Cutting the wafer ($1500/kg) into chips ($1.3 million) – 860 times increase in
value
Ingots of silicon (which are made from silica) are sliced to make solar cells, which are
then electrically inter-connected. A module is fabricated by encapsulating strings of
Solar energy 23
cells. The module built of single crystalline silica (sc-Si) tends to have a higher conver-
sion efficiency, which is presently 15% now but is expected to increase to 25–28% by
2050. A module can be made from multi-crystalline silica (mc-Si), but such a module,
though cheaper than sc-Si, has lower conversion efficiency. Ribbon technologies have
conversion efficiencies similar to those of mc-Si, but make use of silicon feedstock more
efficiently.
About 40% ofthe Indians have no access to electricity – they use kerosene wick lamps
for lighting. These lamps give poor quality light, emit unhealthy fumes and constitute a
fire hazard in thatched houses in which poor people live. As a substitute for the kerosene
lamp, D.T. Barki’s NEST (Nobal Energy Solar Technologies), Hyderbad, India, has
successfully developed and is marketing in developing countries, an inexpensive (about
USD 30, which can be paid for in 16 monthly installments of USD 2 each), portable
and sturdy solar lantern which gives three hours of good light. The battery has a life of
three years, and solar panel has a life of ten years. The solar lantern is a good example
of globalization – it is fabricated in China, with silicon feedstock from Japan, and
marketed from India.
3.3 THIN FILMS
Thin film technology is rapidly emerging as a viable alternative to silicon wafer tech-
nology. A thin layer of photosensitive material is deposited on a low-cost backing,
such as, glass, stainless steel or plastic. Initially, amorphous silicon (α-Si) was used,
but now-a-days, Cadmium Telluride (CdTe) or Copper-Indium-Diselenide (CIS) are
used instead. The efficiency of CIS gets improved when it is doped with gallium, to
produce a CIGS module. The thickness of the thin film may range from 40–60
µmin
the case of c-Si to less than 10
µm in the case of CdTe.
Thin films use smaller quantities of feedstock, and are amenable to automation. They
can be integrated into buildings more readily and have better appearance. Their effi-
ciencies are, however, lower than c-Si modules. Recent improvements in CIS modules
have allowed them to have efficiencies of the order of 11%, which figure is comparable
to the efficiency of mc-Si modules. An efficiency of 22% is projected for CIS modules
by 2030. But the availability of Cd and Te may prove to be a constraint. Thin films are
likely to increase their market share by 2020. After that, hybrid systems which com-
bine crystalline and thin-film technologies, may dominate the market. These hybrid
systems have the best of both the worlds- higher efficiencies of the order of 18%, lower
material consumption and amenability to automation.
The module efficiencies of different PV systems are summarized in Table 3.1.
The consensus in the PV industry is that after 2020, the market share of c-Si PV
systems will decrease, and that thin-film technology will dominate the market. Two
types of Third generation PV devices are expected to come up during 2020-2030 :
(i) Ultra-low cost, low to medium efficiency cells and modules, such as dye-sensitized
nanocrystalline solar cells (DSC) which could attain an efficiency of 10%, if not
15%, by 2030. Organic solar cells with efficiencies of the order of 2% are being
developed. It is too early to speculate on their economic viability. They may figure
in applications where space is not a problem.
24 Green Energy Technology, Economics and Policy
Table 3.1 Present module efficiencies for different PV technologies
Wafer-based c-Si Thin Films
Sc-Si mc-Si α-Si, α-Si/mc-Si CdTe CIS/CIGS
Commercial module efficiency (%) 13–15 12–14 6–8 8–10 10–11
Maximum recorded module 22.7 15.3 – 10.5 12.1
efficiency (%)
Maximum recorded laboratory 24.7 19.8 12.7 16.0 18.2
efficiency (%)
(Source: Frankl, Manichetti and Raugei, 2008)
(ii) Ultra-high efficiency cells and modules, based on advanced solid-state physics
principles, such as, hot electrons, multiple quantum wells, intermediate band
gap structures and nanostructures. It is difficult at this stage to predict their effi-
ciency levels, but some experts predict that these devices may attain efficiencies
of 30–60%.
Most likely, several types of PV devices may coexist in 2050. They are listed in
Table 3.2.
3.4 COSTS
As PV systems have no moving parts, Operation and Maintenance costs are minimal
(mainly to wash the modules of dust and dirt) at around 0.5% of the capital investment
per year.
Presently, PV modules cost about 60% of the total PV system costs. Costs of mount-
ing structures, inverters, cabling, etc. account for the rest of the 40%. PV costs are
characterized by a high learning rate of 15–20% ( learning rate means reduction in cost
per each doubling of cumulative installed capacity). The cost of total PV systems was
USD 6.25/W in 2006. A sustained high learning rate, and increased integration in build-
ings are expected to bring down the total PV investment costs to USD 2.2/W in 2030,
and USD 1.24/W by 2050 under the ACT scenario. Under the BLUE map scenario,
the corresponding figures would be USD 1.9/W in 2030 and USD 1.07/W in 2050.
Dow Company has unveiled solar shingles. The solar shingle can be handled like
any other shingle – it can be dropped from roof, or trod on. It can offset 40% to 80%
of the home electricity consumption. The solar shingle is expected to have a market of
USD 5 billion by 2015.
The cost of electricity generated from PV systems depends upon the total solar irra-
diation, system lifetime (typically, 35 years) and the discount rate assumed (typically,
10%). It is expected to be in the range of US Cents 5/kWh to US Cents 7/kWh under
conditions of good irradiation (>1 600 kWh/kWp
∗
yr).
3.5 RESEARCH & DEVELOPMENT NEEDED
c-Si module technology has been successful as it is reliable, takes advantage of the
electronics industry, with ready availability of feedstock. Further advances that are
Table 3.2 Technology and market characterization of different PV technologies in 2050
Wafer-based c-Si Thin Films New Concept Devices
Ultra-high efficiency
(3rd. Generation,
quantum wells Ultra-low cost
CIS, Cd-Te, α-Si/µc-Si Pin-Asi and nanostructures (dye-sensitized
Cz, Fz mc, ribbon thin Si films ASI-THRU concentrators) cells, organic cells)
Module 24%–28% 20%–25% CIS: 22–25%, Si: 20% 6%–8% >40% 10%–17%
efficiency (%)
Module lifetime 40–50 years 40–50 years 30–35 years 30 years >25 years 10–15 years
(years)
Provided High pressure at Cost-effective Additional solutions for Low-cost, low-efficiency High power supply Colour to PV
service premium price Power cost-effective power “solar electricity glass’’ Low-material
applications applications cost option
Market segment Niche markets, Mass market Mass market Mass market Niche market/mass Mass market
space (“The PV work market
horse’’)
Applications All applications with All All Special added Consumer products All applications with All
surface constraints value in BIPV Special applications surface constraints;
(e.g. specific BIPV), (semi-transparency, Large surface buildings Ground-mounted,
ground-mounted screen-printing, etc.) very large-scale PV
Very large-scale PV
(Source: EnergyTechnology Perspectives, 2008, p. 374)
26 Green Energy Technology, Economics and Policy
needed in order for PV systems to reach large production volumes and low target cost
of USD 1.25/W, are summarized below (PV-TRAC, 2005; EUPVPLATF (2007):
c-Si technology
(i) Materials: Epitaxial deposition; substitution of silver (because of cost) and lead
(because of its health impact).
(ii) Equipment: Manufacturing processes (including ribbons) that use less silicon
and less energy per watt. High degree of automation.
(iii) Device concepts and processes: Design of new modules which can be assembled
more easily, low-cost and longer life span (25–40 years).
Thin Film technologies
(i) Materials and devices: Increase of module efficiencies from the current 5% to
15% or more; development of new multi-junction structures; reduced materials
consumption; alternative module concepts, such as, new substrates and encap-
sulation modalities; enhancement of the module life for 20 to 30 years, with less
than 10% reduction in efficiency.
(ii) Processes and equipment: Techniques of ensuring uniformity of film properties
over large areas, and bridge the efficiency gap between laboratory modules and
large-scale industrial modules; reduction in the pay-back time of the modules
from the present 1.5 years to 0.5 years.
3.6 NEW CONCEPT PV DEVICES
Technical advances in thin-film production and “building-integrated PVs’’ (BIPV), such
as roofing tiles, will continue to keep PV industry in the forefront of renewables.
The consensus in the PV industry is that after 2020, the market share of c-Si PV
systems will decrease, and that thin-film technology will dominate the market.
Fundamental research in physics, chemistry and materials is needed to develop and
operationalise these devices. The organically sensitized cells and modules need to have
their stability enhanced to about ten years, with improvements in efficiency from 5% to
10%. The inorganically sensitized cells which are characterized by very low efficiencies,
need to have their efficiency increased to 5–10%. The efficiency of very low-cost, nano-
structured devices needs to be improved to 5–10%. Two improvements are needed in
the case of polymer and molecular solar cells: improvement in the efficiency from
the present 3–5% to about 10%, and greater stability period (unto, say, ten years).
Devices based on concepts for super-high efficiency and full-spectrum utilization, are
being developed.
3.7 CONCENTRATED SOLAR POWER (CSP)
General considerations
Concentrated solar power needs cheap water, cheap land and plenty of sun. The water
need not be fresh water – brackish water or sea water will do.
Solar energy 27
Concentrated Solar Power (CSP) systems concentrate direct sunlight to reach high
temperatures. This heat can then be used to power a steam turbine which drives a
generator. CSP is best suited to areas with high direct solar radiation, the minimum
requirement being 2 000 kWh/m
2
.
Unlike c-Si systems in which solar energy is directly converted to electrical energy,
CSP system has thermal energy as an intermediate phase. In other words, it can store
heat in various forms, and release power as and when needed. CSP can be used for
continuous solar-only generation. Also it can burn fuel in hybrid plants and use the
traditional steam turbines to generate power.
A strong plus point in favour of CSP is that it reaches peak production (at noon)
exactly at the time when the electricity demand is at its highest (say, for air-conditioners)
in tropical, arid and semi-arid areas. In these areas, CSP electricity is much cheaper
than PV electricity, though it is costlier than fossil fuels and wind power.
As CSP plants are invariably large (typically several hundred megawatts), they have
to be linked to transmission networks. For instance, it is possible to export CSP elec-
tricity from North Africa to Europe at the cost of USD 30/MWh – this figure is les
than the cost difference in solar electricity between the two regions (DLR, 2006).
Barring some special situations, space should not be a constraint for CSP plants.
It has been estimated that the electricity requirements of the whole of USA, could
be generated with CSP plants occupying an area of a hundred square miles. CSP
could be combined with conventional devices, such as, steam turbines, and it is pos-
sible to scale up CSP plants to several hundred megawatts, using well-established
technologies.
Apart from electricity generation, CSP plants can be used to heat/cool buildings, to
desalinize water, and to produce fuels like hydrogen. In areas where water is scarce, dry
coolers may be used. In some arid countries, cogeneration of heat for desalinization
and power may turn out to be an attractive proposition.
The constraint of intermittency of solar energy can be got over either by storing heat
and conversion to electricity when solar energy is unavailable, or to have a fossil fuel
backup that uses the same steam cycle as the CSP plant (this needs only an additional
burner).
Description of CSP Technology
The solar flux is concentrated in three ways, with different flux concentration ratios:
troughs (30–100), towers (500–1 000) and dishes (1 000–10 000).
Troughs are parabolic, trough-shaped mirror reflectors. They concentrate sunlight
onto receiver tubes, thereby heating a thermal transfer fluid, such as, mineral oils,
molten salts and water (direct steam generation). Molten salts are often used for heat
storage, but may in future, be replaced by phase-change materials. Integrated Solar
Combined cycle plants use solar heat (350–400
◦
C) and fossil fuels. Trough plants
offer a maximum concentration of 200 suns, maximum temperatures of 400
◦
C, solar-
to-thermal efficiency of 60% and solar-to-electric efficiency of 12%. In the case of
Fresnel collectors, the absorber is fixed in the space above the mirror field. Fresnel
collectors are cheaper, but less efficient. Compact Fresnel linear collectors which are
more efficient, are being developed. A 354 MW trough plant has been in operation in
California. Algeria and Spain are building trough plants.
28 Green Energy Technology, Economics and Policy
Towers: consist of flat, double-axis tracking heliostats. There are several designs,
depending upon the heat transfer fluid, which may be molten salts and saturated steam.
Italy, Spain, France, Ukraine, Japan and USA have built tower plants of capacity of
few tens of MWs. South Africa is developing a large tower project (100 MW in a single
tower).
Dishes: Parabolic dish-shaped reflectors concentrate sunlight in two dimensions and
run a small Stirling engine (about 10 kW capacity) or turbine at the focal point.
Costs
Investment costs for trough plants are in the range of USD 4–9/W, depending upon the
local solar conditions and construction costs. Capital costs for 10 MW tower plant are
in the range of USD 9/W, but will be cheaper for large plants. Capital costs for dishes
are over USD10/W, but the prices are going down.
Current costs for electricity production are in the range of USD 125–225/MWh,
depending on the location of the plant. Both the capital and O & M costs can be
brought down, by using large turbines (which allow better conversion rates) and
smaller mirror surface.
Increased volume production, plant scale-up and technological advances would
bring down costs. If in the next 10–15 years, CSP capacities of 5 000 MW are built, the
electricity generation costs may come down to USD 43–62/MWh for trough plants,
and USD 35–55/MWh for tower plants.
Projected Research & Development efforts
R&D in the following areas will improve efficiencies and bring down costs:
(i) Direct steam generation for trough plants. Fundamental studies on flow patterns
and heat transfer in horizontal tubes will help in identifying cheaper substitutes
for mineral oil with water, and more efficient ways of using superheated steam.
(ii) Towers using pressurized air with solar hybrid gas turbine. The gas turbine in
the French Pegase project has achieved higher power conversion efficiencies by
using high-temperature solar heat, further heated by fossil fuel burning.
(iii) CSP plants in arid areas are being increasingly used to desalinize brackish water
and seawater, while producing power. If the solar plant delivers exhaust steam
from the turbine at a temperature of 70
◦
C, the heat can be used for desalination.
Thus a 100 MW plant can produce 21 000 m
3
of fresh water per day (DLR,
2007).
(iv) Solar energy can be used for the production of hydrogen and metals through
solar thermolysis. Production of hydrogen from water is an endothermic pro-
cess. Concentrated solar radiation provides the high-temperature process heat
needed for the purpose. Steinfeld (2005) describes the various routes for hydro-
gen production from solar energy. Solar-assisted fossil fuel steam reforming is
in the advanced stages of development. CO
2
emissions in the extractive met-
allurgical industries can be reduced through solar thermal, carbothermal and
electrothermal reductions of metal oxides.
Chapter 4
Biomass
U. Aswathanarayana
4.1 INTRODUCTION
Biomass is biologically-produced matter, and includes agricultural and forestry
residues, municipal solid wastes and industrial wastes, renewable landfill gases, etc.
Biodiesel is produced from leftover food products, such as animal fats and vegetable
oils and crops grown solely for energy purposes. Algae which are aquatic organisms
that range from pond scum to seaweeds, have great potential for producing liquid
transportation fuels (Exxon Mobil has just announced funding of USD 600 million for
algal biofuels). A strain of Escherichia coli has been engineered to produce biodiesel
fuel directly from biomass.
Further details of Biomass gasification (11.2) and algal biofuels (Chap. 12) have
been given elsewhere.
A strong point of biomass power is that it is dispatchable – it can be turned on and off,
in contrast with wind and solar power which are non-dispatchable. Biomass burning
does produce particulates, but emissions of SO
x
and NO
x
are much less than from
fossil fuel power stations. Some biomass fuels, like sewage sludge and animal wastes,
have foul odours. The purpose of some biomass plants in countries like Holland and
Belgium is not electricity production, but the disposal of the large quantities of animal
wastes arising from the large bovine populations in the countries.
4.2 TECHNOLOGY
The various renewable combustibles and biofuel pathways are summarized as follows:
Renewable combustibles
Arable annual crops: oilseed rape, wheat, maize, sugarbeet, potatoes
Herbaceous perennials: Miscanthus, switch grass, Reed canary grass
30 Green Energy Technology, Economics and Policy
Woody perennials: Short rotation coppice, pine/spruce
Residues and wastes: waste fats and oils, forestry residues, straw, organic municipal
wastes.
Conversion technologies
Pressing/esterification, hydrolysis/fermentation, gasification, pyrolysis, digestion.
Fuels
Biodiesel, ethanol, methanol, DME, FT Diesel, hydrogen, bio-oil and bio-methane.
Presently, biomass is the principal energy source for cooking and heating for 1.6
billion poor people in the developing countries. Biomass burning can lead to unde-
sirable emissions and particulates. About 668 million people in India continue to use
animal dung, agricultural waste and fuelwood as fuel for cooking. Because of the low
fuel efficiency of the cook stoves (∼8%), the particulate matter in the Indian house-
holds burning biomass is 2 000
µg/m
3
(as against the allowable 150 µg/m
3
), leading to
400 000 premature deaths.
Biomass constitutes a vast energy resource, but only a fraction of it is actually
available for electricity generation because of environmental, financial, political and
other concerns. Biomass issues are best understood in terms of two aspects: fuel and
electricity conversion technology.
Table 4.1 (source: ETP, 2008, p. 332) gives the typology of liquid biofuels.
The government and local policies have considerable bearing on the production
and availability of biomass feedstocks: Land-use, and change in land use; biodiver-
sity; reclamation of degraded lands (through the cultivation of Jatropha, for instance),
genetically modified crops, water use and quality, treatment of wastewater and solid
wastes, support for rural industries, and provision of low-cost energy to stimulate
economic growth, etc. There is the other side of the coin. The demand for bio-
fuels has some times led to deforestation, and the deterioration of wetlands and
peat soils, and thereby increased the CO
2
emissions and food prices (Fargione et al,
2008).
Increased demand for palm oil to produce biodiesel is leading to deforestation in
Malaysia and Indonesia. Though Malaysia claims that the higher production of palm
oil in the country is attributable to superior gene stock which replaced older trees,
Indonesia is planning to convert 1 to 2 million hectares of tropical forests into palm
oil plantations.
In USA, increased use of corn for the production of biodiesel, led to increased prices
for corn. Consequently, the US farmers started cultivating corn in preference to soy-
bean, thus necessitating the import of soybean. Thus producing biofuels at the expense
of food and fibre would not be beneficial to the world, and is hence not a sustainable
proposition. One way out is to cultivate plants like Jatropha (from which biodiesel
is produced) and bitter cassava (which is inedible and which would not be pilfered
by pigs and monkeys) from which ethanol is produced, in degraded and non-arable
land.
The technoeconomic characteristics of bioenergy conversion plant technologies are
given in Table 4.2 (source: ETP, 2008, p. 312);
Table 4.1 Typology of liquid biofuels
GHG reduction
Regions where currently impacts, vs. Biofuel yield per
Fuel Feedstock* mainly produced petroleum fuel use Costs hectare of land Land types
1st. generation ethanol Grains (wheat, maize) US, Europe, China Low-moderate Moderate-high Moderate Croplands
Sugar cane Brazil, India Thailand High Low-moderate High Croplands
2nd. Generation ethanol Biomass (cellulose) None used, but widely High High Medium-high Croplands, Pasture
available lands, Forests
1st. generation biodiesel Oil seeds, (oil seed US, Europe, Brazil Moderate Moderate – high Moderate-Low Croplands
(FAME) rape, soybean)
Palm oil Southeast Asia Moderate Low-moderate Moderate – high Coastal lands, Forests
2nd. generation biodiesel Any biomass None used High High Medium-high Croplands, Pasture
(via F-T**) Commercially lands, Forests
*Other crop feedstocks that can be used are sugar beet, cassava, Jatropha, sunflower oil and sorghum, as well as purpose-grown vegetative grasses suchasMiscanthus and reed
canary grass, and short rotation forest crops, such as Salix and Eucalyptus.
**Fischer – Tropsch process converts gasified biomass or coal to liquid fuels.
(Source: ETP, 2008, p. 332) gives the typology of liquid biofuels
32 Green Energy Technology, Economics and Policy
Table 4.2 Bioenergy conversion plant technologies
Investment
Conversion type Typical capacity Net efficiency costs (in USD)
Anaerobic digestion <10 MW 10–15% electrical,
60–70% heat
Landfill gas <200 kW to 2 MW 10–15% electrical
Combustion for heat 5–50 kW
th
residential 10–20% open fires, ∼23/kW
th
stoves;
1– 5 MW
th
industrial 40–50% stoves, 370–990/kW
th
furnaces
70–90% furnaces
Combustion for power 10–100 MW 20–40% 1 975–3 085/kW
Combustion for CHP 0.1–1 MW 60–90% overall 3 333–4 320/kW
1–50 MW 80–100% overall 3 085–3 700/kW
Cofiring with coal 5–100 MW existing. 30–40% 123–1 235/kW +
>100 MW new plant power station costs
Gasification for heat 50–500 kW
e
80–90% 864–980/kW
e
BIGCC* for power 5–10 MW demos 40–50% plus 4 320–6 170/kW
30–200 MW future 1 235–2 470/kW future
Gasification for CHP 0.1–1 MW 60–80% overall 1 235–3 700/kW
using gas engines
Pyrolysis for bio-oil 10t/hr demo 60–70% 864/kW
th
BIGCC – Biomass Integrated Gasification with combined cycle
4.3 ALGAL BIOFUELS
Further details about algal biofuels have been given in Chap. 12.
Photosynthesis which is a fundamental biological process, needs sunlight, carbon
dioxide and water. Cyanobacteria can convert up to 10% of the sun’s energy into
biomass. This rate is 5% for algae, and 1% for corn and sugar cane. The fossil fuels that
we use now, were produced by cyanobacteria in the geological past. Single-cell algae
are capable of producing a chemical “mix’’ that contains extractable fuel usable in cars
and trucks. The “green’’ crude thus produced is chemically identical to crude oil, but
it is carbon-neutral, non-toxic and sulphur-free. Sapphire Energy of California claims
has reportedly succeeded in producing the green “crude’’, and expects to produce one
million gallons (3.8 M. liters) of biodiesel and jet fuel per year starting from 2011 (vide
image on the cover page – courtesy: Sapphire Energy).
Algae can be cultivated in tanks and ponds. As oil-producing algal strains are not
fast, there is always a danger of faster-growing, non-oil producing algae invading
such tanks (on the analogy of weeds). This can be prevented by covering a pond
with a greenhouse, or using tubes which allow sunlight, and allow the circulation of
nutrients and CO
2
to enhance the productivity (“bioreactors’’). Closed systems are
generally more expensive to build and operate, but their costs can be brought down by
locating the algal plants near sources of CO
2
. Firm cost information is not available
in this regard.
Second generation biofuels which are expected to be produced from a range of
ligno-cellulosic feedstocks through the use of thermochemical or biochemical path-
ways, will be superior to first generation biofuels in that they will be high yielding,