Fiber Optic Telecommunication phần 4 ppsx
Bạn đang xem bản rút gọn của tài liệu. Xem và tải ngay bản đầy đủ của tài liệu tại đây (872.77 KB, 11 trang )
F
IBER
O
PTIC
T
ELECOMMUNICATION
© 2000 University of Connecticut 323
makes light coupling into single-mode fiber difficult due to the fiber’s small N.A. and core
diameter. For this reason LEDs are most often used with multimode fiber. LEDs are used in
lower-data-rate, shorter-distance multimode systems because of their inherent bandwidth
limitations and lower output power. The output spectrum of a typical LED is about 40 nm,
which limits its performance because of severe chromatic dispersion. LEDs operate in a more
linear fashion than do laser diodes. This makes them more suitable for analog modulation.
Figure 8-22 shows a graph of typical output power versus drive current for LEDs and laser
diodes. Notice that the LED has a more linear output power, which makes it more suitable for
analog modulation. Often these devices are pigtailed, having a fiber attached during the
manufacturing process. Some LEDs are available with connector-ready housings that allow a
connectorized fiber to be directly attached. They are also relatively inexpensive. Typical
applications are local area networks, closed-circuit TV, and transmitting information in areas
where EMI may be a problem.
Figure 8-22 Drive current versus output power for LED and laser
(Courtesy of AMP, Inc.)
Laser diodes (LD) are used in applications in which longer distances and higher data rates are
required. Because an LD has a much higher output power than an LED, it is capable of
transmitting information over longer distances. Consequently, and given the fact that the LD has
a much narrower spectral width, it can provide high-bandwidth communication over long
distances. The LD’s smaller N.A. also allows it to be more effectively coupled with single-mode
fiber. The difficulty with LDs is that they are inherently nonlinear, which makes analog
transmission more difficult. They are also very sensitive to fluctuations in temperature and drive
current, which causes their output wavelength to drift. In applications such as wavelength-
division multiplexing in which several wavelengths are being transmitted down the same fiber,
the stability of the source becomes critical. This usually requires complex circuitry and
F
UNDAMENTALS OF
P
HOTONICS
324 © 2000 University of Connecticut
feedback mechanisms to detect and correct for drifts in wavelength. The benefits, however, of
high-speed transmission using LDs typically outweigh the drawbacks and added expense.
Laser diodes can be divided into two generic types depending on the method of confinement of
the lasing mode in the lateral direction.
• Gain-guided laser diodes work by controlling the width of the drive-current distribution;
this limits the area in which lasing action can occur. Because of different confinement
mechanisms in the lateral and vertical directions, the emitted wavefront from these
devices has a different curvature in the two perpendicular directions. This astigmatism in
the output beam is one of the unique properties of laser-diode sources. Gain-guided
injection laser diodes usually emit multiple longitudinal modes and sometimes multiple
transverse modes. The optical spectrum of these devices ranges up to about 2 nm in
width, thereby limiting their coherence length.
• Index-guided laser diodes use refractive index steps to confine the lasing mode in both
the transverse and vertical directions. Index guiding also generally leads to both single
transverse-mode and single longitudinal-mode behavior. Typical linewidths are on the
order of 0.01 nm. Index-guided lasers tend to have less difference between the two
perpendicular divergence angles than do gain-guided lasers.
Single-frequency laser diodes are another interesting member of the laser diode family. These
devices are now available to meet the requirements for high-bandwidth communication. Other
advantages of these structures are lower threshold currents and lower power requirements. One
variety of this type of structure is the distributed-feedback (DFB) laser diode (Figure 8-23).
With introduction of a corrugated structure into the cavity of the laser, only light of a very
specific wavelength is diffracted and allowed to oscillate. This yields output wavelengths that
are extremely narrow—a characteristic required for DWDM systems in which many closely
spaced wavelengths are transmitted through the same fiber. Distributed-feedback lasers have
been developed to emit light at fiber optic communication wavelengths between 1300 nm and
1550 nm.
Figure 8-23 Distributed-feedback laser
F
IBER
O
PTIC
T
ELECOMMUNICATION
© 2000 University of Connecticut 325
XIII. P
ACKAGING
Laser diodes are available in a variety of packages. Most have monitoring photodiodes
integrated with the packages. Because lasers inherently emit light from both ends of the cavity,
a photodiode can be placed on one end to monitor and maintain the output power at a certain
level. One of the most popular types of packages is the TO-can style (Figure 8-24) available in
both 5.6-mm and 9-mm-diameter sizes. Either style can be purchased with connectorized fiber
pigtails for convenience. Devices used in telecommunication typically come in either 14-pin
butterfly or dual-in-line (DIL) packages as shown in Figures 8-25 and 8-26. These devices
typically include thermoelectric coolers (TEC) and mounting plates for heat-sinking.
Figure 8-24 Laser diode in TO-can style package
(Courtesy of Newport Corp.)
Figure 8-25 14-pin DIL package
(Courtesy of Lasertron)
F
UNDAMENTALS OF
P
HOTONICS
326 © 2000 University of Connecticut
Figure 8-26 1550-nm DFB laser in butterfly package
(Courtesy of Lasertron)
XIV. D
IRECT
V
ERSUS
E
XTERNAL
M
ODULATION
Lasers and LEDs used in telecommunication applications are modulated using one of two
methods: direct modulation or external modulation.
• In direct modulation (Figure 8-27), the output power of the device varies directly with
the input drive current. Both LEDs and lasers can be directly modulated using analog
and digital signals. The benefit of direct modulation is that it is simple and cheap. The
disadvantage is that it is slower than indirect modulation with limits of less than
approximately 3 GHz.
Figure 8-27 Direct modulation
• In external modulation (Figure 8-28), an external device is used to modulate the
intensity or phase of the light source. The light source remains on while the external
modulator acts like a “shutter” controlled by the information being transmitted. External
modulation is typically used in high-speed applications such as long-haul
telecommunication or cable TV head ends. The benefits of external modulation are that
it is much faster and can be used with higher-power laser sources. The disadvantage is
that it is more expensive and requires complex circuitry to handle the high frequency RF
modulation signal.
F
IBER
O
PTIC
T
ELECOMMUNICATION
© 2000 University of Connecticut 327
Figure 8-28 External modulation
External modulation is typically accomplished using an integrated optical modulator that
incorporates a waveguide Mach-Zehnder interferometer fabricated on a slab of lithium niobate
(LiNbO
3
). The waveguide is created using a lithographic process similar to that used in the
manufacturing of semiconductors. The waveguide region is slightly doped with impurities to
increase the index of refraction so that the light is guided through the device (Figure 8-29).
Figure 8-29 External modulation using Mach-Zehnder waveguide interferometer
Light entering the modulator (via fiber pigtail) is split into two paths. One path is unchanged or
unmodulated. The other path has electrodes placed across it. Because LiNbO
3
is an electro-optic
material, when a voltage is placed across the waveguide its index of refraction is changed,
causing a phase delay proportional to the amplitude of the applied voltage. When the light is
then recombined, the two waves interfere with one another. If the two waves are in phase, the
interference is constructive and the output is on. If the two waves are out of phase, the
interference is destructive and the waves cancel each other. The input voltage associated with a
180° phase shift is known as V
π
. The induced phase shift can be calculated using:
Phase shift = ∆θ = 180° × V
in
/V
π
(8-18)
where V
in
is the voltage applied to the modulator. Lithium niobate modulators are well
developed and used extensively in both CATV and telecommunication applications. Devices are
available at both the 1310-nm and 1550-nm wavelengths.
F
UNDAMENTALS OF
P
HOTONICS
328 © 2000 University of Connecticut
XV.
F
IBER
O
PTIC
D
ETECTORS
The purpose of a fiber optic detector is to convert light emanating from the optical fiber back
into an electrical signal. The choice of a fiber optic detector depends on several factors
including wavelength, responsivity, and speed or rise time. Figure 8-30 depicts the various types
of detectors and their spectral responses.
Figure 8-30 Detector spectral response
The process by which light is converted into an electrical signal is the opposite of the process
that produces the light. Light striking the detector generates a small electrical current that is
amplified by an external circuit. Absorbed photons excite electrons from the valence band to the
conduction band, resulting in the creation of an electron-hole pair. Under the influence of a bias
voltage these carriers move through the material and induce a current in the external circuit. For
each electron-hole pair created, the result is an electron flowing in the circuit. Typical current
levels are small and require some amplification as shown in Figure 8-31.
Figure 8-31 Typical detector amplifier circuit
F
IBER
O
PTIC
T
ELECOMMUNICATION
© 2000 University of Connecticut 329
The most commonly used photodetectors are the PIN and avalanche photodiodes (APD). The
material composition of the device determines the wavelength sensitivity. In general, silicon
devices are used for detection in the visible portion of the spectrum; InGaAs crystal are used in
the near-infrared portion of the spectrum between 1000 nm and 1700 nm, and germanium PIN
and APDs are used between 800 nm and 1500 nm. Table 8-5 gives some typical photodetector
characteristics:
Table 8-5 Typical Photodetector Characteristics
Photodetector Wavelength (nm) Responsivity (A/W) Dark Current (nA) Rise Time (ns)
Silicon PN 550–850 0.4–0.7 1–5 5–10
Silicon PIN 850–950 0.6–0.8 10 0.070
InGaAs PIN 1310–1550 0.85 0.5–1.0 0.005–5
InGaAs APD 1310–1550 0.80 30 0.100
Germanium 1000–1500 0.70 1000 12
Some of the more important detector parameters listed below are defined and described in
Module 1-6, Optical Detectors and Human Vision.
Responsivity—the ratio of the electrical power to the detector’s output optical power
Quantum efficiency—the ratio of the number of electrons generated by the detector to the
number of photons incident on the detector
Quantum efficiency = (Number of electrons)/Photon
Dark current—the amount of current generated by the detector with no light applied. Dark
current increases about 10% for each temperature increase of 1°C and is much more
prominent in Ge and InGaAs at longer wavelengths than in silicon at shorter wavelengths.
Noise floor—minimum detectable power that a detector can handle. The noise floor is
related to the dark current since the dark current will set the lower limit.
Noise floor = Noise (A)/Responsivity (A/W)
Response time—the time required for the detector to respond to an optical input. The
response time is related to the bandwidth of the detector by
BW = 0.35/t
r
where t
r
is the rise time of the device. The rise time is the time required for the detector to
rise to a value equal to 63.2% of its final steady-state reading.
Noise equivalent power (NEP)—at a given modulation frequency, wavelength, and noise
bandwidth, the incident radiant power that produces a signal-to-noise ratio of one at the
output of the detector (Source: Electronic Industry Association—EIA)
F
UNDAMENTALS OF
P
HOTONICS
330 © 2000 University of Connecticut
XVI. F
IBER
O
PTIC
S
YSTEM
D
ESIGN
C
ONSIDERATIONS
When designing a fiber optic communication system some of the following factors must be
taken into consideration:
• Which modulation and multiplexing technique is best suited for the particular
application?
• Is enough power available at the receiver (power budget)?
• Rise-time and bandwidth characteristics
• Noise effects on system bandwidth, data rate, and bit error rate
• Are erbium-doped fiber amplifiers required?
• What type of fiber is best suited for the application?
• Cost
A. Power Budget
The power arriving at the detector must be sufficient to allow clean detection with few errors.
Clearly, the signal at the receiver must be larger than the noise. The power at the detector, P
r
,
must be above the threshold level or receiver sensitivity P
s
.
P
r
≥ P
s
(8-19)
The receiver sensitivity P
s
is the signal power, in dBm, at the receiver that results in a particular
bit error rate (BER). Typically the BER is chosen to be one error in 10
9
bits or 10
–9
.
Example 7
A receiver has sensitivity
P
s
of –
45 dBm and a BER of 10
–9
. What is the minimum power that must
be incident on the detector?
Solution:
Use Equation 8-3 to find the source power in milliwatts, given the power sensitivity in
dBm. Thus,
–45 dBm = 10 log
1 mW
P
so that
–4.5 –5
= (1 mW) × 10 = 3.16 × 10 mW = 31.6 nanowatts
P
for a probability of error of 1 in 10
9
.
F
IBER
O
PTIC
T
ELECOMMUNICATION
© 2000 University of Connecticut 331
The received power at the detector is a function of:
1. Power emanating from the light source (laser diode or LED)—(P
L
)
2. Source to fiber loss (L
sf
)
3. Fiber loss per km (F
L
) for a length of fiber (L)
4. Connector or splice losses (L
conn
)
5. Fiber to detector loss (L
fd
)
The allocation of power loss among system components is the power budget. The power margin
is the difference between the received power P
r
and the receiver sensitivity P
s
by some margin L
m
.
L
m
= P
r
– P
s
(8-20)
where L
m
is the loss margin in dB
P
r
is the received power
P
s
is the receiver sensitivity in dBm
If all of the loss mechanisms in the system are taken into consideration, the loss margin can be
expressed as Equation 8-21.
L
m
= P
L
– L
sf
– (F
L
× L) – L
conn
– L
fd
– P
s
(8-21)
All units are dB and dBm.
Example 8
A system has the following characteristics:
LED power (
P
L
) = 2 mW (3 dBm)
LED to fiber loss (
L
sf
) = 3 dB
Fiber loss per km (
F
L
) = 0.5 dB/km
Fiber length (
L
) = 40 km
Connector loss (
L
conn
) = 1 dB (one connector between two 20-m fiber lengths)
Fiber to detector loss (
L
fd
) = 3 dB
Receiver sensitivity (P
s
) = –36 dBm
Find the loss margin.
Solution:
L
m
= 3 dBm – 3 dB – (40 km
×
0.5 dB/km) – 1 dB – 3 dB – (–36 dBm) = 12 dB
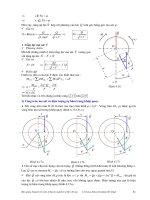
This particular fiber optic loss budget is illustrated in Figure 8-32, with each loss
graphically depicted.
F
UNDAMENTALS OF
P
HOTONICS
332 © 2000 University of Connecticut
Figure 8-32 Fiber optic loss budget
B. Bandwidth and Rise Time Budgets
The transmission data rate of a digital fiber optic communication system is limited by the rise
time of the various components, such as amplifiers and LEDs, and the dispersion of the fiber.
The cumulative effect of all the components should not limit the bandwidth of the system. The
rise time t
r
and bandwidth BW are related by
BW = 0.35/t
r
(8-22)
This equation is used to determine the required system rise time. The appropriate components
are then selected to meet the system rise time requirements. The relationship between total
system rise time and component rise time is given by Equation 8-23
222
1/2
sr1r2r3
( )ttt t=+++
(8-23)
where t
s
is the total system rise time and t
r1
, t
r2
, are the rise times associated with the various
components.
To simplify matters, divide the system into five groups:
1. Transmitting circuits (t
tc
)
2. LED or laser (t
L
)
3. Fiber dispersion (t
f
)
4. Photodiode (t
ph
)
5. Receiver circuits (t
rc
)
F
IBER
O
PTIC
T
ELECOMMUNICATION
© 2000 University of Connecticut 333
The system rise time can then be expressed as
222 2 2
1/2
stcLfphrc
( )ttttt t=++++
(8-24)
The system bandwidth can then be calculated using Equation 8-25 from the total rise time t
s
as
given in Equation 8-24.
BW = 0.35/t
s
(8-25)
Electrical and Optical Bandwidth
• Electrical bandwidth (BW
el
) is defined as the frequency at which the ratio current
out/current in (I
out
/I
in
)
drops to 0.707. (Analog systems are usually specified in terms of
electrical bandwidth.)
• Optical bandwidth (BW
opt
) is the frequency at which the ratio power out/power in
(P
out
/P
in
) drops to 0.5.
Because P
in
and P
out
are directly proportional to I
in
and I
out
(not I
2
in
and I
2
out
), the half-power
point is equivalent to the half-current point. This results in a BW
opt
that is larger than the BW
el
as given in Equation 8-26.
BW
el
= 0.707 × BW
opt
(8-26)
Example 9
A 10-km fiber with a BW
×
length product of 1000 MHz
×
km (optical bandwidth) is used in a
communication system. The rise times of the other components are
t
tc
= 10 ns,
t
L
= 2 ns,
t
ph
= 3 ns,
and
t
rc
= 12 ns. Calculate the
electrical
BW for the system.
Solution:
Because we are looking for the electrical BW, first calculate the electrical BW of the 2-km fiber
from the optical BW and then calculate the rise time
t
r
=
t
f
.
BW
opt
= (1000 MHz
×
km)/10 km = 100 MHz
BW
el
= 0.707
×
100 MHz = 70.7 MHz
The fiber rise time is
t
r
=
t
f
= 0.35/(70.7 MHz) = 4.95 ns
The system rise time is
t
s
= (10
2
+ 2
2
+ 4.95
2
+ 3
2
+ 12
2
)
1/2
= 16.8 ns
System BW
el
is
BW
el
= 0.35/(16.8
×
10
–9
) = 20.8 Mhz