wdm optical interfaces for future fiber radio systems phần 6 potx
Bạn đang xem bản rút gọn của tài liệu. Xem và tải ngay bản đầy đủ của tài liệu tại đây (697.58 KB, 30 trang )
Chapter 4: Characterisation and Enhancement of Links Performance
Incorporating WDM Optical Interface
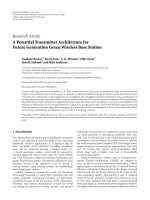
Fig. 4.10 shows the transmission and reflection responses for the double-notch
FBGs used in the demonstration. The characteristic curves at Fig. 4.10(a) show that
the nominal Bragg wavelengths for the notches are 1556.207 nm and 1556.509 nm
with a separation of 0.302 nm between the notches. The Bragg wavelengths can be
tuned to the desired experimental wavelengths by employing suitable mechanical
stretchers. The transmission spectrum shows that the notches have leakages of
approximately -26 and -27 dB at the Bragg wavelengths from which the reflectivity
can be calculated as 99.7% and 99.8% respectively. The characteristic curves at Fig.
-45
-65
-55
1556.0
1556.41556.2
1556.6
Wavelength (nm)
(dB)
Transmission
Reflection
(b)
-45
-65
-55
1556.0
1556.41556.2
1556.6
Wavelength (nm)
(dB)
Transmission
Reflection
(a)
Insertion Loss 0.3 dB
Insertion Loss 0.3 dB
-26 dB
-27 dB
-22 dB
-22.5 dB
-45
-65
-55
1556.0
1556.41556.2
1556.6
Wavelength (nm)
(dB)
Transmission
Reflection
-45
-65
-55
1556.0
1556.41556.2
1556.6
Wavelength (nm)
(dB)
Transmission
Reflection
(b)
-45
-65
-55
1556.0
1556.41556.2
1556.6
Wavelength (nm)
(dB)
Transmission
Reflection
(a)
Insertion Loss 0.3 dB
Insertion Loss 0.3 dB
-26 dB
-27 dB
-22 dB
-22.5 dB
Fig. 4.10: Measured transmission and reflection spectra for the double-notch FBGs to be used in
the experimental characterisation of single and cascaded WDM optical interfaces.
135
Chapter 4: Characterisation and Enhancement of Links Performance
Incorporating WDM Optical Interface
4.10(b) show that the nominal Bragg wavelengths for the notches are 1556.157 nm
and 1556.459 nm with a separation of 0.302 nm between the notches. The
transmission spectrum shows that the notches have leakages of approximately -22
and -22.5 dB at the Bragg wavelengths from which the reflectivity can be calculated
as 99.3% and 99.4% respectively. Also, the reflection spectra demonstrate its sharp
roll-off profiles with minimum side-lobe ripples. The measured insertion losses of
the gratings were approximately 0.3 dB each.
(a)
-41
-43
-42
-44
1555.8
1556.41556.1
1555.8
1556.41556.1
-46
-54
-58
-50
-41
-43
-42
-44
1555.8
1556.41556.1
1555.8
1556.41556.1
-46
-54
-58
-50
(b)
(a)
-41
-43
-42
-44
1555.8
1556.41556.1
1555.8
1556.41556.1
-46
-54
-58
-50
(a)
-41
-43
-42
-44
1555.8
1556.41556.1
-41
-43
-42
-44
1555.8
1556.41556.1
1555.8
1556.41556.1
-46
-54
-58
-50
1555.8
1556.41556.1
-46
-54
-58
-50
-41
-43
-42
-44
1555.8
1556.41556.1
1555.8
1556.41556.1
-46
-54
-58
-50
(b)
-41
-43
-42
-44
1555.8
1556.41556.1
-41
-43
-42
-44
1555.8
1556.41556.1
1555.8
1556.41556.1
-46
-54
-58
-50
1555.8
1556.41556.1
-46
-54
-58
-50
(b)
Fig. 4.11: Measured transmission and reflection spectra for the 50% reflective FBGs to
b
e used in
the experimental characterisation of single and cascaded WDM optical interfaces.
The characteristic curves for 50% reflective FBGs with nominal Bragg
wavelengths of 1556.109 nm and 1556.129 nm are shown in Fig. 4.11. Like before,
these Bragg wavelengths also can be tuned to the desired experimental wavelengths
136
Chapter 4: Characterisation and Enhancement of Links Performance
Incorporating WDM Optical Interface
by employing suitable mechanical stretchers. The transmission spectra show that
46% and 47% of the optical power entering to these FBGs will be transmitted, while
the respective remaining 54% and 53% will be reflected and recovered by the
proposed interface, and eventually, will be reused as optical carriers in the uplink
path. These reflection spectra also indicate its sharp roll-off profiles with minimum
side-lobe ripples. The measured insertion losses of these grating were approximately
0.3 dB each.
4.4.1.2 8-Port Optical Circulators
Two 8-port OCs are required for this experiment. The 8-port OC described in the
previous chapter (Chapter 3) will also be used here. However, due to aging and
multiple uses, the characteristics of the OC have been changed slightly, especially in
port to port insertion losses. The new measurements for the port-to-port insertion
losses are shown in the 2
nd
column of Table 4.1. Due to the unavailability of another
8-port OC, a combination of one 4-port and one 3-port OCs will be used. The port to
port insertion losses of the cascaded OCs are also shown in the 3
rd
column of Table
4.1. The other characteristics of the cascaded OCs (e.g. isolation, directivity etc.) are
very similar to that of the 8-port OC, illustrated in the previous chapter.
Port to Port Insertion Losses of
8-port OC (dB)
Insertion Losses of Cascaded
7-port OCs (dB)
1 to 2 0.7 0.9
2 to 3 1.21 1.21
3 to 4 0.94 1.4
4 to 5 2.56 n/a
5 to 6 3.25 1.35
6 to 7 1.14 1.55
7 to 8 1.13 n/a
Table 4.1: Port-to- port insertion losses of the optical circulators
137
Chapter 4: Characterisation and Enhancement of Links Performance
Incorporating WDM Optical Interface
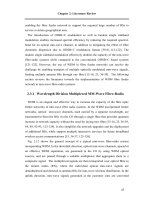
4.4.2 Experimental Setup
Fig. 4.12 shows the experimental set up. In the downlink direction, three narrow-
linewidth lasers λ1 (1556.2 nm), λ2 (1556.4 nm) and λ3 (1556.6 nm) were combined
and applied to a DE-MZM. A 37.5-GHz mm-wave signal was generated by mixing a
37.5-GHz local oscillator (LO) signal with 155 Mb/s data in BPSK format. The
mixer output was then amplified and applied to the DE-MZM that generates
OSSB+C modulated optical mm-wave signals, with three optical carriers and their
respective sidebands interleaved, similar to the interleaved signal generated in
simulation characterisation. The interleaved signal was again amplified by an EDFA
and passed through an optical BPF prior to being transported over 10 km of SMF to
the two concatenated WDM optical interfaces (WDM Optical Interface1 and WDM
1. IN
3. DL Drop
4. λ-Re-Use
5. ADD
7. OUT
A
D
BPSK
Generator
B
C
Uplink
OSSB2+C2
DL
Ch
2
E
DL
Ch
3
F
Data
35 GHz
PLL
LO
PD
PD & Data
Recovery
SMF
EDFA
BPF
Data
155 Mb/s
LO
37.5 GHz
90
0
DE-MZM
d.c
PC
λ1
λ3
λ2
BPSK
Generator
OSSB+C
7
3
45
1
WDM Optical
Interface1
7
3
45
1
WDM Optical
Interface2
PD & Data
Recovery
UL
Ch
2
BPF: band pass filter
SMF: single-mode fiber
PD: photo detector
PC: polarization controller
LO: local oscillator
PLL: phase locked loop
-50
-30
-10
10
1556
1556.5 1557
Ch
2
Ch
1
Ch
3
1. IN
3. DL Drop
4. λ-Re-Use
5. ADD
7. OUT
A
D
BPSK
Generator
B
C
Uplink
OSSB2+C2
DL
Ch
2
E
DL
Ch
3
F
Data
35 GHz
PLL
LO
PD
PD & Data
Recovery
SMF
EDFA
BPF
Data
155 Mb/s
LO
37.5 GHz
90
0
DE-MZMDE-MZM
d.c
PC
λ1
λ3
λ2
BPSK
Generator
OSSB+C
7
3
45
1
WDM Optical
Interface1
7
3
45
1
WDM Optical
Interface1
7
3
45
1
WDM Optical
Interface2
7
3
45
1
WDM Optical
Interface2
PD & Data
Recovery
UL
Ch
2
BPF: band pass filter
SMF: single-mode fiber
PD: photo detector
PC: polarization controller
LO: local oscillator
PLL: phase locked loop
-50
-30
-10
10
1556
1556.5 1557
Ch
2
Ch
1
Ch
3
-50
-30
-10
10
1556
1556.5 1557
Ch
2
Ch
1
Ch
3
Fig. 4.12: Experimental setup to characterise the effects of optical impairments in single as well as
cascaded WDM optical interfaces in a WI-DWDM fibre-radio system.
138
Chapter 4: Characterisation and Enhancement of Links Performance
Incorporating WDM Optical Interface
Optical Interface2). The signal entering concatenated interfaces is shown in the inset
of Fig. 4.12, where the three interleaved carriers with their respective sidebands are
denoted as Ch
1
, Ch
2
and Ch
3
for simplicity. Like before, each interface in Fig. 4.12 is
shown as a block with five ports, namely, the input (IN), the downlink drop (DL
Drop), the wavelength reuse drop (λ-Re-Use), the add (ADD) and the output (OUT)
port. During the experiment WDM Optical Interface1 was assigned to drop and add
Ch
2
while WDM Optical Interface2 was to drop and add Ch
3
. In the uplink direction,
the OSSB+C formatted UL Ch
2
was generated by modulating the recovered λ-Re-
Use carrier with another 37.5 GHz-band UL mm-wave signal carrying 155 Mb/s
BPSK data. The UL Ch
2
was then routed to WDM Optical Interface1 via the ADD
port.
1
2
3
OSA
1
2
3
OSA
Fig. 4.13: Filtering arrangements used in recovering the channels at points A, D and F.
The effects of impairments on the WI-DWDM channels due to traversing the
cascaded interfaces were characterised by recovering the transmitted channels at
positions A, B, C, D, E, and F indicated in Fig. 4.12. To make the measurements
comparable, the same photodetection and data recovery circuit was used for the
different channels at different positions with the characteristic parameters
unchanged. The desired channels at points A, D and F were recovered by using a
tunable double-notch FBG alongwith a 3–port OC, which are shown in Fig. 4.13.
139
Chapter 4: Characterisation and Enhancement of Links Performance
Incorporating WDM Optical Interface
4.4.3 Experimental Results
Fig. 4.14 shows the recovered BER curves for downlink Ch
2
at point A with the
other two channels ON and OFF, respectively. The recovered downlink Ch
2
experiences a negligible ~ 0.15 dB power penalty due to out-of-band crosstalk from
the neighboring WI-DWDM channels.
-4
-5
-6
-7
-8
-9
-16 -15.5 -15 -14.5 -14
C
h
2
a
t
A
,
C
h
1
a
n
d
C
h
3
O
N
C
h
2
a
t
A
,
C
h
1
a
n
d
C
h
3
O
F
F
Received Optical Power (dBm)
l
o
g
l
o
g
1
0
1
0
(
(
B
E
R
)
)
-4
-5
-6
-7
-8
-9
-4
-5
-6
-7
-8
-9
-16 -15.5 -15 -14.5 -14
C
h
2
a
t
A
,
C
h
1
a
n
d
C
h
3
O
N
C
h
2
a
t
A
,
C
h
1
a
n
d
C
h
3
O
F
F
Received Optical Power (dBm)
l
o
g
l
o
g
1
0
1
0
(
(
B
E
R
)
)
Fig. 4.14: Measured BER curves as a function of received optical power at point A showing
downlink Ch
2
with Ch
1
and Ch
3
ON and OFF respectively.
The interface causing the impairments to the downlink as well as uplink Ch
2
were
described in Section 4.3.2. To quantify the effects of those impairments
experimentally, downlink Ch
2
was measured at point B under three different
conditions: (i) removing downlink Ch
1
and Ch
3
from the WI-DWDM channels
alongwith the uplink Ch
2
from the ADD port of WDM Optical Interface1; (ii)
removing only the uplink Ch
2
from the ADD port of WDM Optical Interface1, but
having downlink Ch
1
and Ch
3
present; and (iii) having all the downlink WI-DWDM
channels alongwith the added uplink Ch
2
present. The recovered BER curves can be
seen in Fig. 4.15. It again shows that the downlink Ch
2
at the DL Drop port
140
Chapter 4: Characterisation and Enhancement of Links Performance
Incorporating WDM Optical Interface
experiences a negligible ~0.15 dB power penalty due to the presence of out-of-band
crosstalk, which increases to ~0.30 dB at the presence of in-band crosstalk from
uplink Ch
2
. However, compared to the BER curves at A (again shown in Fig. 4.15
for clarity), downlink Ch
2
at B exhibits a negative power penalty of ~ 0.30 dB which
is due to the reduction of the CSR of downlink Ch
2
by approximately 3 dB while
54% of the carrier is recovered with FBG2, which is explored in detail in the
following sections.
In the uplink direction, the composite spectrum of the downlink through channels
as well as the uplink Ch
2
after added to the interface is recovered at point D, which
can be seen from Fig. 4.16 (a). It shows that, as expected, uplink Ch
2
is much weaker
than the neighboring downlink channels due to the carrier reuse, the higher insertion
loss in OSSB+C generation, as well as the removal of EDFA from the BSs. This
weaker uplink signal may cause greater out-of-band crosstalk while recovered, and
may limit the link performance immensely.
l
o
g
l
o
g
1
0
1
0
(
(
B
E
R
)
)
Received Optical Power (dBm)
C
h
2
a
t
A
w
i
t
h
C
h
1
a
n
d
C
h
3
O
N
-4
-5
-6
-7
-8
-9
-16.5 -16 -15.5 -15 -14.5 -14
C
h
2
a
t
B
w
i
t
h
C
h
1
a
n
d
C
h
3
O
N
,
n
o
U
L
C
h
2
a
t
B
w
i
t
h
C
h
1
a
n
d
C
h
3
O
N
a
n
d
a
d
d
e
d
U
L
C
h
2
a
t
B
,
s
i
n
g
l
e
c
h
a
n
n
e
l
t
r
a
n
s
m
i
s
s
i
o
n
l
o
g
l
o
g
1
0
1
0
(
(
B
E
R
)
)
Received Optical Power (dBm)
C
h
2
a
t
A
w
i
t
h
C
h
1
a
n
d
C
h
3
O
N
-4
-5
-6
-7
-8
-9
-4
-5
-6
-7
-8
-9
-16.5 -16 -15.5 -15 -14.5 -14-16.5 -16 -15.5 -15 -14.5 -14
C
h
2
a
t
B
w
i
t
h
C
h
1
a
n
d
C
h
3
O
N
,
n
o
U
L
C
h
2
a
t
B
w
i
t
h
C
h
1
a
n
d
C
h
3
O
N
a
n
d
a
d
d
e
d
U
L
C
h
2
a
t
B
,
s
i
n
g
l
e
c
h
a
n
n
e
l
t
r
a
n
s
m
i
s
s
i
o
n
Fig. 4.15: Measured BER curves as a function of received optical power at point B for downlink Ch
2
with: (i) none of the downlink Ch
1
, Ch
3
or
uplink Ch
2
present, (ii) downlink Ch
1
and Ch
3
present,
but no uplink Ch
2,
and (iii) all the downlink as well as uplink channels present, in addition to
downlink Ch
2
at point A for comparison.
141
Chapter 4: Characterisation and Enhancement of Links Performance
Incorporating WDM Optical Interface
Shown in Fig. 4.16(b), the effects of the impairments in uplink direction are
quantified by measuring BER curves for uplink Ch
2
at the points C and D. The
uplink Ch
2
exhibits a ~0.65 dB additional power penalty at point D which can be
potentially ascribed to the in-band and out-of-band crosstalk as explained earlier.
-4
-5
-6
-7
-8
-9
-14 -13 -12 -11
Uplink Ch
2
at D
Uplink Ch
2
at C
l
o
g
l
o
g
1
0
1
0
(
(
B
E
R
)
)
Received Optical Power (dBm)
(b)
(a)
Wavelength (nm)
Optical Power (dBm)
-50
-30
-10
10
1556 1556.5 1557
UL
Ch
2
Ch
1
Ch
3
-4
-5
-6
-7
-8
-9
-14 -13 -12 -11
Uplink Ch
2
at D
Uplink Ch
2
at C
l
o
g
l
o
g
1
0
1
0
(
(
B
E
R
)
)
Received Optical Power (dBm)
(b)
-4
-5
-6
-7
-8
-9
-4
-5
-6
-7
-8
-9
-14 -13 -12 -11
Uplink Ch
2
at D
Uplink Ch
2
at C
l
o
g
l
o
g
1
0
1
0
(
(
B
E
R
)
)
Received Optical Power (dBm)
(b)
(a)
Wavelength (nm)
Optical Power (dBm)
-50
-30
-10
10
1556 1556.5 1557
UL
Ch
2
Ch
1
Ch
3
(a)
Wavelength (nm)
Optical Power (dBm)
-50
-30
-10
10
1556 1556.5 1557
UL
Ch
2
Ch
1
Ch
3
Wavelength (nm)
Optical Power (dBm)
-50
-30
-10
10
1556 1556.5 1557
UL
Ch
2
Ch
1
Ch
3
Fig. 4.16: (a):
Optical spectrum at point D with uplink Ch
2
added to the WDM Optical Interface1, (b):
BER curves for uplink Ch
2
recovered at points C and D respectively.
In the cascaded configuration, downlink Ch
2
and Ch
3
were recovered at points B
and E, respectively. The measured optical spectra and the respective BER curves are
142
Chapter 4: Characterisation and Enhancement of Links Performance
Incorporating WDM Optical Interface
shown in Fig. 4.17. The measured BER is of the order of 10
-9
which confirms the
functionality of the proposed interfaces in cascade. The difference in sensitivity of
downlink Ch
3
(~0.25 dB) is mainly due to the difference in CSR as well as the
performance degradation due to traversing WDM Optical Interface1 before entering
to WDM Optical Interface2.
Wavelength (nm)
Optical Power (dBm)
-80
-60
-40
1556.2
1556.6 1557
-20
0
DL Ch
2
at B
DL Ch
3
at E
(a)
-4
-5
-6
-7
-8
-9
-16
-15
-14
DL Ch
3
at E
DL Ch
2
at B
l
o
g
l
o
g
1
0
1
0
(
(
B
E
R
)
)
Received Optical Power (dBm)
(b)
Wavelength (nm)
O
p
t
i
c
a
l
P
o
w
e
r
(
d
B
m
)
-80
-60
-40
1556.2
1556.6 1557
-20
0
DL Ch
2
at B
DL Ch
3
at E
(a)
Wavelength (nm)
O
p
t
i
c
a
l
P
o
w
e
r
(
d
B
m
)
-80
-60
-40
1556.2
1556.6 1557
-20
0
DL Ch
2
at B
DL Ch
3
at E
Wavelength (nm)
O
p
t
i
c
a
l
P
o
w
e
r
(
d
B
m
)
-80
-60
-40
1556.2
1556.6 1557
-20
0
DL Ch
2
at B
DL Ch
3
at E
DL Ch
2
at B
DL Ch
3
at E
(a)
-4
-5
-6
-7
-8
-9
-16
-15
-14
DL Ch
3
at E
DL Ch
2
at B
l
o
g
l
o
g
1
0
1
0
(
(
B
E
R
)
)
Received Optical Power (dBm)
(b)
-4
-5
-6
-7
-8
-9
-16
-15
-14
DL Ch
3
at E
DL Ch
2
at B
l
o
g
l
o
g
1
0
1
0
(
(
B
E
R
)
)
Received Optical Power (dBm)
-4
-5
-6
-7
-8
-9
-16
-15
-14
DL Ch
3
at E
DL Ch
2
at B
l
o
g
l
o
g
1
0
1
0
(
(
B
E
R
)
)
Received Optical Power (dBm)
(b)
Fig. 4.17: (a): Recovered optical spectra at points B and E showing DL Ch
2
and Ch
3
, (b): BER
curves at points B and E for DL Ch
2
and Ch
3
respectively.
143
Chapter 4: Characterisation and Enhancement of Links Performance
Incorporating WDM Optical Interface
The cascading effects on the through channels were quantified by recovering
downlink Ch
1
at points A, D and F with simultaneous drops of downlink Ch
2
and Ch
3
from the respective interfaces. The recovered optical spectra at points D and F are
shown in Fig. 4.18, while optical spectrum at point A has already been shown in the
inset of Fig. 4.12. The measured optical spectra at A, D and F show that, due to lossy
OCs, the through downlink Ch
1
experiences unusual losses of 3.1 and 3.3 dB in
WDM Optical Interface1 and WDM Optical Interface2 [typical loss = 1 dB]. The
Wavelength (nm)
Optical Power (dBm)
-50
-30
-10
10
1556 1556.5 1557
Ch
1
Ch
3
(a)
Wavelength (nm)
Optical Power (dBm)
-50
-30
-10
10
1556 1556.5 1557
Ch
1
(b)
Wavelength (nm)
Optical Power (dBm)
-50
-30
-10
10
1556 1556.5 1557
Ch
1
Ch
3
(a)
Wavelength (nm)
Optical Power (dBm)
-50
-30
-10
10
1556 1556.5 1557
Ch
1
Ch
3
Wavelength (nm)
Optical Power (dBm)
-50
-30
-10
10
1556 1556.5 1557
Ch
1
Ch
3
(a)
Wavelength (nm)
Optical Power (dBm)
-50
-30
-10
10
1556 1556.5 1557
Ch
1
(b)
Wavelength (nm)
Optical Power (dBm)
-50
-30
-10
10
1556 1556.5 1557
Ch
1
Wavelength (nm)
Optical Power (dBm)
-50
-30
-10
10
1556 1556.5 1557
Ch
1
(b)
Fig. 4.18: Recovered optical spectra of downlink Ch
1
at points: (a): D and (b): F respectively.
144
Chapter 4: Characterisation and Enhancement of Links Performance
Incorporating WDM Optical Interface
respective BER curves shown in Fig. 4.19 confirm that, at each stage of cascade, the
through channels experience approximately 0.4 dB additional power penalty, which
can be attributed to the unusual losses of the through channels as well as the
characteristics of the double-notch FBGs used as bidirectional reflective components
within the interfaces.
The effects of using additional filtering arrangement at points A, D, and F are
quantified by recovering downlink Ch
1
at D with and without filtering arrangement.
The recovered BER curves (shown in Fig. 4.20) indicate very negligible effects for
using such additional filtering arrangements.
-4
-5
-6
-7
-8
-9
-17 -16 -15 -14 -13
Ch
1
at A
Ch
1
at D
Ch
1
at F
l
o
g
l
o
g
1
0
1
0
(
(
B
E
R
)
)
Received Optical Power (dBm)
-4
-5
-6
-7
-8
-9
-17 -16 -15 -14 -13
Ch
1
at A
Ch
1
at D
Ch
1
at F
l
o
g
l
o
g
1
0
1
0
(
(
B
E
R
)
)
Received Optical Power (dBm)
Fig. 4.19: Measured BER curves as a function of received optical power at points A, D, and F for
downlink Ch
2
.
Therefore, similar to the simulation results, the experimentally characterised results
also confirm the operation of the proposed WDM optical interface for WI-DWDM
mm-wave fibre radio systems, both in single as well as cascaded configurations. The
experimental results also indicate the viability of the proposed interface to be used in
145
Chapter 4: Characterisation and Enhancement of Links Performance
Incorporating WDM Optical Interface
networks with additional power penalty no more than 0.5 dB for each stage of
cascade.
-4
-5
-6
-7
-8
-9
-16.5 -16 -15.5 -15 -14.5 -14 -13.5
With recovery filter
No recovery filter
l
o
g
l
o
g
1
0
1
0
(
(
B
E
R
)
)
Received Optical Power (dBm)
Ch
1
at D:
-4
-5
-6
-7
-8
-9
-16.5 -16 -15.5 -15 -14.5 -14 -13.5
With recovery filter
No recovery filter
l
o
g
l
o
g
1
0
1
0
(
(
B
E
R
)
)
Received Optical Power (dBm)
Ch
1
at D:
Fig. 4.20: Measured BER curves as a function of received optical power for downlink Ch
1
at point
D with and without recovering filtering arrangement.
4.4.4 Discussion
The ability of the WDM optical interface to be used in both single as well as
cascaded configurations indicate that, WDM optical interface is a promising scheme
in future DWDM mm-wave fibre-radio networks which enables spectrally efficient
WI, efficient wavelength utilisation and transparent wavelength routing to the BSs,
while simplifying the BSs by removing the uplink light source completely.
The one drawback of the scheme is the generation of weaker uplink channels that
may cause greater out-of- band crosstalk while recovered in the CO, and may limit
the link performance immensely. This can be avoided by using optical filters with
stringent characteristics of having very sharp roll-off and ultra-narrow notch-
bandwidths. Also, the large differences between the interleaved uplink and downlink
146
Chapter 4: Characterisation and Enhancement of Links Performance
Incorporating WDM Optical Interface
channels may stimulate the effects of nonlinearity in the link, which may limit the
network dimensioning. Therefore, in order to maximise the greater uplink channels,
proper link budget as well maximizing the delivery of reuse carrier is essential.
Sections 4.6 to 4.9 will explore such techniques that resolve this limitation to a
remarkable extent.
The setup used in experimental demonstration (shown in Fig. 4.12) is also having
some limitations. The demonstrated setup is the worst case scenario in performance
degradation potential and data on various modulated channels are partially
correlated. Therefore, the exhibited penalties may contain contributions from the data
correlation in addition to other network impairments. In order to quantify data
correlation, the delay between data on various modulated channels at the cascaded
interfaces end can be calculated as follows:
LD
λ
∆
=Τ = 17 psec/nm/km * 0.2 nm * 10 km = 34 psec
where, T = Delay (psec),
D = dispersion = 17 ps/nm/km
λ
∆ = channel separation =0.2 nm, and
L = length of fibre = 10 km
On the other hand, the time duration of 155 Mb/s data is 6.45 nsec = 6450 psec.
These mean that the group-delay difference of data transmitted on 0.2-nm-separated
optical carriers is very small and correlation effects are present. This is however, can
be easily overcome by generating each of the channels independently, which we
were unable to do due to resource limitation.
147
Chapter 4: Characterisation and Enhancement of Links Performance
Incorporating WDM Optical Interface
4.5 Modelling of Fibre-Radio Networks Incorporating
Cascaded WDM Optical Interfaces
Sections 4.3 and 4.4 characterised the effects of optical impairments caused by
single as well as cascaded WDM optical interfaces in a WI-DWDM mm-wave fibre-
radio network. The cascade was comprised of two WDM optical interfaces
connected by a small piece of patchcord, having no ‘in between’ fibre span. These
analyses are particularly important in quantifying the power penalties introduced by
each stage of cascade, in addition to the impacts on the performance of drops and
adds channels, while deployed in a practical network.
However, a typical fibre-radio network configured in star-tree architecture [36-
39], is expected to contain more than two WDM optical interfaces in cascade in the
remote nodes (RNs). Also, the networks configured in ring/bus architecture [40-43],
will be having multiple WDM optical interfaces in cascade, along with a span of
fibre within each pair of cascaded interfaces. Therefore, from architectural
considerations of the networks, the performance of the WDM optical interface needs
to be further analysed. This section thus focuses in modelling of mm-wave fibre-
radio networks (based on power budget calculation) incorporating the WDM optical
ADD
DL
Drop
OUT
IN
λ-Re
-Use
L
DropWOI
L
ThroughWOI
L
ADDWOI
WDM Optical Interface (WOI)
PP
Drop
PP
Through
PP
ADD
ADD
DL
Drop
OUT
IN
λ-Re
-Use
L
DropWOI
L
ThroughWOI
L
ADDWOI
WDM Optical Interface (WOI)
PP
Drop
PP
Through
PP
ADD
Fig. 4.21: Illustration of parameters of WDM Optical Interface used in the modelling of networks
based on power budget calculation of a link incorporating WDM optical interfaces.
148
Chapter 4: Characterisation and Enhancement of Links Performance
Incorporating WDM Optical Interface
interface, from which number of allowable units in cascade can be predicted.
The WDM optical interface (WOI) parameters used in the analysis are illustrated
in Fig. 4.21 and Table 4.2. The parameters are obtained from the experimental results
presented in Section 4.4.
Symbol Description Value
L
ThroughWOI
Insertion loss experienced by the through
channels in a WDM optical interface
3.2 (dB)
L
DropWOI
Insertion loss experienced by the downlink drop
channel in a WDM optical interface. It also
includes the 3-dB recovery of the carrier for
uplink communication
5.8 (dB)
L
ADDWOI
Insertion loss experienced by the uplink add
channel in a WDM optical interface
1.3 (dB)
PP
Through
Power penalty experienced by the through
channels for traversing each stage of WDM
optical interface
0.4 (dB)
PP
IN-DL Drop
Power penalty experienced by the downlink
drop channel for traversing IN-DL Drop part of
WDM optical interface
-0.3 (dB)
PP
ADD-OUT
Power penalty experienced by the uplink add
channel for traversing ADD-OUT part of
WDM optical interface
0.65 (dB)
L
MOD
Insertion Loss of OSSB+C modulator in CO 15.9 (dB)
G
BAMP
Amplification by boost EDFA in CO 22.5 (dB)
L
SMF
Attenuation of signal in 10 km SMF 2.2 (dB)
T
LSCO
Power launched from the light-source 0.3 (dBm)
L
MUX
Insertion loss of the optical combiner 4.9 (dB)
Table 4.2: WDM Optical Interface parameters to be used in performance analysis in networks
considerations.
149
Chapter 4: Characterisation and Enhancement of Links Performance
Incorporating WDM Optical Interface
The interface parameters include the insertion losses as well as the power penalties of
the through and add/drop channels, while traversing single and cascaded WDM
optical interfaces. Other parameters included in the Table 4.2 are the insertion losses
of the OSSB+C generator and optical combiner in the CO, the power launched from
the light-source at the CO, the amplification of signals by boost EDFA, and the
attenuation of signal in 10 km SMF. Most of the values shown in Table 4.2 are
related to the transmission and detection of downlink and uplink Ch
2
by the
experiment in Section 4.4. The calculation of the loss/gain parameters are based on
the peak powers of the measured optical spectra.
4.5.1 Network Architectures and Optical Power Budget
The performance of WDM fibre-radio systems were investigated based on different
network topologies and architectures with their relative merits and demerit [36-48].
Among these architectures, star-tree and rings/bus architectures are considered very
effective in delivering future broadband wireless services to customers via fibre-
radio networks. This section thus considers both star-tree and rings/bus networks in
analysing the performance of links incorporating WDM optical interfaces.
4.5.1.1 Star-Tree Networks
A generic start-tree configured WI-DWDM fibre-radio network incorporating
WDM optical interfaces is shown in Fig. 4.22. fibre links from the CO form the ‘star’
part of the architecture, while the ‘tree’ part is at the RNs with each branch feeding
different BSs through the respective WOIs. A unique wavelength is used to feed each
BS connected by a common arm of star, with wavelengths being reused within
different arms. WOIs can be used in cascade in the RNs to enable OADM
functionality to the BSs, in addition to provide optical carrier in the uplink path. A
single DWDM optical carrier will be used for both upstream and downstream
transmission from and to a BS, and the rf signals on any DWDM carrier are those
transmitted and received by the specific BS.
In the CO, a large number DWDM optical carriers are used to generate OSSB+C
modulated optical mm-wave signals, combined using a suitable multiplexer and
150
Chapter 4: Characterisation and Enhancement of Links Performance
Incorporating WDM Optical Interface
amplified before launching onto the fibre. The amplified signals will be then
transported to the RNs where the composite signal will be demultiplexed by using
concatenated WOIs and drop the desired downlink signals as well as the uplink
optical carriers to the respective BSs. In the uplink direction, each BS will generate
OSSB+C modulated optical mm-wave signal by reusing the recovered optical carrier
and route it to the fibre network through the respective WOI in the RN. The fibre
network then enable the uplink signals to be transported to the CO for further
processing. One of the main benefits of this architecture is the possibility of sharing
the optical carriers between different feeder networks of the RNs [36-37].
CO
WOI: WDM Optical
Interface
WOI
1
WOI
2
WOI
N
BS
1
BS
2
BS
N
Remote Node
BS
1
BS
2
BS
N
WOI
1
WOI
2
WOI
N
Remote Node
(RN)
CO
WOI: WDM Optical
Interface
WOI
1
WOI
2
WOI
N
BS
1
BS
2
BS
N
Remote Node
BS
1
BS
2
BS
N
WOI
1
WOI
2
WOI
N
Remote Node
(RN)
Fig. 4.22: Generic star-tree architecture for WI-DWDM fibre-radio network incorporating WDM
optical interfaces.
To calculate the power budget of an optical link in star-tree network architecture,
one branch of the star (shown in Fig. 4.22) is simplified as Fig. 4.23, where the
components and subsystems contributing in power budget calculation are clearly
shown. Shown in Fig. 4.23, the link is assumed to support N BSs through a single
151
Chapter 4: Characterisation and Enhancement of Links Performance
Incorporating WDM Optical Interface
RN, where each of the BS is represented by the relevant WOI. Throughout this
section, ‘BS’ and ‘WOI’ terms will be used for similar meanings. The power budget
and the power margin in the downlink direction for the Mth BS (1≤ M ≤ N), can be
calculated by:
DLPD
SMF
EDFA
λ
1
λ
Ν
λ
2
DL
OSSB+C
∑
WOI
1
WOI
N
WOI
M
Central
Office
SMF
UL
OSSB+C
∑
PD
N
PD
2
PD
1
Remote Node
DLPD
SMF
EDFA
λ
1
λ
Ν
λ
2
DL
OSSB+C
∑
WOI
1
WOI
N
WOI
M
Central
Office
SMF
UL
OSSB+C
∑
PD
N
PD
2
PD
1
Remote Node
Fig. 4.23: Simplified optical link in star-tree architecture showing the relevant components and
subsystems in the CO and RN.
PR
BSM
= T
LSCO
– L
MUX
– L
MOD
+ G
BAMP
– L
SMF
– (M-1)L
ThroughWOI
– L
DropWOI
……………… (1)
PM
BSM
= PR
BSM
– Sensitivity
BSM
……………… (2)
where PR
BSM
and PM
BSM
are the received optical power and the power margin at
photodetector (PD) of Mth BS (BS
M
), Sensitivity
BSM
is the sensitivity at the PD of
BS
M
, T
LSCO
is the optical power from the respective light-source in the CO, L
MOD
is
the loss in OSSB+C modulator, G
BAMP
is the gain from the boost-amplifier in the
downlink path, L
SMF
is the loss in fibre span between the CO and the RN, L
ThroughWOI
is the through channel loss of WOI, and L
DropWOI
is the drop-channel loss of WOI
while recovering the desired downlink by the respective WOI. In this calculation, the
losses in the connecting patchcords between the WOIs and the BSs are ignored due
to very shorter distances.
By using the values noted in Table 4.2, Equation (1) can be simplified as:
152
Chapter 4: Characterisation and Enhancement of Links Performance
Incorporating WDM Optical Interface
PR
BSM
= -6.0 – (M-1)3.2 ………………… (3)
Therefore, received optical power at the PD of BS
1
(where M = 1),
PR
BS1
= - 6.0 (dBm)
The power margin at the PD of BS
1
can be calculated by using the sensitivity of
the recovered signal (shown in Fig. 4.15), which is -14.2 dBm. Therefore, power
margin at the PD of BS
1
,
PM
BS1
= 8.2 (dB)
If the power penalty is considered to add up linearly with increasing number of
BSs and the BSs ( or WOIs) are considered to be identical, then the number BSs
supported by the link can be calculated by:
PM
BSN
= (N – 1)( PP
Through
+ L
ThroughWOI
) ………………… (4)
where N is the number of WOIs in cascade in the RN, PM
BS1
is the power margin
at the PD of BS
1
, PP
Through
is the power penalty experienced by the through
channels for traversing each stage of WOI, and L
ThroughWOI
is the insertion loss
experienced by the through channels in a WOI.
By using the values of the parameters noted in Table 4.2, and Equation (4), number
of WOIs in cascade can be calculated by:
N = 1+ PM
BS1
/(PP
Through
+ L
ThroughWOI
) = 1+8.2/(0.4+3.2) = 3.28
≈
3 units
However, if the lossy multiport OCs in the WOIs in the experiment (described in
Section 4.4) are replaced with standard OCs having typical through channel
insertion loss (typical through loss 1dB/WOI), and typical drop channel insertion loss
153
Chapter 4: Characterisation and Enhancement of Links Performance
Incorporating WDM Optical Interface
(typical loss 1dB/WOI), the number of units in cascade will increase to 8. Also, if
the insertion of the OSSB+C generator in CO can reduced to 9 dB, the number of
units in cascade will increase to 13.
Therefore WOI proposed in Section 3.4 can be a suitable candidate in future WI-
DWDM mm-wave fibre-radio networks, configured in star-tree architecture, where
cascaded interfaces will be used in the RNs to enable OADM functionality to the
BSs, in addition to provide optical carriers for the upstream transmission.
4.5.1.2 Ring/Bus Networks
A generic ring/bus configured WI-DWDM fibre-radio network incorporating WOIs
is shown in Fig. 4.24. This architecture allows the CO to distribute wavelengths to
remote antenna BSs that are placed along the ring, with a WOI enabling OADM
functionality to the relevant BS, in addition to delivering the optical carrier for
upstream transmission. Each of the BSs fed from the CO have their own unique
wavelength to be used for both uplink and downlink communication. In the CO, a
large number optical carriers are used to generate OSSB+C modulated optical mm-
wave signals, combined using a suitable multiplexer and amplified before launching
onto the fibre ring. The amplified signals will be then transported along the ring
where the relevant WOI will recover the downlink signal relevant to the BS and
enables the through channels to be routed to the next BSs. The WOI also provides
uplink optical carrier to the respective BS by recovering 50% of the optical carrier
from the recovered downlink signal. In the uplink direction, each BS generates
OSSB+C modulated optical mm-wave signal by reusing the recovered optical carrier
and routes it to the fibre ring via the relevant WOI. The uplink signal then passes
through the remaining BSs with the through channels along the ring and transported
to the CO for further processing.
This architecture is typically unidirectional and the BSs in the ring are separated
typically by equal distances. It has the potential for fault restoration using second
protection ring allowing a fibre break between nodes or a failure of node to be
bypassed [49-52]. It also enables easy implementation of rf carrier reuse between the
BSs, in addition to allowing dynamic frequency allocation, since frequency
154
Chapter 4: Characterisation and Enhancement of Links Performance
Incorporating WDM Optical Interface
assignment schemes can be controlled from the CO [53-55]. The main problem with
a passive ring network is the non-uniform signal quality provided to different BSs,
alongwith cumulative component loss along the ring.
CO
WOI
2
BS
1
WOI
1
WOI
N
BS
2
BS
N
WOI: WDM Optical Interface
S
M
F
1
S
M
F
2
S
M
F
N
+
1
S
M
F
N
CO
WOI
2
WOI
2
WOI
2
BS
1
WOI
1
WOI
1
WOI
1
WOI
N
WOI
N
WOI
N
BS
2
BS
N
WOI: WDM Optical Interface
S
M
F
1
S
M
F
2
S
M
F
N
+
1
S
M
F
N
Fig. 4.24: Generic ring/bus architecture for WI-DWDM fibre-radio network incorporating WDM
optical interfaces.
To calculate the power budget of an optical link in ring/bus network architecture,
the generic architecture shown in Fig. 4.24 can be redrawn as Fig. 4.25, where the
components and subsystems contributing in power budget calculation are clearly
shown. Simular to star-tree network, the ring is assumed to support N BSs through a
single CO, where each of the BS is represented by the relevant WOI. Shown in Fig.
4.25, each of the WOIs is followed by a span of fibre to be connected with the
neighboring WOI, which forms the ring under investigation. This section also uses
the terms ‘BS’ and ‘WOI’ for similar meaning. For simplicity, all the fibre spans are
considered to be equal having a transmission attenuation of 0.2 dB/km.
The power budget and the power margin in the downlink direction for the Mth BS
(1≤ M ≤ N), can be calculated by:
PR
BSM
= T
LSCO
– L
MUX
– L
MOD
+ G
BAMP
– M*L
SMF
– (M-1)L
ThroughWOI
– L
DropWOI
…………………………… (5)
155
Chapter 4: Characterisation and Enhancement of Links Performance
Incorporating WDM Optical Interface
PM
BSM
= PR
BSM
– Sensitivity
BSM
……………… (6)
where PR
BSM
and PM
BSM
are the received optical power and the power margin at
the PD of Mth BS (BS
M
), Sensitivity
BSM
is the sensitivity at the PD of BS
M
, T
LSCO
is
the optical power from the respective light-source in the CO, L
MOD
is the loss in
OSSB+C modulator, G
BAMP
is the gain from the boost-amplifier in the downlink
path, L
SMF
is the attenuation in each of the fibre span between two consecutive WOIs,
L
ThroughWOI
is the through channel loss of WOI, and L
DropWOI
is the drop-channel loss
of WOI while recovering the desired downlink by the respective WOI.
SMF
1
WOI
1
WOI
N
WOI
M
SMF
M
S
M
F
N
EDFA
λ
1
λ
Ν
λ
2
DL
OSSB+C
∑
Central
Office
∑
PD
N
PD
2
PD
1
SMF
N+1
DLPD
UL
OSSB+C
SMF
1
WOI
1
WOI
N
WOI
M
SMF
M
S
M
F
N
EDFA
λ
1
λ
Ν
λ
2
DL
OSSB+C
∑
Central
Office
∑
PD
N
PD
2
PD
1
SMF
N+1
DLPD
UL
OSSB+C
Fig. 4.25: Simplified optical link in ring/bus architecture showing the relevant components and
subsystems in the CO and BS.
Equation (5) can be simplified by using the values of the parameters from the
experiment (described in Section 4.4) as well as the Table 4.2. The experiment uses
10 km SMF between to CO and the BS. To use the results from the experiment for
this analysis, we consider the first span of fibre 10 km, while the others are 1 km
each. After such considerations, Equation (5) can be simplified as:
PR
BSM
= -6.0 – (M-1)3.4 ………………… (7)
156
Chapter 4: Characterisation and Enhancement of Links Performance
Incorporating WDM Optical Interface
Therefore, received optical power at the PD of BS
1
(where M = 1):
PR
BS1
= -6.0 (dBm).
The power margin at the PD of BS
1
can be calculated by using the sensitivity of
the recovered signal (shown in Fig. 4.15), which is -14.2 dBm. Therefore, power
margin at the PD of BS
1
,
PM
BS1
= 8.2 (dB)
If the power penalty is considered to add up linearly with increasing number of
BSs and the BSs (WOIs) are considered to be identical, then the number BSs
supported by the link can be calculated by:
PM
BSN
= (N – 1)( PP
Through
+ L
ThroughWOI
) +N (1 km x0.2 dB/km) ……… (8)
where N is the number of WOIs in cascade spaced by 1 km of SMF, PM
BS1
is the
power margin at the PD of BS1, PP
Through
is the power penalty experienced by the
through channels for traversing each stage of WOI, and L
ThroughWOI
is the insertion
loss experienced by the through channels in a WOI.
By using the values noted in Table 4.2, number of units in cascade can be
calculated by:
8.2 = (N-1) x 3.6 + 0.2N
» N = 11.8/3.8 = 3.1
≈
3 units
However, if the lossy multiport OCs in the WOIs in the experiment (described in
Section 4.4) are replaced with standard OCs having typical through channel
insertion loss (typical through loss 1dB/WOI) and typical drop channel insertion loss
(typical loss 1dB/WOI), the number of units in cascade will increase to 7. Also, if
the insertion of the OSSB+C generator in CO can be reduced to 9 dB, the number of
157
Chapter 4: Characterisation and Enhancement of Links Performance
Incorporating WDM Optical Interface
units in cascade will increase to 11. The cascadability of the WOI with different
conditions can be tabulated as follows:
Star/Tree Ring/Bus
Actual Configurations 3 3
WOI Through & Drop Loss
Improved to 1 dB
8 7
OSSB+C Modulator Insertion
Loss Improved to 9 dB
13 11
Table 4.3: Number of WOIs in cascade
Therefore WDM optical interface proposed in Section 3.4 can be a suitable
candidate in future WI-DWDM mm-wave fibre-radio networks, configured in
ring/bus architecture, where the interfaces will be used along the fibre ring to enable
OADM functionality to the BSs, in addition to provide optical carriers for the
upstream transmission.
4.6 Performance Improvement of Fibre-Radio Links
Incorporating Modification in WDM Optical Interface
Millimetre-wave fibre-radio system, a wideband transmission medium, typically
requires a high spurious free dynamic range (SFDR). Increase of optical power in the
link can potentially resolve this problem; however, this method increases the average
optical power to the PD and causes nonlinearities to output of the PD, leading to
harmonic distortion to response reduction, and eventually to catastrophic failure
through complete damage due to high current or thermal effects [20, 21, 56, 57].
Concurrent with PD power limitations, the performance of wide bandwidth intensity
modulators, used in superimposing mm-wave signals onto optical carriers, are also
limited by very narrow linear characteristics. Therefore, modulation depths of such
158
Chapter 4: Characterisation and Enhancement of Links Performance
Incorporating WDM Optical Interface
wideband optical mm-wave signals are often sacrificed for less efficient modulation
by manageable mm-wave input powers, although high input power of modulating
mm-wave signals have the potential to enable larger modulation depths [20, 56].
These shortcomings in mm-wave fibre-radio systems result in very poor sensitivities
for the detected mm-wave fibre-radio signals, which need to be overcome by further
explorations.
To enable larger modulation depths without increasing input mm-wave powers,
several techniques based on active and passive means were introduced [20 - 22, 57-
60]. A similar technique has been proposed in Section 3.7 that also confirms the
significance of modulation depth enhancement by external means. However, all these
techniques require additional signal processing hardware, which are inherently
susceptible to further performance degradation and adding up new complexities to
the systems. Instead, if the modulation depth enhancement, which can be defined as
the reduction of the CSR, can be combined with the other system technologies by
avoiding additional devices, an effective modulation depth enhancement can be
realised.
Another drawback of carrier reused mm-wave fibre-radio systems incorporating
WDM optical interfaces is the generation of weaker uplink signals due to weaker
reuse carrier, higher insertion loss in OSSB+C generation, and the removal of EDFA
from the BSs. These weaker uplink signals may cause greater out-of-band crosstalk
while recovered and may stimulate the effects of nonlinearity in the link, and as a
result, may limit the link performance immensely. In order to realise greater uplink
signals, proper link budget as well maximizing the delivery of reuse carrier is
essential.
In the next section, we have modified the WDM optical interface proposed in
Chapter 3 that enables larger modulation depth in the downlink direction without
employing additional hardware. This scheme also allows the interface to deliver
greater reuse optical carrier for uplink communication that simultaneously enhances
the performance of the system in uplink direction.
159