Atomic Force Microscopy in Cell Biology Episode 1 Part 6 pdf
Bạn đang xem bản rút gọn của tài liệu. Xem và tải ngay bản đầy đủ của tài liệu tại đây (652.98 KB, 20 trang )
104 Smith
13. Baden, H. P. (1990) Hair keratin, in Hair and Hair Diseases., Ch. 3, (Orfanos, C.
E. and Happl, R., eds.), Springer-Verlag, Berlin, Heidelberg, pp. 45–71.
14. Nijeholt, J., Korertenm, H. K. and Wolff, F. (1994) Giant axonal degradation:
Scanning electron microscopic and biochemical study of scalp hair. Dermatology
188, 258–262.
15. Swift, J. A. (1979) Minimum depth electron probe X-ray microanalysis as a means
for determining the sulphur content of the human hair surface. Scanning 2, 83–88.
16. Swift, J. A. (1991) Fine details on the surface of human hair. Int. J. Cosmet. Sci.
13, 143–159.
17. Smith, J. R. (1997) Use of atomic force microscopy for high-resolution non-inva-
sive structural studies of human hair. J. Soc. Cosmet. Chem. 48, 199–208.
18. Hoffmann, K. (1991) Statistical evaluation of the evidential value of human hairs
possibly coming from multiple sources. J. Forensic Sci. 36, 1053–1098.
19. Sachs, H. (1995) Theoretical limits of the evaluation of drug concentrations in
hair due to irregular hair growth. Forensic Sci. Intern. 70, 53–61.
20. Pötsch, L. (1996) A discourse on human hair fibres and reflections on the conser-
vation of drug molecules. Int. J. Legal Med. 108, 285–293.
21. Jones, L. N. and Steinert, P. M. (1996) Hair keratinization in health and disease.
Dermatol. Clin. 14, 633–650.
22. Gummer, C. L., Dawber, R. P. R., and Swift, J. A. (1981) Monilethrix: An elec-
tron microscopic and histochemical study. Br. J. Dermatol. 105, 529–541.
23. Williams, D. F. and Schmitt, W. H. (1996) Chemistry and Technology of the Cos-
metics and Toiletries Industry, 2nd ed. Blackie, London, ISBN 0-7514-0334-2.
24. Sauermann, G., Hoppe, U., Lunderstädt, R., and Schubert, B. (1988) Measure-
ment of the surface profile of human hair by surface profilometry. J. Soc. Cosmet.
Chem. 39, 27–42.
25. Zielinski, M. (1989) A new approach to hair surface topography: Fourier trans-
form and fractal analysis. J. Soc. Cosmet. Chem. 40, 173–189.
Living Chondrocyte Surface Structures With AFM 105
105
9
Imaging Living Chondrocyte Surface Structures With
AFM Contact Mode
Gerlinde Bischoff, Anke Bernstein, David Wohlrab,
and Hans-Joachim Hein
1. Introduction
In its most established mode of operation, named constant force contact
mode, atomic force microscopy (AFM) has been applied to image the 2D and
3D architecture of surfaces. Any deflection of the tip as a result of surface
topography is recorded. The microscope reconstructs an image of the surface
from the x, y, and z scan data to develop a 3D illustration of any surface at the
micro- and nanometer level. The production of high-resolution images of a
wide variety of biological samples at near-native conditions and the possibility
to measure very low local forces is proving to be a powerful tool for cell analy-
sis (1,2). In contrast with electron microscopy observations in particular, AFM
improves biological studies involving imaging by also monitoring dynamic
processes. However, the investigation of soft biomaterials with this special
method is still challenging. This chapter reviews practical details of imaging
two cell lines: human chondrocytes and human osteosarcoma. However, char-
acteristics described are not unique to this type of cell. Principally, all types of
adherently growing cells can be investigated with the techniques described
here. Force curve analysis, as a backdrop for the understanding of the received
images (1), will be introduced in detail in Subheading 3.4. Further sections
explore how AFM can be used as a helpful tool in observations of the cell
surface and the physical interactions that occur there, like adhesion or friction,
and their influence on the active cell. In Subheading 7. common artifacts and
troubles are described, along with the practical instructions.
From:
Methods in Molecular Biology, vol. 242: Atomic Force Microscopy: Biomedical Methods and Applications
Edited by: P. C. Braga and D. Ricci © Humana Press Inc., Totowa, NJ
106 Bischoff et al.
2. Cell Lines
2.1. Characteristics of Chondrocytes
Investigations were performed on human chondrocytes isolated from human
osteoarthritic knee joint cartilage. The cartilage was isolated from cartilage
bone fragments resected during the insertion of knee prostheses. All patients
presented gonarthritis. No other relevant disease—particularly rheumatoid
arthritis—was present. Immediately after the resection, the cartilage bone-frag-
ments were potted in sterile L15 medium (Seromed, Berlin, Germany). There-
after, the cartilage was handled as described elsewhere (3).
Cartilage is comprised of a large amount of functional extracellular matrix
that is made and maintained by a small number of chondrocytes, the sole resi-
dent cell type. Chondroblasts and chondrocytes secrete cartilage matrix, and
chondrocytes are also embedded therein. The bones of a developing or restor-
ing limb form through the process of endochondral bone formation. In the
beginning, mesenchymal cells condense and cells in the core differentiate into
chondrocytes, and the cells at the periphery differentiate into the perichon-
drium. Articular cartilage has several features that impact on the fate of
bioactive bodies. Chondrocytes are anchored in the extracellular matrix and
are surrounded by a pericellular matrix. Of particular interest regarding dense
connective tissues, recent experiments have shown that mechanotransduction
is critically important in vivo in the cell-mediated feedback among physical
stimuli, the molecular structure of matrix molecules (e.g., collagen), and the
resulting macroscopic biomechanical properties of the tissue (4–7).
2.2. Characteristics of Human Osteosarcoma
Human osteosarcoma (HOS), a human osteogenic sarcoma cell line, was
purchased from American Type Culture Collection (Rockville, MD). The cells
were cultured in a medium volume equivalent to 1:1 mixture of Dulbecco’s
modified Eagle’s medium (DMEM) and Ham’s F-12 medium containing peni-
cillin (100 U/mL) and streptomycin (100 µg/mL) and 10 vol% fetal bovine
serum. The HOS cells exhibit a flat morphology, low saturation density, low
plating efficiency in soft agar, and are sensitive to chemical and viral transfor-
mation (4).
The nontumorigenic, as well as the immortal tumorigenic, osteoblast-like
human osteosarcoma cells are used in many laboratories along with their large
number of derivatives. Because they are one type of potential hormone-related
cancer, the number of studies is incredibly high (8,9). For these cells to reach
their functional differentiated state the action of specific factors is required.
Mechanical stress is an important regulator of bone metabolism. Fluid shear
stress caused by mechanical load in bone tissue has been shown to be impor-
Living Chondrocyte Surface Structures With AFM 107
tant to both the bone structure and function through its effects on osteocytes
and osteoblasts. Many hypotheses about the mechanotransduction system in
bone cells have been proposed. Recent findings suggest that the physiological
level of fluid shear stress induces the production of crucial proteins in human
osteosarcoma cells via the cation channel function and, as a result, may there-
fore promote bone formation (10).
3. AFM Contact Mode in Biology
In an AFM the tip is mounted on the end of a flexible cantilever. As the
sample is scanned beneath the tip, small forces of interaction with the sample
cause the cantilever to deflect, revealing the sample’s topography. The most
common approach—called an optical lever—is to reflect a laser beam off the
backside (upper side) of the cantilever into a four-segment photodetector (quad-
rant). The difference in output between the detectors is then proportional to the
deflection amplitude. Important to note is that the limiting factor in motion
detectors is not the sensitivity of the photodetector itself (deflections as small
as 0.01 nm can be detected), but the intrinsic vibration of the cantilever attrib-
utable to Brownian motion.
The cantilever is integrated with a sharp tip on the end and characterized by
its material (usually silicon nitride for contact mode investigations), its spring
constant, and its geometric properties (usually parabolic or pyramidal tip shape
with a curvature radius of 20–40 nm). The spring constant, k
n
(determined by
thermal vibration in air) varies from 0.06–5 N/m. Low spring constants are sen-
sitive to uncontrolled vibration of the tip released by tip–sample interactions.
3.1. Contact Mode Description
In the contact mode, the tip touches the surfaces at all times with constant
force, sliding over the surface as the sample is scanned line by line. Thereby
topographic information is received by monitoring the change in cantilever
deflection. Force-distance curves are obtained by plotting the vertical displace-
ment of the cantilever, as a function of the separation between the tip and the
sample. The force curve is an approach-retract cycle, in which the sample first
approaches the tip (see Fig. 1) and is subsequently retracted from the tip. The
cantilever deflection ∆z is then converted into force (F
n
) according to the rela-
tionship (11):
F
n
= k
N
∆z
Since normal spring constants for cantilevers are 0.01–100 N/m and instru-
mental sensitivities for normal deflections are up to approx 0.01 nm, the corre-
sponding limits in force detection are 10
–13
–10
–8
N (12).
Because of their softness, the biological membranes of viable cells become
significantly indented upon contact by the AFM scanning tip, even at low
108 Bischoff et al.
forces. Always exercise caution when interpreting the topographic features,
however, because of the convolution of the tip shape (1,11–14).
To this point, we have focused on imaging mechanisms that rely on deflec-
tions of the tip with respect to the surface normal. The force generated when
the tip is moved laterally over the sample surface can also be used as an imag-
ing mechanism (phase or friction mode). The energy differences in trace-retrace
plots are indicative of the energy dissipated in the scan. Attractive and repul-
Fig. 1. Favorable force–distance curve of an adherent cell. (A) No interaction force
detectable at large tip–sample distances. The distance of the scanner movement is
represented by the horizontal axis, and the cantilever deflection is represented by the
vertical axis. In the case shown, there are minimal long-range forces, so this
“noncontact” part of the force curve shows no deflection. (B) As the probe tip is
brought very close to the surface, it may jump into contact (see circled area), if it
feels sufficient attractive force from the sample. Sometimes repulsion force induces
elongation in other directions. As the tip moves further in the positive z direction, a
positive linear cantilever deflection is observed as the tip and sample move together. If
the cantilever is sufficiently stiff, the probe tip is able to indent into the surface at this
point. If this takes place, the slope of the contact part of the force curve can provide
information about the elasticity of the sample surface (12). After loading the cantile-
ver to a desired force value, the process is reversed. As the sample moves in the oppo-
site (negative) z direction, a similar cantilever deflection line is traced as the tip and
sample remain in contact. (C) As the tip moves further in the negative z direction, the
restoring force exerted by the bending of the cantilever overcomes the adhesive force
of the tip–sample contact. At this point, the adhesion is broken and the cantilever
comes free from the surface. This can be used to measure the rupture force required
to break the bond or adhesion (12,13).
Living Chondrocyte Surface Structures With AFM 109
sive forces lead to information about the hydrophobicity and hydrophilicity of
the specimen (15). Changes in the “friction” images indicate quite well the tip–
surface interactions. This is also true of a tip with a truncated apex ratio—the
lateral force is rather insensitive to minor cantilever stiffness, different from
the topography scan (16,17). In the case of round massive cells, high lateral
forces, however, still hamper stable imaging (see Chapter 4).
4. AFM Instrumentations
AFM investigations were done at room temperature in air (samples covered
with a droplet of water) or in buffer solution. We used the commercially avail-
able Digital Instruments Nanoscope III in constant force contact mode. Gener-
ally, the 512 × 512 pixel images were captured with a square scan-size between
0.6 and 100 µm at a scan rate of 0.2–5 scan lines/second (s) (0.2–5 Hz). Sharp
Si
3
N
4
-cantilevers, each with a pyramidal tip, were used. Their spring constant
was 0.1–5 N/m. Best results were obtained by using cantilevers with a spring
constant about 0.5–1 N/m. To avoid cell damage, the feedback set point was
adjusted frequently to 0.1–10 nN in order to optimize the contact force.
5. AFM Imaging Conditions
The data were acquired simultaneously with the height, the deflection, and
the friction signals (see Fig. 2 to distinguish between the modes). The height
mode monitors the topography. The deflection mode, as the first derivation of
the height mode, offers supplementary details of the cell structure. The friction
signal was used to investigate the lateral force interaction between the tip and
the sample.
AFM Si
3
N
4
tips should in principle be oxidized and hydrophilic; however,
in practice they will be hydrophobic owing to hydrocarbon contamination
(11,12). Fluid imaging with AFM requires a special tip holder (“contact mode
fluid cell” from VEECO Metrology Group [Mannheim, Germany] was used).
For the microscopical studies, the chondrocytes and HOS cells were seeded
onto round glass cover slips (4-mm diameter). These cover slips were attached
to the bottom of the fluid cell with vacuum grease to standard magnetic AFM
mounting plates, before being covered with some droplets of media. When the
tip dives into the liquid medium, the laser reflections have to be carefully
inspected to exclude “false” reflections, which occur when the tip comes in
contact with the liquid surface. Usually our measurements were done at room
temperature in aqueous phosphate buffer solution. Good imaging and detec-
tion of cell activity could be obtained in the constant force contact mode. The
cantilever was carefully approached to the surface (see Subheading 7.8.), in
order to collect the first images in the “low-contact” mode (Fig. 1, region B)
and to avoid strong physical contact between the tip and the sample surface.
110 Bischoff et al.
110
Fig. 2. Simultaneous AFM images of HOS cells in buffer observed with different modes: height (left), deflection (center), and
friction (right). The topography is monitored by the height mode. The deflection mode, as the first derivation of the height mo
de,
offers more details of the cell structure. The friction signal was used to investigate the lateral force interaction between th
e tip and
the sample. Generally, large contrast in friction image often indicates active parts.
Living Chondrocyte Surface Structures With AFM 111
Later on, scans were done in contact mode with increased forces. Under favor-
able conditions, cells could be observed for up to 8 hours (h) depending on the
cell viability (18). Frequently, undefinable cantilever vibrations induced by
diffusion processes or cell motion are challenging problems. As a practical
note, best observation conditions occur at night, when the neighborhood vibra-
tions are minimized.
6. AFM Contact Mode Imaging of Living Cells
Cantilevers with a spring constant have a reduced sensitivity to vibrations
and are used successfully to surmount undefinable cantilever deflection. It is
of great importance to adjust and minimize the force carefully and to avoid cell
damage (see Subheading 7.). In contact mode, true molecular resolutions could
be achieved. The investigation of adherently growing cells with very low pres-
sure on the tip resulted in diminished cell motion and improved the study. Well-
resolved topographic information could be obtained. Zooming-in allows the
recording of pictures with increasing detail. Especially in fluid medium, the
investigation of active cells offers numerous facts. As an example of dynamic
interactions, a series of images collected from chondrocytes and HOS cells in
buffer is presented in Figs. 3–6).
High-resolution images of inner pore processes from the chondrocytes could
be visualized (Fig. 3 and 4). During the pore diameter reduction, the surface
potential in the immediate vicinity changes noticeably. The dynamic interac-
tion is followed by secretion. Large differences (high contrast) in the friction
images of several chondrocyte measurements (Fig. 4) point out an active part
of the cell surface. The data was recorded during an interval of more than 2 h.
The friction images remained a rather constant dynamic during this time (19).
This is an indication of the viability of the material (18). This time interval of
several hours seems long enough to study cell stimulations with mediators (e.g.
cytokines, mitogens, enzyme substrates) and thus offers great promise for
future experiments.
However, the round massive chondrocytes should not be as suitable for AFM
observations as the flat HOS cells. In (Fig. 5). the secretion on their cell sur-
face is monitored (see in particular some cell excrements marked out in frames
A and B). In this case, we were able to obtain good-quality images quite easily
and visualize the cell structure. A collection of force-distance curves could be
collected in order to control whether the tip indented the soft cell surface or
not. Indentation increases with the applied force and reaches a maximum value,
after which tip-soiling damage occurs. However, the surface penetration results
in almost any case in more or less tip contamination. While the shape of the
biofouled tip had broadened at the apex in comparison with that of the original
112 Bischoff et al.
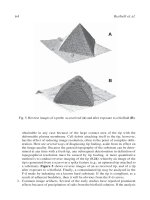
Fig. 3. Zooming in on chondrocyte topography. Frame marks zooming area of next
image.
Living Chondrocyte Surface Structures With AFM 113
tip, further investigation had to be done after replacing the tip. These effects
and objections are described in more detail in Subheading 5.
7. Notes on Specific Details
7.1. Adherent Growing Cells Pose a Problem: Their Topography is Too
Complexly Exhibited for Scanning
AFM was used to investigate different viable cells. Scanning whole cells
under physiological conditions, in media or buffer solutions, poses some prob-
lems (12,16,18).
Since most cells are too large to observe them as a whole (Fig. 5), only
portions of the cells can be investigated. Figs. 7 and 8A (pp. 117, 118) show
rare examples of cancer cells that are small enough to scan whole. Numerous
Fig. 4. Comparison between height and friction mode imaging. AFM observation
of chondrocytes in buffer. The measurement time is shown in each picture. All images
span an actual field of 850 × 850 nm. (A) Topography scan over 1 h simultaneous in
height and friction mode. The approximate pore diameter is reduced from 382 ± 10 nm
to 338 ± 10 nm.
114 Bischoff et al.
114
Fig. 4. (B,C) Large potential differences in the friction image of several measurements indicate an active part of the cell
surface. During the pore diameter reduction, the surface potential in the immediate vicinity changes noticeably. A circle marks
one active center on the cell surface. The timely changed contrast in friction mode between measurements indicates diminishing
cell surface activity. This can be studied with much more detail by using different colors (15).
Living Chondrocyte Surface Structures With AFM 115
problems result in investigating the identical local position several times by
AFM, after the material has left the Nanoscope instrument for other investiga-
tions. Molecular marker might help to solve this problem.
7.2. High Resolution Imaging of Cell Surfaces Requires Tight
Attachment to Substrates
Imaging of loosely adhered cells enabled determination of the cell size and
investigation of larger structures and pseudopodia but failed in resolving more
detail.
7.3. Highly Dynamic Cell Surfaces Require Fast Scan Rates
Measurements in air only allow for limited examinations of the cells. Dry-
ing up processes strongly change the cell surface. As quickly as 10–30 min
after beginning, dynamic interactions could no longer be monitored. Usually
the cell structure collapses (example given in Fig. 7). When no dynamic
Fig. 5. Overview of the flat epithelial HOS cell in buffer observed in deflection
mode. The secretion on the cell surface is monitored (some cell excrements in frame B
are magnified in Fig. 6).
116 Bischoff et al.
116
Fig. 6. Zooming in on frame B of Fig. 5 (same z scale for both figures). Increasing contrast in the deflection mode indicates
growing roughness of the surface.
Living Chondrocyte Surface Structures With AFM 117
changes were detected (usually after 30 min), the scan rate can be reduced
from 5–0.2 Hz to increase image quality and resolution.
Fast scan rates in buffer induce several troubles (such as buffer turbulences)
and undefinable cell vibration. Therefore, the scan rate is critical and dynamic
interactions can only be monitored with restriction.
7.4. The Buffer Sometimes Crystallizes During Liquid Evaporation
Under the required conditions, the buffer frequently crystallizes during liq-
uid evaporation. These crystals can be identified easily by their symmetric
structures (phosphate buffer crystals are marked out in Fig. 8A).
7.5. Protein Serum Covers the Cell Surface Like a Dense Carpet
The protein cover from a cell-culture procedure resembles to a high degree
the protein surface of the washed cells, but it demonstrates a more homoge-
neous friction signal showing small changes with time. However, to distin-
Fig. 7. Collapsed cell structure obtained in height mode AFM. The shape of the
nucleus is visible. The cell margins (five white edges) are lifted on account of drying
processes.
118 Bischoff et al.
118
Fig. 8. Collection of frequent artifacts. (A) crystallization of phosphate buffer during liquid evaporation (circle); deflection
mode data. (B) Serum protein layer from cell culture medium covers the cells (see Subheading 7.5.); height mode data.
Living Chondrocyte Surface Structures With AFM 119
guish between the serum cover and the actual cell surface is at times very dif-
ficult (see Fig. 8B). Rinsing the cover slips with PBS several times before
AFM observation is always necessary to remove the coating.
7.6. Soft Collagen Material Differs Clearly from Viable Cell Material
As shown in the force calibration plots of pure collagen material (Fig. 9),
the tip–surface interaction can be discriminated easily from active cell parts by
the shape of the curve. Approaching the surface over a long range (around
several micrometer) leads to a low-force indentation of the tip into the moist
and soft collagen matrix (Fig. 9A). No change in the shape of the force curve
can be observed by retracting the tip. Therefore, it can be concluded that the tip
has no attraction or repulsion interaction with the collagen sample. This can be
used as reference to identify local collagen collectives (see Figs. 5 and 6).
When collagen dries up, it becomes a stiffer material with less depth and
consequently it would receive a shallower indentation. An example is shown
in Fig. 9B and C. The sample structure collapses after water evaporation (see
x-axis). As the sample is approached to the tip, a strong positive linear cantile-
ver deflection is observed after contact when the tip and sample move
toghether. When the motion of the sample is inverted (retracting portion of the
curve), a similar cantilever deflection line is traced, but this time shifted sev-
eral nanometers due to tip and sample remaining in contact.
7.7. The Shape of the AFM Tip Is Always Critical in Sample Measurements
The quality of the tip (e.g., radius of curvature, morphology, hardness, and
surface composition) influences strongly the quality of AFM investigations.
Most commercially available tips have a curvature radius of 30–50 nm with a
pyramidal geometry. (Several others alter the tip morphology to enhance im-
aging capabilities.) Additionally, the tip may bind proteins or membrane de-
bris that diminish the resolution. Special coatings exploit this situation and
make molecular interaction force measurements possible (12).
7.8. Attraction and Repulsive Interactions of the Tip Cause
Misinterpretations, Especially With Viable Cells
Typically, when the tip approaches the surface, the deflection value increases
to the set point, indicating surface contact. As soon as the tip is in contact with
the cell surface, the active cell induces electronic signals by disturbing the
scan. Sometimes, it seems that the cells are tickled by the tip (or the applied
potential) and shake themselves. This movement overestimates the determined
cell-size (Fig. 10; ref. 20). Force-distance curves display uncontrolled vibra-
tions of the tip. Undefinable surface tension forces could influence tip retrac-
tion (local attraction and repulsive forces could be detected).
120 Bischoff et al.
Fig. 9. Force calibration plots of dried up collagen material isolated from fibro-
blasts. The spring constant is 0.1 N/m. (A) Soft collagen sample with high amount of
water. The average slope is about 0.4 mV/nm. (B) Partly dried up sample. The average
slope is about 0.5 mV/nm. (C) Dry collagen sample. The average slope is about 6.0
mV/nm. Observation time is indicated.
Living Chondrocyte Surface Structures With AFM 121
By repeating the approaching procedure to physical contact, nearby the set
point (∆U about –0.1 V) the tip–sample distance jumps to higher values and
Fig. 10. AFM observation of adherently growing cells (hypopharynx carcinoma)
(16). (A) Viable cells investigated in noncontact mode. The cells are displayed with an
unreal softness. The z deflection changes by only a few nanometers. (B) Viable cells
investigated in contact mode. Released from tip–surface contact the cells induce elec-
tronic signals and move. The z range changes are large. This movement overestimates
the determined cell-size (same cell as Fig. 10A).
122 Bischoff et al.
evades a successful approach. Strong tip vibrations are observed. An explana-
tion could be that the cell dodges or repels the tip (data not shown). Even after
a while, viable cells seem to remember the procedure, because they induce
strong tip vibrations and make repeated scans impossible. Moving to another
part of the sample (tested up to a few millimeters) cannot prevent the repul-
Fig. 11. Force–distance curve of a sample, which induce strong tip–sample interac-
tions. Black line, approach curve; gray line, retraction curve. (A) At large tip–sample
separations, there is no detectable interaction force. As the distance decreases, long-
and short-range forces can be determined. (B) At some separation, the gradient of
interaction energy exceeds the restoring force of the cantilever and the tip jumps to
contact with the surface. If the interaction is too strong (bottom), no successful scan
can be performed. (C) As the tip moves further in the negative z-direction (retracting),
the restoring force exerted by the bending of the cantilever overcomes the adhesive
force of the tip–sample contact and the tip breaks away from the sample. An idealized
curve shows strong linear lines as shown in Fig. 1. The deflection curves presented
here indicate tip contamination.
Living Chondrocyte Surface Structures With AFM 123
sion. If such a phenomenon occurs, another successful approach and further
investigation are impracticable.
To avoid such troubles the force and the cantilever sensitivity have to be
optimized. A higher spring constant prevents the uncontrolled vibration of the
tip, but results more often in cell damage. When the interaction between the tip
and the surface is very strong, it seems very much like a scan done in honey or
highly viscous material. Tip contamination often occurs. This is explained in
detail in Fig. 11.
7.9. Cells Can Contaminate or Stick to the Scanning Tip
Occasionally during the scanning procedure, the tip is covered with an in-
definite cluster. Tip-biofouling caused by cellular damage and pick-up of
loosely adhered particles generate artifacts that will compromise the experi-
ment. Since the tip geometry is critical for force measurements and accurate
topography determination, this has to be avoided in all cases.
Acknowledgments
The illustrations presented would not have been made without the encour-
agement and cooperation of Grit Helbing, Ottilie Pietz, and Angela Rosemeier
of the Medical Faculty Halle. Their help is gratefully acknowledged. The
authors thank Robert Bischoff and SENSOBI Sensoren GmbH. Their instru-
mental service is highly appreciated. The Ministry of Culture and Education of
Saxony–Anhalt and the BMBF have supported our research.
References
1. Ricci, D. and Grattarola, M. (1994) Scanning force microscopy on live cultured cells:
imaging and force-versus-distance investigations. J. Microscopy 176, 254–261.
2. Oberleithner, H., Brinckmann, E., Giebisch, G., and Geibel, J. (1995) Visualizing
life on biomembranes by atomic force microscopy. Kidney Int. 48, 923–929.
3. Wohlrab, D., Wohlrab, J., Reichel, H., and Hein, W. (2001) Is the proliferation of
human chondrocytes regulated by ionic channels? J. Orthop. Sci. 6, 155–159.
4. Grodzinsky, A. J., Levenston, M. E., Jin, M., and Frank, E. H. (2000) Cartilage
tissue remodeling in response to mechanical forces. Annu. Rev. Biomed. Eng. 2,
691–713.
5. Hein, H J., Brandt, J., Bernstein, A., Engler, T., and Weisser, L. (1997) Zur
Darstellung der Mikrostruktur des Knochens mit dem Raster-Sondenmikroskop.
Z. Med. Phys. 7, 21–26.
6. Henning, S., Adhikari, R., Michler, G. H., Seidel, P., Sandner, B., Bernstein, A.,
and Hein, H J. (2001) Analysis of the bone-implant interface of a partially
resorbable bone cement by scanning electron and scanning force microscopy, in
Micro- and Nanostructures of Biological Systems, (Bischoff, G. and Hein, H J.,
eds.), Shaker-Publ., Aachen, pp. 109–120.